S H O R T C O M M U N I C A T I O N
Open Access
Floating layer formation, foaming, and microbial
community structure change in full-scale biogas
plant due to disruption of mixing and substrate
overloading
Tobias Lienen
1, Anne Kleyböcker
1, Manuel Brehmer
2, Matthias Kraume
2, Lucie Moeller
3, Kati Görsch
3and Hilke Würdemann
1*Abstract
Background:The use of biogas as renewable resource of energy is of growing interest. To increase the efficiency and sustainability of anaerobic biogas reactors, process failures such as overacidification, foaming, and floating layers need to be investigated to develop sufficient countermeasures and early warning systems to prevent failure. Methods:Chemical, rheological, and molecular biological analyses were conducted to investigate a stirring disruption in a full-scale biogas plant.
Results:After the agitation system was disturbed, foaming and floating layer formation appeared in a full-scale biogas plant fed with liquid manure and biogenic waste. Rheological characterizations and computational fluid dynamics (CFD) revealed a breakdown of the circulation within the reactor and a large stagnation zone in the upper reactor volume. Molecular biological analyses of the microbial community composition in the floating layer showed no differences to the digestate. However, the microbial community in the digestates changed significantly due to the stirring disturbances. Foam formation turned out to be a consequence of overloading due to excessive substrate supply and disturbed mixing. The subsequent increase in concentration of both acetic and propionic acids was accompanied by foaming.
Conclusions:Effective mixing in full-scale biogas plants is crucial to avoid foaming and floating layers and to enhance sustainability. Disturbed mixing leads to process imbalances and significant changes in the microbial community structure. Additionally, controlled feeding might help prevent foam formation due to overloading.
Keywords:Full-scale biogas plant; Biogenic waste; Floating layer; Agitator disruption; DGGE; Foam formation
Background
Anaerobic cofermentation of biogenic wastes to produce biogas is of growing interest to generate renewable en-ergy and to reduce greenhouse gas emissions. The pro-duction of biogas by biogenic wastes is a decentralized technology and contributes toward the renewable energy turnaround in Germany. Biogas plants are often affected by process failures such as overacidification or foam and floating layers that reduce the efficiency of plants. A
breakdown of the biogas production process because of process failures leads to enormous economical loss and de-teriorated sustainability [1]. Selection of suitable substrates and proper mixing are important challenges in the biogas production industry to avoid failures of the process. Feed-ing with profitable but unsuitable substrates may lead to serious process interruptions. An overacidification event is often caused by substrate overloading and accumulation of volatile fatty acids (VFA) [2]. Kleyböcker et al. [3] devel-oped two early warning indicators in terms of overacidifi-cation. The first indicator (EWI-VFA/Ca) is characterized
* Correspondence:[email protected] 1
GFZ German Research Centre, Telegrafenberg, 14473 Potsdam, Microbial GeoEngineering, Germany
Full list of author information is available at the end of the article
by the relation of VFA to Ca2+and was shown to provide a warning 5 to 7 days before an overacidification appeared. The warning is indicated by a two- to threefold increase of values. The second early warning indicator (EWI-PO4/Ca) is characterized by the relation of PO43−to Ca2+.
Moeller et al. [4] showed a correlation between the fed substrates as well as inadequate plant management and the formation of foam in biogas plants. Foaming can be caused by high concentrations of VFA, surface-active compounds, detergents, proteins, and high nitrogen con-centrations as well as organic overloading [4]. In contrast, the formation of floating layers is mainly triggered by in-adequate mixing and feeding of fibrous substrates [5]. Be-sides the chemical and physical characteristics of the substrates and the plant management, foam and floating layers are also promoted by growth of filamentous bacteria [6,7]. Most of the studies regarding the filamentous bac-teria were done in activated sludge treatment plants and anaerobic digesters fed by sewage sludge. In these systems, mainlyGordoniaspp. andMicrothrixparvicellawere iden-tified as foam causers [8,9]. Using their filamentous struc-ture, the microorganisms trap biogas bubbles, which transfer them to the surface. The hydrophobic cell surface promotes and stabilizes the foam as well as the release of hydrophobic substances. Foaming and the formation of floating layers may cause serious damage in biogas plants [10]. The active volume of the digester is reduced leading to an inefficient gas recovery. Furthermore, gas mixing de-vices may be blocked, gas pipelines may be fouled, and even the roof may be damaged by the pressure of the foam or floating layer. In addition, the economical costs of en-ergy loss, manpower overtime, and cleaning costs have to be taken into consideration [11]. Although several studies on foam formation in anaerobic digesters treating acti-vated sludge were published [8,12], formation of floating layers and foam in anaerobic digesters fed with biogenic waste and the impact of mixing procedures in full-scale biogas plants as well are still rarely investigated. Most
importantly, information about the chemical composition and microbial community structure of the floating layer is lacking due to the difficulties of sample collection in full-scale digesters. The objective of the study presented in this paper was to investigate the alterations in rheological, chemical, and microbiological parameters during an agita-tor disruption accompanying floating layer and foam for-mation in a full-scale biogas plant treating biogenic waste. In addition, the repair of a broken stirring paddle allowed for analyzing a floating layer chemically and microbio-logically. Furthermore, two early warning indicators for overacidifications were used to investigate the process per-formance in the floating layer. The results of this study give further insight into the improvement of the efficiency of the biogas production process as well as understanding of the complex microbial community composition.
Methods
Biogas plant scheme, process operation, and sampling
The full-scale biogas plant was run as a two-stage plant consisting of two hydrolysis reactors H1 and H2 (520 m3) operated at 30°C and two methanogenic reactors R1 and R2 (2,300 m3) operated at 37°C (Figure 1). The hydraulic retention time was kept within the range of 26 days. Liquid manure (50,000 t/a) and a highly variable combin-ation of biogenic wastes (30,000 t/a) from the fish industry and oil from fat separators as well as creamery and slaugh-terhouse waste were fed as substrates. R1 and R2 were charged in turn every 4 h by 15 m3substrate. Mixing was conducted by continuous stirring with paddles in two dif-ferent heights. The methanogenic reactors were operated at an organic loading rate between 2 and 2.5 kg VS m−3 day−1. The produced biogas consisted of 60% to 65% CH4.
The biogas production was about 4.4 million m3/a while the digestate residues yielded 61,000 t/a. The methano-genic reactors R1 and R2 were monitored from the start of an agitator breakdown in these reactors over a period of 6 months. In month 5, stirring was reconstituted. While
Substrate storage
Hydrolysis 1 (H1) 520 m3
Hydrolysis 2 (H2) 520 m3
Torch Reactor 2 (R2)
2300 m3
Reactor 1 (R1) 2300 m3
Gas
buffer Desulfurization CHP CHP
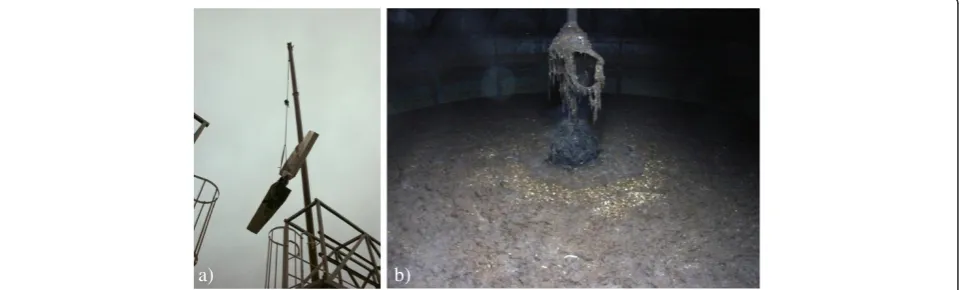
the agitator motor in R1 broke down completely, R2 was af-fected by one broken stirring paddle (Figure 2a). During the first month, foam was observed in both reactors. The foam disappeared after 1 day without intervention. Additionally, a sample of a floating layer was directly collected during the reparation process of the broken paddle in R2 in month 5 (Figure 2b). In the first month, digester samples were with-drawn at the drain at the bottom of the two reactors bi-weekly. Afterward, sampling was conducted monthly.
Chemical analyses
For the total solids (TS) and the volatile solids (VS), about 50 g of the samples was dried at 105°C in a Memmert dry-ing chamber (Memmert GmbH, Hannover, Germany) for 24 h and then burned at 550°C (Nabertherm Controller B170; Nabertherm GmbH, Lilienthal/Bremen, Germany). The weight of the samples was determined using a Sartorius CP220S-OCE balance (Sartorius AG, Goettingen, Germany) (scale ± 0.01 g). The TS and VS were analyzed according to German guideline DIN 38409–1 [13]. For the chemical parameters and for DNA extraction, the samples were centrifuged 10 min at 12,857×g to pelletize solid sub-stances. Pellets were transferred into 1.5 mL tubes and stored at −20°C to extract DNA afterward. The super-natant was centrifuged again for 10 min at 12,857×g. The volatile fatty acids (VFA), calcium (Ca2+), and phos-phate (PO43−) concentrations were measured
photometric-ally (Hach-Lange DR2800, Hach-Lange cuvette tests LCK 365, 327, and 350; Hach Lange GmbH, Düsseldorf, Germany) in the second supernatant. Additionally, the two early warning indicators VFA/Ca and EWI-PO4/Ca for overacidifications and process imbalances
[3] were tested. The nitrogen and organic/inorganic carbon concentrations were detected in homogenized (using a common hand-held blender) samples by a TOC-VCSH/CSN analyzer containing a TN-unit (Shimadzu, Nakagyo-ku, Kyoto, Japan). The crude protein concentra-tion was determined according to the method of Dumas [14] with a modified determination method of total
nitrogen concentration (videsupra). The factor volatile or-ganic acids/total inoror-ganic carbonate buffer (VOA/TIC) determines the buffer capacity of the biogas producing system [15]. The VOA/TIC analysis was carried out ac-cording to the Nordmann method [16] using 20 mL of centrifugation supernatant (20 min, 5,300 rpm, and 20°C; Beckman Avanti 30 centrifuge, Brea, CA, USA). The 10-mL samples were filtered through a membrane filter (nylon, 0.45 μm, Pall Corp, Port Washington, NY, USA) for further analysis. The ammonia nitrogen concentration was measured using the spectrophotometric test kit Spektroquant® (Merck KGaA, Darmstadt, German) with photometer MuliLab P5 (WTW, Weilheim, Germany). The concentrations of volatile organic acids (acetic acid, propionic acid, and butyric acid) were measured by use of HPLC (Shimadzu: VA 300/7.8 nucleogelion 300 OA col-umn, 0.01 N H2SO4as eluent, and the detector RID-10A).
Water-elutable elements were determined by ICP-AES (according to EN ISO 11885, Spectro, Kleve, Germany).
Rheological characterization
Due to the complex structure of the substrate, the vis-cosity was determined by using different measuring sys-tems. Three relative methods - a pipe viscosimeter, a paddle mixer, and a ball measuring system - were com-pared with two standardized methods: the double gap and the cylinder measuring system. In the double gap measuring system, an additional static cylinder is in the center and the rotating measuring cylinder is hollow. Thus, two spaces are created between the inner stator and rotor as well as between the rotor and the outer wall. The calculations of the apparent viscosity ηS and
the shear rate γ_ are summarized in Table 1. The meas-urement systems used to describe the rheology differ in their measuring range. Apart from the results of the double gap measuring system, the viscosity showed the expected dependence on the shear rate. The higher values of this measuring system were due to the large friction of the particles contained in the substrate at the
a) b)
stator because of the small gap width. Based on this comparative study, the cylinder measuring system was chosen for further viscosity monitoring because it was easy to handle and required a comparably low sample volume. The rheological characterization of the sub-strates was performed over a period of more than 1 year, including the period when the agitator system was dis-rupted. The shear thinning characteristics of the sub-strate are described by the power law equation
ηS¼K⋅γ_n−1, wherein K stands for the Ostwald factor and ηfor the shear rate exponent. Based on this equa-tion, the flow regime of the biogas plant with its typical rheological characteristic was determined using the computational fluid dynamics (CFD) software CCM+. The cylindrical model, with a diameter of 13 m and a height of 15.3 m, had a two-stage central mixer in line with the plant. The height was equal to the liquid level; therefore, the ceiling of the cylinder and the boundary layer between the liquid and the gas phase was modeled assuming slip conditions. The lower agitator had a diam-eter of 4.2 m and was installed 4 m above the ground. A second agitator with a diameter of 2 m was placed at a height of 12 m above the ground. Both impellers were attached to the same shaft. The resulting liquid volume was displayed in the CFD software with a polyhedron
grid and approximately 4 million cells. This calculation area was broken down into a stagnant self-contained cy-linder and a rotating cycy-linder. To model the transfer of mass, momentum, energy, and other physical quantities between these two regions, the ‘indirect’ interface was used. For consideration of the agitator moving, the so-called moving reference frame model was applied. The rotation frequency was 42 rpm and steady state condi-tions were assumed. To compare both relevant process conditions, with and without a disrupted agitator, a sec-ond simulation with disrupted stirring was performed, while the boundary conditions were kept constant and the lower agitator blades were removed.
DNA extraction and PCR-DGGE analysis
To compare the diversity in the microbial community compositions, the total genomic DNA was extracted from 350 mg of the pellets using the MP Fast DNA Spin Kit for Soil according to the manufacturer's instructions. The partial 16S rRNA genes (566 bp) of the bacterial community were amplified by polymerase chain reaction (PCR) in 50μL reactions with 1μL of 1:10 diluted tem-plate using the primer pair 341 F-GC/907R [19,20] (94°C 2:45 min, 94°C 0:45 min, 56°C 0:45 min, 72°C 0:50 min, 72°C 30 min, 40 cycles). Amount of 50 μL of reactions was mixed containing 5μL 10× reaction buffer (Gene-craft, Lüdinghausen, Germany), 6 μL dNTPs (10 mM, Fermentas, Thermo Fisher Scientific, Waltham, MA, USA), 3μL MgCl2(50 mM, Genecraft), 3μL forward
pri-mer (10 mM), 3μL reverse primer (10 mM), 0.4μL BSA (20 mg/mL, Fermentas), 0.3 μL Taq polymerase (5 u/μL, Genecraft), 28.3 μL RNA/DNA-free water (Fermentas), and 1μL of 1:10 diluted template. Amplicons were puri-fied subsequently using the Fermentas GeneJET PCR Purification Kit (Fermentas, Thermo Fisher Scientific, Waltham, MA, USA) and the amplicon concentration was determined fluorimetrically (BMG Labtech FLUOs-tar OPTIMA; BMG LABTECH GmbH, Allmendgruen, Ortenberg, Germany) by labeling the DNA with Quant-iTPicoGreen (Invitrogen, Darmstadt, Germany). Denaturing gradient gel electrophoresis (DGGE) was performed after-ward with equal concentrations of amplicons and a gradient of 35% to 65% urea and 6% acrylamide (BioradDCode System, Munich, Germany). The DGGE gel ran for 17 h at 110 V and 60°C. Bands of interest were excised and transferred into a 0.5-mL tube. Amount of 50 μL of sterile H2O was added and removed directly to wash
the gel pieces. Afterward, 30μL sterile H2O was added.
The tube was shaken for 1 h at 37°C to recover the DNA out of the gel. Reamplification was carried out using 4 μL template of recovered DNA and the primer pair 341 F/907R (94°C 1:30 min, 94°C 0:30 min, 56°C 0:30 min, 72°C 0:30 min, 72°C 10 min, 30 cycles). PCR products were purified using the Avegene gel/PCR
Table 1 The calculation of the apparent viscosityηSand the shear rateγ_[17,18]
Measuring system Equation Constant
Double gab measuring system τ¼ 1þδ2
ðδ2⋅R2 3þR22Þ⋅
M
4000⋅πLCL CL= 1.10 δ= 1.0245 RMKi= 20.25 mm
_
γ¼ω⋅1þδ2
δ2−1 RMKa= 21.00 mm
L= 78.7 mm
Cylinder measuring system τ¼ 1þδ2 2000⋅δ2⋅2πL⋅MR2
i⋅CL CL= 1.10 δ= 1.0848 _
γ¼ω⋅1þδ2
δ2−1 RMKi= 13.33
L= 40.003 mm
Ball measuring cell τ=Css⋅M CSS¼15:0mNmPa
CSR¼0:427mins
_
γ¼CSR⋅n
dK= 12.0 mm
Paddle mixer [17] Ne¼ P
p⋅n3⋅d5¼CRelamCturb CMO= 10.94
Clam= 189.6
Cturb= 9.4 _
γ¼CMO⋅n
dR= 30 mm
dB= 143 mm
Pipe viscosimeter [18] τw¼d4⋅△⋅Lp Lpipe= 2,500 mm
dpipe= 43.2 dw
dr
w¼
3n0þ1 4n0 ⋅8⋅wdm
n0¼dln
d⋅△p
4⋅L ð Þ
DNA fragments extraction kit (MSP KOFEL, Zollikofen, Switzerland), and the DNA concentrations were measured fluorimetrically according to the procedure mentioned above. The PCR products were sent in and sequenced by GATC Biotech AG (Jakob-Stadler-Platz 7, Konstanz, Germany). Sequences were edited using the BioEdit Sequence Alignment Editor version 7.0.5.3 [21]. Basic Local Alignment Search Tool (BLAST) [22] was used for sequence similarity check, and the taxonomic as-signment was done by Ribosomal Database Project (RDP) using the RDP Classifier [23]. Based on the DGGE profiles, a graphical representation of the bacter-ial community evenness was set by using Pareto-Lorenz (PL) distribution curves [24] as previously described by Wittebolle et al. [25]. GelQuant.NET software provided by biochemlabsolutions.com was used to determine the band intensities. The band intensities for every DGGE lane were ranked from high to low and the cumulative band intensities were used as the y-axis. The cumula-tive normalized number of bands was set as the x-axis. Evaluation of the curves was conducted by comparison to a vertical 20% x-axis line. The theoretical perfect evenness line was set as 45° diagonal.
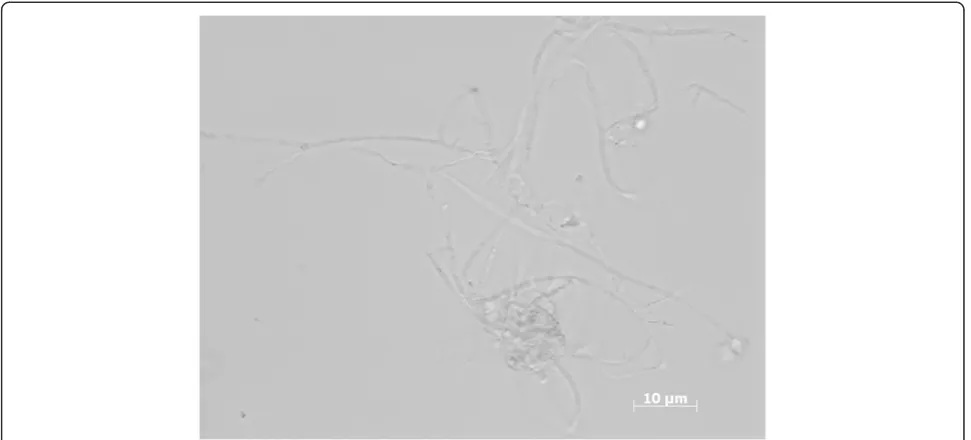
Microscopy
The floating layer sample was analyzed by bright field microscopy at a ×100 magnification (Zeiss Axio Imager M2; Carl Zeiss, Oberaue 3, Jena, Germany). Therefore, the sample was added to a drop of water on an object slide and viewed microscopically afterward.
Results and discussion
Foam formation related to substrate overloading
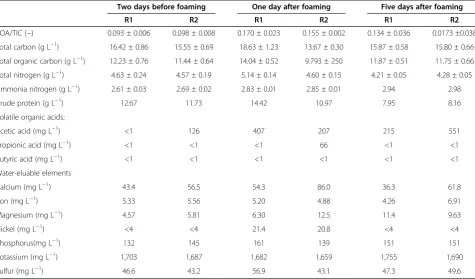
Formation of foam was observed in both methanogenic reactors on day 12 in the first month after high organic loading and agitator break-down. Since the monitoring started when the stirring was disturbed, chemical ana-lyses for the period before were not accessible. Besides breakdown and disturbance of stirring as a cause for the foam formation during the first month in both methano-genic reactors, changes in the substrate mix also have to be considered (Figure 3). The hydraulic retention time of the hydrolytic reactors was 11.2 days, and considering that the substrate feeding occurred in the period of 12 days before foaming in the methanogenic reactors, a peak in the total quantity of fed substrates was applied by the operator. After breakdown of agitation foaming occurred. The chem-ical characterization of the digestate from the time period before and after foaming is shown in Table 2. The increase of VOA/TIC values amounted to 0.08 and 0.06 during 4 days in both methanogenic reactors, respectively. Accordingly, the concentrations of VOA rose from 1,600 mg L−1(R1) and 1,650 mg L−1(R2) to 2,700 mg L−1(R1) and 2,500 mg L−1(R2), respectively.
The concentration of acetate increased in R1 from less than 1 mg L−1to 400 mg L−1and in R2 from 100 mg L−1 to 200 mg L−1. Moreover, in only one sample, 66 mg L−1 of propionic acid was detected in R2 1 day after the foam-ing occurred. The acetic acid concentration decreased in R1 5 days after foaming, while it was 2.5-fold increased in R2. Presumably, high feeding together with disturbed mix-ing led to an overloadmix-ing of the reactors. Some of the fed substrates such as fish and slaughterhouse waste as well as easily degradable substrates such as sugar beet molasses are well known to favor foaming [26,27]. Although the VOA/TIC is specific for each biogas plant, a sudden change in the VOA/TIC curve indicates a process disturb-ance. The accumulation of intermediates of the biogas pro-ducing process is known to be a consequence of failure of the microbial process that can be due to organic overload-ing [28]. One and two days before foamoverload-ing appeared, the early warning indicators EWI-VFA/Ca and EWI-PO4/Ca
increased by a factor of 2 (Figure 4). According to Kleyböcker et al. [3], the increase indicates a warning in terms of overacidification and overloading. Because the overloading is regarded as a reason for foaming, the EWI-VFA/Ca and EWI-PO4/Ca warned in terms of foam
Figure 3Substrate feeding ratios during and before the foaming period in month 1.The dashed lined rectangle indicates the day when both methanogenic reactors foamed (day‘0’). High substrate loading was detected 12 days before the foam appeared.
Table 2 Chemical characterization of the digestate of the methanogenic reactors R1 and R2 during foaming Two days before foaming One day after foaming Five days after foaming
R1 R2 R1 R2 R1 R2
VOA/TIC (−) 0.093 ± 0.006 0.098 ± 0.008 0.170 ± 0.023 0.155 ± 0.002 0.134 ± 0.036 0.0173 ±0.038
Total carbon (g L−1) 16.42 ± 0.86 15.55 ± 0.69 18.63 ± 1.23 13.67 ± 0.30 15.87 ± 0.58 15.80 ± 0.66
Total organic carbon (g L−1) 12.23 ± 0.76 11.44 ± 0.64 14.04 ± 0.52 9.793 ± 250 11.87 ± 0.51 11.75 ± 0.66
Total nitrogen (g L−1) 4.63 ± 0.24 4.57 ± 0.19 5.14 ± 0.14 4.60 ± 0.15 4.21 ± 0.05 4.28 ± 0.05
Ammonia nitrogen (g L−1) 2.61 ± 0.03 2.69 ± 0.02 2.83 ± 0.01 2.85 ± 0.01 2.94 2.98
Crude protein (g L−1) 12.67 11.73 14.42 10.97 7.95 8.16
Volatile organic acids:
Acetic acid (mg L−1) <1 126 407 207 215 551
Propionic acid (mg L−1) <1 <1 <1 66 <1 <1
Butyric acid (mg L−1) <1 <1 <1 <1 <1 <1
Water-eluable elements
Calcium (mg L−1) 43.4 56.5 54.3 86.0 36.3 61.8
Iron (mg L−1) 5.33 5.56 5.20 4.88 4.26 6.91
Magnesium (mg L−1) 4.57 5.81 6.30 12.5 11.4 9.63
Nickel (mg L−1) <4 <4 21.4 20.8 <4 <4
Phosphorus(mg L−1) 132 145 161 139 151 151
Potassium (mg L−1) 1,703 1,687 1,682 1,659 1,755 1,690
Sulfur (mg L−1) 46.6 43.2 56.9 43.1 47.3 49.6
the chemical composition of the foam in order to con-firm these assumptions.
Stagnant zones, sedimentations, and process imbalances due to stirring disturbances
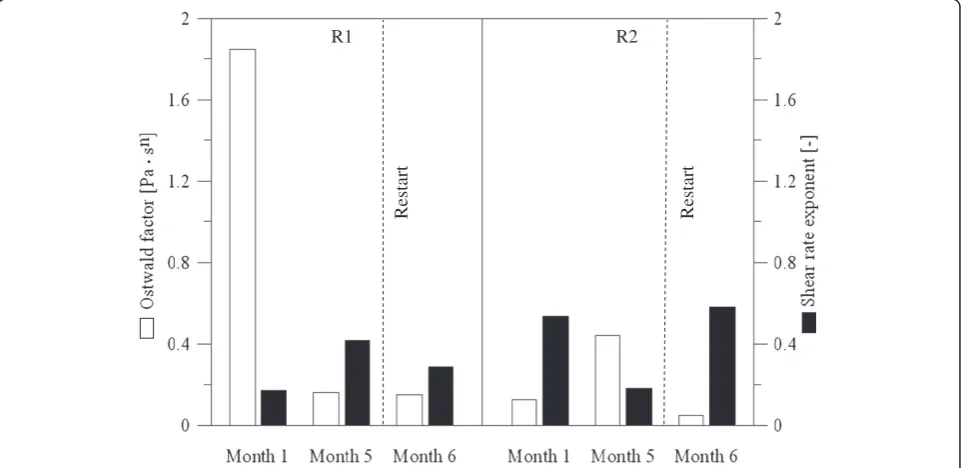
The analysis of the rheology showed that the values for the Ostwald factor and the shear rate fluctuated consider-ably within the monitoring period of 6 months (Figure 5). Surprisingly, no significant changes of the rheological characteristics were detected during the period without stirring. Based on this rheological result, an Ostwald
factor of 0.125 Pas0,53and a flow exponent of 0.53 were chosen for the CFD simulations. However, the power law approach was used for a shear rate range from 0.01 to 700 s−1only. Outside this range, a constant viscosity of either 0.01 Pas or rather 4.03 was assumed. The open jet of the substrate supply was not considered in the simulation. The thoroughly mixed volume generated by the open jet was estimated as 5% to 10% of the whole re-actor. With a feeding interval of 4 h, the mixing process by substrate dosage was negligible. Under undisturbed mixing conditions, the numerical simulations showed a
-4 0 4
Time [ d ]
0 2 4 6 8
EWI-PO
4
/Ca
[
-]
R1 - PO4/Ca R2 - PO4/Ca Foam event
Warning
-4 0 4
Time [ d ] 0
10 20 30 40
EWI-VFA/Ca
[
-]
R1 - VFA/Ca R2 - VFA/Ca Foam event
Warning
Figure 4Early warning indicators EWI-VFA/Ca and EWI-PO4/Ca.Before, during, and after the foam event in the reactors R1 and R2 in month 1.
Both indicators increase 1 to 2 days before foaming appeared. The increase is interpreted as a warning in terms of overloading. The overloading is regarded as reason for the formation of foam.
R1 R2
Restart Restart
good mixing for the studied biogas plant (Figure 6a). However, the partial stirring did not prevent the formation of floating layers in modeling the flow velocity since espe-cially in the upper reactor volume, stagnant zones ap-peared (Figure 6b). The stagnation zone with a velocity less than 0.05 m⋅s−1was limited to a volume of 52.6 m3 and represented 2.4% of the whole reactor. After break-down of the lower agitator, large stagnation zones were formed, especially in the upper reactor volume with a vol-ume of 487 m3that was about 21.8% of the whole reactor and the whole flow field collapsed (Figure 6b). The con-centrations of TS and VS in the monitoring period cover-ing the time from agitator breakdown to the restart of stirring after 5 months differed slightly between R1 and R2 with differences from 3 to 4 g L−1(Figure 7). The complete agitator downtime in R1 most likely led to sedimentations. The small volume of the introduced substrate was not suffi-cient to blend the reactor, and sedimentation occurred resulting in a 10% higher TS value and 13% higher VS value in R1 than in R2 in which no or less
sedimentation occurred due to the partial mixing (Figure 7). The substrates were concentrated at the bottom of R1 and directly withdrawn at the drain during sampling which led to an overestimation of the average TS and VS values. In contrast to the complete stirring downtime in R1, the sub-strates in the partially stirred R2 were better distributed leading to a more sufficient degradation of organic matter and lower TS and VS values. The average pH values of the digestates of the methanogenic reactors were slight alkaline with a value of about 8 (Figure 7). The gas production rate was decreased by 16% to 36% during the mixing distur-bances (Figure 8). Unfortunately, the biogas production of the two reactors was quantified together so that the com-parison of the biogas production rate was not feasible. Ana-lysis of the VFA concentrations in the methanogenic reactors showed increasing values after the agitators were broken (Figure 8). In the first 2 months, the VFA in both reactors nearly doubled from about 2,500 mg L−1 to 3,900 mg L−1 and the EWI-VFA/Ca increased two to three times. According to Kleyböcker et al. [3] the two-to threefold increase in the EWI-VFA/Ca indicates a process imbalance. However, the VFA concentrations in the hydrolytic reactors increased as well. In the first month, the VFA concentrations in both hydrolytic reac-tors reached a value of about 18,500 mg L−1and increased in the second month up to more than 23,000 mg L−1. Afterward, the concentrations decreased constantly to less than 14,000 mg L−1 in month 5. Correspondingly, from month 3 onward, the VFA concentrations in the two methanogenic reactors decreased and stabilized at a value of around 1,200 mg L−1, and the EWI-VFA/Ca also indi-cated process stabilization. The small intensity of stirring very likely favored the stabilization process. Stroot et al. [30], Gomez et al. [31], and Kaparaju et al. [32] also ob-served process stabilization due to gentle and/or minimal mixing (intermittent mixing) after high organic loading. It is probable that the increased concentrations of VFA in the methanogenic reactors were mainly caused by higher VFA concentrations in the fed substrate combined with an insufficient distribution of the substrate due to the stir-ring disturbances. Rojas et al. [33] revealed a decreasing performance of the biogas process in a reactor without stirring and related it to the insufficient contact between substrate and microorganisms. After restart of the agitator in month 5, the VFA concentrations in the two methanogenic reactors remained on a low level although the VFA concentrations in the hydrolytic stage increased again to more than 24,000 mg L−1. In month 5, a floating layer sample was collected from the surface of R2 during the exchange of the broken stirring paddle. The TS and VS values of the floating layer were increased four- to fivefold related to the digestate, and the VFA con-centration was twofold higher than in the digestate at a value of 2,200 mg L−1(data not shown). The EWI-VFA/Ca Figure 6CFD simulations of the flow regime in the biogas
was increased fivefold compared to the digestate, whereas the EWI-PO4/Ca was increased threefold and indicated a
process imbalance [3]. The accumulation of organic com-ponents in the layer and very limited exchange of interme-diates within the layer led to an accumulation of VFA and therefore the microbial degradation process was inhibited in the floating layer.
Process disruption-associated differences in the microbial community
Genetic fingerprinting of the bacterial community com-position in the two methanogenic reactors showed a di-verse band pattern after agitator breakdown (Figure 9 a,b). One month after the stirring was disturbed in both reac-tors, the microbial composition changed and differed
Restart
Month 1 Month 2 Month 3 Month 4 Month 5 Month 6
Figure 7Average values of pH, total solids, and volatile solids.Lower TS and VS values were detected in R2. The pH value increased and TS and VS values decreased slightly after restart of the agitator in month 5.
Month 1 Month 2 Month 3 Month 4 Month 5 Month 6
Restart
between the two reactors. A characteristic band pattern for each reactor was visible at the genetic fingerprinting whereby mostly bacteria of the phyla Firmicutes and Bac-teroidetes dominated the biocenosis (Table 3). Within the phylum Firmicutes, members of the order Clostridiales were dominant; whereas aProteiniphilum-assigned organ-ism from the phylum Bacteroidetes showed strong band intensities throughout the monitoring period, indicating a codominance in the reactors (band 19). In addition, one sequence was affiliated to a bacterium from the phylum Chloroflexi. Cardinali-Rezende et al. [34] as well as Leven et al. [35] investigated the microbial community of anaer-obic reactors treating household waste and also observed bacteria of the Firmicutes, Bacteroidetes, and Chloroflexi as the dominating phyla. Although the band patterns of both reactors were similar in month 1, differences in the intensities were detected for several bands. A higher abun-dance of an unclassified bacterium was indicated by the more intensive band 7 in R2 (Table 3). From month 2 on, the band patterns of R1 and R2 differed significantly. The intensity of band 5, which was affiliated to a bacterium from the orderBacteroidales, became stronger in R1 and
weaker in R2. The unclassified bacterium (band 7) was less dominant in R1 from month four to month five; whereas its dominance increased in R2. After the restart of the agitator in month 5, the band intensities from the Bacteroidales bacterium and the unclassified bacterium increased in both reactors again. The Pareto-Lorenz distri-bution pattern of R1 showed no differences in the func-tional organization of the microbial community during the agitator breakdown and afterward (Figure 10). Twenty percent of the cumulative number of bands was covered by 45% of the cumulative band intensities. By contrast, the Pareto-Lorenz distribution pattern of the partially stirred reactor R2 showed a difference in the functional organization of the microbial community in month 5 com-pared to months 1 and 6 as well as to the community in R1. In month 5, only 20% of the bands covered nearly 80% of the band intensities, indicating an uneven microbial community composition with few dominant species. In month 6, after restart of the agitator, the evenness of the microbial composition improved to a value of about 45% and was again on the same level as observed for R1 indicat-ing a similar microbial community composition. Both
a)
b)
c)
1 2 3 4 5 6
1 2 3 4 5 6
Month
Month
1
342
6
13 16
19
20
7
9
11
17 10
12
18 5
8
14 15
Restart
Restart
Figure 9DGGE fingerprinting over 6-month monitoring. (a)R1 and(b)R2. Numbered bands were further identified by sequencing (Table 3). The bacterial community composition changed after the agitator disruption in month 1 and adjusted after restart of the agitator in month 5.
reactors were affected by foaming in the first month after agitator disruption and additionally a floating layer forma-tion was found in R2 when the roof of the reactor was opened to repair the broken stirring paddle. Foaming and bulking caused by filamentous bacteria is well known in wastewater treatment plants (WWTP) and anaerobic di-gesters treating activated sludge [7]. AProteiniphilum-like bacterium from the phylum Bacteroidetes dominated the
microbial community in both reactors. Filamentous mem-bers of the Bacteroidetes phylum have been isolated from many environments [36-39]. However, little is known about the involvement of these microorganisms in bulking or foaming up until now [40], and the morphology of species from the genus Proteiniphilum was described as rod-shaped [41]. Additionally, a member from the phylum Chloroflexi was identified in the reactors. Some members
Table 3 Partial 16S rRNA gene sequences retrieved from DGGE fingerprint and sequencing excised bands
Band ID Genbank accession number Closest relative (accession number) BLAST similarity (%) Taxonomic classification
1 KF147561 UnculturedClostridialesbacterium (JQ741982.1) 91 UnclassifiedClostridiales
2 KF147562 Anaerobic bacterium (AY756145.2) 91 UnclassifiedClostridiales
3 KF147563 Uncultured bacterium (GQ132906.1) 83 Unclassified bacteria
4 KF147564 Uncultured bacterium (JX224468.1) 83 Unclassified bacteria
5 KF147565 Uncultured bacterium (KC605949.1) 82 UnclassifiedBacteroidales
6 KF147566 Uncultured Bacteroidetes bacterium (JX102011.1) 99 UnclassifiedFlavobacteriaceae
7 KF147567 Uncultured candidate division WWE1 (JX102010.1) 94 Unclassified bacteria
8 KF147568 Peptostreptococcaceaebacterium (AB377177.1) 94 Gallicola
9 KF147569 Clostridiumsp. (FJ424481.1) 98 Clostridium sensustricto
10 KF147570 Uncultured bacterium (AB273806.1) 87 UnclassifiedClostridiales
11 KF147571 Uncultured bacterium (AB850144.1) 92 UnclassifiedClostridiales
12 KF147572 Uncultured compost bacterium (FN667344.1) 90 UnclassifiedClostridiales
13 KF147573 Uncultured Firmicutes bacterium (FN429799.1) 90 UnclassifiedClostridiales
14 KF147574 Uncultured bacterium (HQ156179.1) 91 UnclassifiedClostridiales
15 KF147575 Uncultured bacterium (FN993992.1) 89 UnclassifiedClostridiales
16 KF147576 UnculturedSyntrophomonassp. (KF511597.1) 95 Syntrophomonas
17 KF147577 Uncultured Clostridia bacterium (JN998166.1) 91 Syntrophomonas
18 KF147580 Uncultured Firmicutes bacterium (HM041937.1) 92 UnclassifiedClostridiales
19 KF147578 Uncultured bacterium (GQ134523.1) 88 Proteiniphilum
20 KF147579 Uncultured Chloroflexi bacterium (CU923171.1) 99 Levilinea
Taxonomic assignment was done by RDP Classifier with a confidence threshold of 50%. Closest relatives are shown including Genbank accession numbers.
of this phylum have a filamentous morphology occa-sionally triggering the formation of foam and floating layers in WWTP [42,43]. Accordingly, microscopic ana-lyses (Figure 11) revealed filaments in the floating layer. It is arguable if the filamentous morphology of the mi-croorganisms was an adaption to the deteriorated dis-tribution of nutrients due to the disturbed mixing in both reactors because the filamentous structure allows an improved nutrient absorption or whether the micro-organisms were obligatory filamentous. However, it is not clear if the filamentous bacteria promoted the float-ing layer formation in this case. Most likely, they were just accompanying bacteria and the floating layer for-mation was mainly caused by fibrous substrates and es-pecially the stirring failure. Furthermore, it has to be discussed if the alternating substrate mix might have had an influence on the microbial community compos-ition in the reactors. Since the exact amount of intro-duced substrates for every month is not known by the authors, a correlation between substrate loading and mi-crobial community change was not possible. However, both methanogenic reactors were fed by the same sub-strate mix with similar VFA as well as TS and VS concen-trations. Moreover, the microbial community structure only changed after the stirring differed in the reactors and adapted again after the stirring was restarted. Therefore, it is reasonable to regard the disturbance of stirring as the main trigger of the microbial community composition change. The band pattern of the floating layer showed no differences to the associated digestate (Figure 9c). Apparently, the microorganisms in the floating layer were not able to degrade efficiently the accumulated or-ganic acids, although Syntrophomonas-like organisms
which are known to withstand high VFA concentrations were detected in the floating layer [44]. Probably, the VFA concentrations were too high for a sufficient deg-radation leading to an inhibition of the microorgan-isms. Moreover, the accumulated fibrous substrates in the floating layer were less degradable, as also described by Heiske et al. [45].
Conclusions
This study shows that the formation of floating layers and foam in full-scale biogas plants can be reduced by proper stirring. A precise knowledge of the rheology of the substrate mix and an appropriate agitation technol-ogy is essential for efficient mixing as well as optimized energy consumption. Furthermore, the stirring has a crucial influence on the microbial community structure. As most of the microorganisms are still uncultured and uncharacterized, further investigation on the microbial community composition is fundamental to enhance the efficiency of anaerobic digesters. Additionally, controlled substrate feeding as well as monitoring of EWI might prevent foaming due to overloading.
Abbreviations
CFD:Computational fluid dynamics; DGGE: Denaturing gradient gel electrophoresis; DNA: Desoxyribonucleic acid; EWI: Early warning indicator; GPR: Gas production rate; PCR: Polymerase chain reaction; TS: Total solids; VFA: Volatile fatty acids; VOA/TIC: Volatile organic acids/total inorganic carbonate buffer; VS: Volatile solid.
Competing interests
The authors declare that they have no competing interests.
Authors’contributions
chemical analyses. MB conducted the rheological analyses and participated in the design of the study. LM and KG participated in the design of the study and performed detailed chemical analyses of the foaming event. MK and HW conceived of the study, participated in its design and coordination, and helped to interpret the results and to draft the manuscript. All authors read and approved the final manuscript.
Acknowledgements
The Authors wish to thank the German‘Federal Ministry for the Environment, Nature and Nuclear Safety’for funding the project‘Optgas’(FKZ 03 KB018) and the biogas plant operator for the cooperation. Special thanks go to Prof. Dr. Andreas Zehnsdorf and Dr. Roland Müller for helpful discussion and critical reading of the manuscript.
Author details
1GFZ German Research Centre, Telegrafenberg, 14473 Potsdam, Microbial
GeoEngineering, Germany.2TechnischeUniversität Berlin, Fachgebiet Verfahrenstechnik, Ackerstraße
71-76, Berlin 13355, Germany.3Environmental and Biotechnology Centre, UFZ Helmholtz Centre for Environmental Research, Permoserstrasse 15, Leipzig 04318, Germany.
Received: 14 February 2013 Accepted: 4 October 2013 Published: 24 October 2013
References
1. Balussou D, Kleyböcker A, McKenna R, Möst D, Fichtner W (2012) An economic analysis of three operational co-digestion biogas plants in Germany. Waste Biomass Valor 3(1):23–41
2. Kleyböcker A, Liebrich M, Kasina M, Kraume M, Wittmaier M, Würdemann H (2012) Comparison of different procedures to stabilize biogas formation after process failure in a thermophilic waste digestion system: influence of aggregate formation on process stability. Waste Manag 32(6):1122–30 3. Kleyböcker A, Liebrich M, Verstraete W, Kraume M, Würdemann H (2012)
Early warning indicators for process failure due to organic overloading by rapeseed oil in one-stage continuously stirred tank reactor, sewage sludge and waste digesters. Bioresour Technol 123:534–41
4. Moeller L, Goersch K, Neuhaus J, Zehnsdorf A, Mueller RA (2012)
Comparative review of foam formation in biogas plants and ruminant bloat. Energy Sustainability Soc 2:12
5. Bischofsberger W, Dichtl N, Rosenwinkel K, Seyfried C, Böhnke B (2005) Anaerobtechnik. Springer-Verlag, Berlin Heidelberg
6. Deublein D, Steinhauser A (2008) Biogas from waste and renewable resources. Wiley-VCH Verlag GmbH & Co. Kga A, Weinheim 7. Martins A, Pagilla K, Heijnen J, van Loosdrencht M (2004) Filamentous
bulking sludge-a critical review. Water Res 38(4):793–817
8. Westlund AB, Hagland E, Rothman M (1998) Foaming in anaerobic digesters caused byMicrothrix parvicella. Water Sci Technol 37:51–55
9. Frigon D, Guthrie RM, Bachman GT, Royer J, Bailey B, Raskin L (2006) Long-term analysis of a full-scale activated sludge wastewater treatment system exhibiting seasonal biological foaming. Water Res 40(5):990–1008 10. Ganidi N, Tyrrel S, Cartmell E (2009) Anaerobic digestion foaming causes-a
review. Bioresour Technol 100(23):5546–54
11. Barber W (2005) Anaerobic digester foaming: causes and solutions. Water 21 7 1:45–49
12. Pagilla KR, Craney KC, Kido WH (1997) Causes and effects of foaming in anaerobic sludge digesters. Water Sci Technol 36(6–7):463–470 13. DIN 38409–1 (1987) German standard methods for the examination of
water, waste water and sludge; parameters characterizing effects and substances (group H); determination of total dry residue, filtrate dry residue and residue on ignition (H 1). Deutsches Institut Für Normung EV DIN. 38409–1:1987–01
14. Dumas JB (1831) Procedes de l’analyseorganique. Ann ChimPhys 247:198–213
15. Eder B, Schulz H (2007) Anlagentechnik. In: Eder B, Schulz H (ed) Biogas praxis, 4th edition. Ökobuch Verlag, pp 70–118
16. Burchard CH, Groche D, Zerres HP (2001) ATV Handbucheinfacher Messungen und Untersuchungen auf Klärwerken. Hirthammer Verlag München
17. Metzner AB, Otto RE (1957) Agitation of non-Newtonian fluids. AIChE J 3(1):3–10
18. Wilkinson WL (1960) Non-Newtonian fluids, fluid mechanics, mixing and heat transfers. Pergamon Press, London
19. Muyzer G, de Waal EC, Uitterlinden AG (1993) Profiling of complex microbial populations by denaturing gradient gel electrophoresis analysis of polymerase chain reaction-amplified genes coding for 16S rRNA. Appl Environ Microbiol 59:695–700
20. Amann RI, Stromley J, Devereux R, Key R, Stahl DA (1992) Molecular and microscopic identification of sulfate-reducing bacteria in multispecies biofilms. Appl Environ Microbiol 58:614–623
21. Hall TA (1999) BioEdit: A user-friendly biological sequence alignment editor and analysis program for Windows 95/98/NT. Nucleic Acids Symp Ser 41:95–98
22. Altschul SF, Gish W, Miller W, Myers EW, Lipman DJJ (1990) Basic local alignment search tool. Molec Biol 215:403–410
23. Wang Q, Garrity GM, Tiedje JM, Cole JR (2007) Naive Bayesian classifier for rapid assignment of rRNA sequences into the new bacterial taxonomy. Appl Environ Microbiol 73(16):5261–7
24. Lorenz MO (1905) Methods of measuring concentration of wealth. J Am Stat Assoc 9:209–219
25. Wittebolle L, Vervaeren H, Verstraete W, Boon N (2008) Quantifying community dynamics of nitrifiers in functionally stable reactors. Appl Environ Microbiol 74(1):286–293
26. Switzenbaum MS, Giraldo-Gomez E, Hickey RF (1990) Monitoring of the anaerobic methane fermentation process. Enzyme Microb Technol 12:22–730
27. Moeller L, Goersch K, Mueller RA, Zehnsdorf A (2012) Formation and suppression of foam in biogas plants–practical experiences. Agric Eng (Landtechnik) 67(2):110–113
28. Scholwin F, Liebetrau J, Edelmann W, Kaltschmitt M, Hartmann H, Hofbauer H (2009) Biogaserzeugung und -nutzung. In: Energieaus Biomasse. Springer-Verlag, Berlin Heidelberg, pp 851–990
29. Miltimore JE, McArthur JM, Mason JL, Ashby DL (1970) Bloat investigations. The threshold fraction 1 (18S) protein concentration for bloat and relationships between bloat and lipid, tannin, Ca, Mg, Ni and Zn concentrations in alfalfa. Can J Anim Sci 50:61–68
30. Stroot P, McMahon K, Mackie R, Raskin L (2001) Anaerobic codigestion of municipal solid waste and biosolids under various mixing conditions–I. Digester performance. Water Res 35(7):1804–1816
31. Gomez X, Cuetos M, Cara J, Moran A, Garcia A (2006) Anaerobic co-digestion of primary sludge and fruit and vegetable fraction of the municipal solid wastes: conditions for mixing and evaluation of the organic loading rate. Renew Energy 31:2017–2024
32. Kaparaju P, Buendia I, Ellegaard L, Andelidaki I (2008) Effects of mixing on methane production during thermophilic anaerobic digestion of manure: lab-scale and pilot-scale studies. Bioresour Technol 99(11):4919–4928 33. Rojas C, Fang S, Uhlenhut F, Borchert A, Stein I, Schlaak M (2010) Stirring
and biomass starter influences the anaerobic digestion of different substrates for biogas production. Eng Life Sci 10(4):339–347
34. Cardinali-Rezende J, Debarry RD, Colturato LFDB, Carneiro EV, Chartone-Souza E, Nascimento AMA (2009) Molecular identification and dynamics of microbial communities in reactor treating organic household waste. Appl Microbiol Biotechnol 84:777–789
35. Levén L, Eriksson AR, Schnürer A (2007) Effect of process temperature on bacterial and archaeal communities in two methanogenic bioreactors treating organic household waste. FEMS Microbiol Ecol 59(3):683–93 36. Williams TM, Unz RF (1985) Isolation and characterization of filamentous
bacteria present in bulking activated sludge. Appl Microbiol Biotechnol 22:273–282
37. Kaempfer P, Weltin D, Hoffmeister D, Dott W (1995) Growth requirements of filamentous bacteria isolated from bulking and scumming sludge. Water Res 29:1585–1588
38. Eilers H, Pernthaler J, Peplies J, Glockner FO, Gerdts G, Amann R (2001) Isolation of novel pelagic bacteria from the German bight and their seasonal contributions to surface picoplankton. Appl Environ Microbiol 67:5134–5142
39. Lydell C, Dowell L, Sikaroodi M, Gillevet P, Emerson D (2004) A population survey of members of the phylum Bacteroidetes isolated from salt marsh sediments along the East Coast of the United States. Microb Ecol 48:263–273
abundance and ecophysiology of filamentous bacteria belonging to the Bacteroidetes present in activated sludge plants. Microbiol 154(3):886–94 41. Chen S, Dong X (2005)Proteiniphilum acetatigenesgen. nov., sp. nov., from
a UASB reactor treating brewery wastewater. Int J Syst Evol Microbiol 55 (6):2257–61
42. Kragelund C, Levantesi C, Borger A, Thelen K, Eikelboom D, Tandoi V, Kong Y, van der Waarde J, Krooneman J, Rossetti S, Thomsen TR, Nielsen PH (2006) Identity, abundance and ecophysiology of filamentous Chloroflexi species present in activated sludge treatment plants. FEMS Microbiol Ecol 59(3):671–82
43. Nielsen PH, Kragelund C, Seviour RJ, Nielsen JL (2009) Identity and ecophysiology of filamentous bacteria in activated sludge. FEMS Microbiol Rev 33(6):969–98
44. Sousa DZ, Pereira MA, Smidt H, Stams AJM, Alves MM (2007) Molecular assessment of complex microbial communities degrading long chain fatty acids in methanogenic bioreactors. FEMS Microbiol Ecol 60(2):252–65 45. Heiske S, Schultz-Jensen N, Leipold F, Schmidt JE (2013) Improving
anaerobic digestion of wheat straw by plasma-assisted pretreatment. J Atomic Mol Phys:Article ID 791353
doi:10.1186/2192-0567-3-20
Cite this article as:Lienenet al.:Floating layer formation, foaming, and microbial community structure change in full-scale biogas plant due to disruption of mixing and substrate overloading.Energy, Sustainability and Society20133:20.
Submit your manuscript to a
journal and benefi t from:
7Convenient online submission
7Rigorous peer review
7Immediate publication on acceptance
7Open access: articles freely available online
7High visibility within the fi eld
7Retaining the copyright to your article

![Table 1 The calculation of the apparent viscosity ηthe shear rateS and _γ [17,18]](https://thumb-us.123doks.com/thumbv2/123dok_us/336299.1526104/4.595.56.291.110.415/table-calculation-apparent-viscosity-hthe-shear-rates-g.webp)