R E S E A R C H A R T I C L E
Open Access
Do we need more than one Child Perceptions
Questionnaire for children and adolescents?
Lyndie A Foster Page
1*, Dorothy Boyd
2and W Murray Thomson
3Abstract
Background:In dentistry, measures of oral health-related quality of life (OHRQoL) provide essential information for assessing treatment needs, making clinical decisions and evaluating interventions, services and programmes. The two most common measures used to examine child OHRQoL today are the Child Perceptions Questionnaire at two ages, 8–10 and 11–14 (CPQ8-10,CPQ11-14). The reliability and validity of these two versions have been demonstrated together with that (more recently) of the short-form 16-item impact version of the CPQ11-14. This study set out to examine the reliability and validity of the Child Oral Health Quality of Life Questionnaires (COHQOL) instruments the CPQ8-10and impact short-form CPQ11-14in 5-to-8-year-old New Zealand children, and to determine whether a single measure for children aged 5–14 is feasible.
Method:A cross-sectional survey was conducted of 5-to-8-year-old children attending for dental treatment in community clinics in 2011. Children were examined for dental caries, with OHRQoL measured using the CPQ8-10 and short-form CPQ11-14. Construct validity was evaluated by comparing mean scale scores across ordinal categories of caries experience; correlational construct validity was assessed by comparing mean CPQ scores across children’s global ratings of oral health and well-being.
Results:The 183 children (49.7% female) aged 5 to 8 years who took part in the study represent a 98.4% participation rate. The overall mean dmft was 6.0 (SD, 2.0 range 1 to 13). Both questionnaire versions detected differences in the impact of dental caries on quality of life, with the greatest scores in the expected direction. Both versions showed higher scores among those with poorer oral health. There was a very strong and positive correlation between CPQ11-14scores and CPQ8-10scores (Pearsons’s r = 0.98; P < 0.01).
Conclusion:The performance of both versions of the COHQOL measures (CPQ8-10and short-form CPQ11-14) appears to be acceptable in this younger age group, and this work represents the first stage in validating this questionnaire in a younger age group. It also further confirms that younger children are capable of providing their own perceptions of oral health impacts. The acceptability of the short-from CPQ11-14in this younger age group lends support to its use in children between ages 5 and 14.
Keywords:Children, Indexes, Health status indicators, Validity
Background
Dental caries is the most common chronic childhood condition afflicting New Zealanders. It is known to affect children’s development, school performance, and behaviour, as well as affecting their families and the wider community [1,2]. This problem is not unique to New Zealand but is a major health issue affecting children in many countries [3]. Increasingly, investigations of oral diseases and disorders
are using clinical disease and psychosocial measures concurrently, recognising the importance of using health-related quality of life evaluations in clinical studies. This has led to a growth in the number and use of condition-specific instruments [4]. In dentistry, measures of oral health-related quality of life (OHRQoL) provide es-sential information for assessing treatment needs, making clinical decisions and evaluating interventions, services and programmes. Measures currently available for children include the Child Oral Health Quality of Life (COHQOL) questionnaires [5-8], the Child Oral Health Impact * Correspondence:lyndie.fosterpage@otago.ac.nz
1
Department of Oral Rehabilitation, School of Dentistry, University of Otago, PO Box 647, Dunedin, New Zealand
Full list of author information is available at the end of the article
Profile (COHIP) [9], the Child-Oral Impacts on Daily Performances (Child-OIDP [10], the Early Childhood Oral Health Impact Scale (ECOHIS) [11], and the Scale of Oral Health Outcomes (SOHO-5) [12].
To date, the COHQOL has been most frequently used; it is a set of scales measuring the negative effects of oral and orofacial disorders on the well-being of 6-14-year-olds and their families. The scales comprise the Child Perceptions Questionnaire at two ages, 8–10 and 11–14 (CPQ8-10, CPQ11-14), the Parental-Caregiver Perceptions
Questionnaire (P-CPQ) and the Family Impact Scale (FIS). The Child Perceptions Questionnaire at age 6–8 was never developed or validated however, the reliability and validity of the two CPQ versions has been demonstrated [8,13], together with that (more recently) of the short-form 16-item impact version of the CPQ11-14[14]. However, the
use of two separate measures limits the ability of the CPQ to be used in prospective studies following children through different life stages. By contrast, the COHIP was developed as an instrument for use with children aged from 8 to 18 years. Having a single measure which can be used longitudinally in children over a ten-year age span is a considerable advantage [15].
Measures for children younger than 8 years old remain problematic. Until recently, their OHRQoL was measured using parents as informants, because of concerns that children’s reports would not meet accepted psychometric standards of validity and reliability, largely because of limitations in the respondents’cognitive capacities and communication skills. Accordingly, the P-CPQ was developed for use with younger children and provides a measure of a child’s OHRQoL. Where both parental and child reports are used, the P-CPQ can be regarded as complementing the latter, thus providing a compre-hensive profile of a child’s health and well-being [7]. Until very recently, there has been no self-report measure for children under age 8 because of the methodological and conceptual challenges of developing OHRQoL mea-sures for young children [12]. Around the age of 6 marks the beginning of abstract thinking and self-concept for children [16]. Children start to compare their physical features and personality traits, either with those of other children or against a norm. Their ability to make evaluative judgments of their appearance, the quality of friendships and other people’s thoughts, emotions and behaviours develops through middle childhood [16]. Gradually, by the age of 8, they develop the con-cepts of time and frequency of event [17]. All of these challenges have led to a lack of measures for children under the age of 8, although the recent development of the Scale of Oral Health Outocmes (SOHO-5) has resulted in a self-report OHRQoL measure for 5-year-old children. The initial assessment showed acceptable reliability and validity in 332 UK children [12].
With the encouraging finding that children as young as five can use a self-report OHRQoL measure, the aim of this study was to determine whether the COHQOL
measures (the CPQ8-10 and short-form CPQ11-14) are
reliable and valid in younger New Zealand children, and whether it is feasible to use a single CPQ measure for children aged 5 to 14.
Method
A survey was conducted of approximately 200 5- to 8-year-old children attending for dental treatment in Hawkes Bay community clinics in 2011. The number of children chosen for this study was to assist in informing sample size determination for a larger multicentre trial. Ethical approval was obtained from the Central Regional Ethics Committee. Consent was obtained from both parent and child before proceeding.
Sociodemographic characteristics
Information was gathered on each child’s sex, age and ethnicity. The children were categorized into two age
groups, with “older” being the 7- and 8-year-olds, and
“younger” being the 5- and 6-year-olds. An area-based deprivation measure [18] was used to allocate each partici-pant to a deprivation decile score, based on the residential address. Areas with scores 1 to 3 were classified as “low deprivation”; those with scores 8 to 10 were classified as “high deprivation”.
Clinical measures
Qualified dental therapists undertook routine clinical examinations, having been trained in the study protocol at the community clinics. Baseline charting recorded for each child included decayed, missing and filled deciduous teeth. Posterior bitewing radiographs were also taken, and these were used to amend the children’s dmft scores appropriately. Intra-examiner reliability was undertaken on twenty films by one experienced clinician who read all the radiographs, with ICC = 0.82.
OHRQoL measures
Oral health-related quality of life was measured using
both the 16-item impact short-form CPQ11-14-ISF:16
questionnaire and the 25-item CPQ8-10 (Table 1). The
overlap in item content between the two questionnaires enabled both versions to be incorporated into a 26-item questionnaire. The reference period used for both was the previous four weeks, as originally used in the CPQ8-10
questionnaire [8]. Response options and scores were: ‘Never’ (scoring 0); ‘once or twice’ (1); ‘Sometimes’ (2); ‘Often’(3); and‘Every day or almost every day’(4). An over-all CPQ11-14and CPQ8-10score was computed by summing
not examined for either measure. Childrens’perceptions of their oral health were assessed using two global measures. First, they were asked to rate the health of their teeth and mouth (response options:‘Very good’,‘Good’,‘OK’or‘Poor’). Second, they were asked how much their teeth or mouth bother them (response options: ‘Not at all’, ‘A little bit’, ‘Some’or ‘A lot’). The research assistant administered the questionnaire and read each question to the child.
Data were analysed with SPSS (version 18.0). The computation of descriptive statistics was followed by bivariate analyses, which used Chi-square tests for comparing proportions; Mann–Whitney or Kruskal-Wallis tests were used (as appropriate) for comparing scores for continuous variables (where these were not normally distributed). Where continuous variables were normally distributed, ANOVA was used to compare means. The alpha value was set at 0.05. Spearman’s rank correlation coefficients were computed to inform the assessment of associations among sociodemographic, clinical and psychosocial characteristics. Pearson’s r was used to examine the correlation between scores on the two scales (CPQ11-14and CPQ8-10).
Results
The 183 5-to-8-year-olds (49.7% female) who took part in the study represent a 98.4% participation rate. Just
over half (50.4%) were Māori, and almost half (44.8%)
resided in highly deprived areas. The overall mean dmft
was 6.0 (SD, 2.0; range 1 to 13). Scores ranged from 0 to 43 for the CPQ8-10and 0 to 37 for the CPQ11-14(Table 2), and
these and the domain scores were positively skewed. Both versions detected substantial variability in chil-dren’s perception of their OHRQoL, as shown by their scores. Floor effects were substantial for both versions (as evidenced by approximately 14% responding with no impact), while ceiling effects were not apparent. Substantial internal consistency reliability was apparent for each of the two questionnaires (and domains), with that of the CPQ8-10
version being superior to that of the CPQ11-14version.
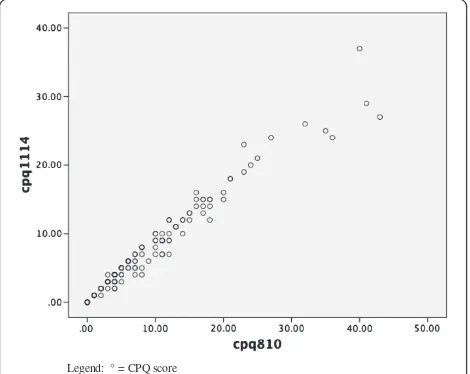
There was a very strong and positive correlation between scores on the CPQ11-14and the CPQ8-10, with a Pearson's r
of 0.981 (P < 0.01) for all children, and Pearsons’s r values of 0.983 (P < 0.01) and 0.981 (P < 0.01) for the younger and older categories of children respectively. A scatterplot of scale scores for all children depicts the strength of that association (Figure 1).
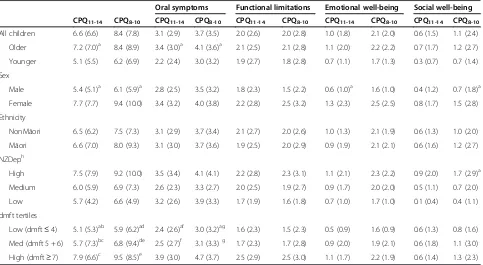
Both questionnaire versions detected differences in the impact of dental caries on quality of life, with the greatest scores in the expected direction: children who presented with the highest caries burden had the highest scores (Table 3). The differences for both questionnaires were statistically significant (as were those representing the oral symptoms domain). There was a gender difference in the overall CPQ11-14 and CPQ8-10scores, with females
scoring higher than males. There was a distinct deprivation gradient with both CPQ versions, with children from
Table 1 Comparison of item content of the CPQ11-14-ISF:16 and the CPQ8-10
In the past 4 weeks, how often have you (had/been) because of your teeth/mouth
Domain CPQ11-14ISF:16-specific items Items common to ISF:16 and CPQ8-10 CPQ8-10-specific items
OSa Pain in teeth/mouth
Bad breath
Mouth sores Difficulty eating, drinking hot/cold foods
Food caught between teeth
FLb Difficulty eating/drinking hot/cold foods Difficulty chewing firm foods Trouble sleeping
Difficulty saying words Trouble eating foods you like
Taken longer to eat a meal
EWc Upset
Felt irritated/frustrated Worried not as good looking
Felt shy
Concerned what people think about teeth/mouth
SWd Teased/called names Not wanted to speak/read loud in class
Argued with children/family Avoided smiling/laughing Missed school
Asked questions Hard time doing your homework
Hard time paying attention in school
Stayed away from activities
Avoided being with other children
Avoided talking with other children
a
Oral symptomsb
Functional limitationsc
Emotional well-beingd
families living in highly deprived areas having higher scores than those in less deprived areas.
Both versions of the CPQ showed higher scores among those with poorer oral health (Table 4), with the differences
in CPQ8-10 scores being of greater magnitude. Both
versions of the questionnaire demonstrated positive, statistically significant, and very similar correlations with self-rated oral health and overall impact on quality of life.
Discussion
This is the first study (to our knowledge) to examine the COHQOL CPQ versions in a younger age group. At the time of this study, no validated self-report OHRQoL measure was available for children of this age. Both versions
of the COHQOL measures (CPQ8-10 and short-form
CPQ11-14) appear to be acceptable in this younger age
group, and the data further confirm that younger children are capable of providing their own perceptions of oral health impacts. The acceptability of the short-form
CPQ11-14 in this younger age group lends support to
utilising this version from age 5 to 14.
A weakness of this study is that the children comprise a convenience sample of participants in a clinical study, whereby children who required treatment were invited to take part; hence, the findings may not be generalis-able. However, a strength is the high participation rate, with 183 of the 186 children invited having consent and assenting to take part. Among the study’s other strengths were that the questionnaire was administered to children by a trained research assistant, and the clinical data collection included radiographic diagnosis of caries giving a more accurate estimate of clinical caries status due to the general underestimation of carious lesions where radiographic diagnosis is not used [19].
The psychometric properties of both versions of the CPQ were found to be acceptable in this younger age group. The single item in the CPQ11-14that is not present
in the CPQ8-10 version (“Argued with children/family”) is
found in the social well-being domain. Despite the former
having only 16 items, Cronbach’s alpha was 0.83, well
above the arbitrary threshold of 0.7 [20] and only slightly
less than the 0.87 observed for the 25-item CPQ8-10.
Instruments with greater numbers of items tend to have
higher alpha values [21], but the 16-item CPQ11-14
revealed good internal consistency overall; its social well-being domain had a Cronbach alpha value of 0.71 with only 4 items, while the 10 items in the CPQ8-10 version
had an alpha of 0.77. Floor effects did appear to be a prob-lem with both versions, with the scores for the emotional and social well-being domains being very high, and the
Legend: ° = CPQ score
Figure 1Scatterplot of scale scores of the CPQ11-14and CPQ8-10.
Legend: ° = CPQ score.
Table 2 Descriptive statistics and internal consistency reliability data for the CPQ11-14, CPQ8-10and their subscales
Number of items
Mean score (SD)
Cronbach’s alpha (α)
Range of observed scores
Percentage with score 0
Percentage with maximum score
CPQ11-14 16 6.6 (6.6) 0.83 0 to 37 14.3 0.0
Subscales
Oral symptoms 4 3.1 (2.9) 0.72 0 to 14 18.2 0.0
Functional limitations 4 2.0 (2.6) 0.65 0 to 12 39.8 0.0
Emotional well-being 4 1.0 (1.8) 0.69 0 to 10 61.1 0.0
Social well-being 4 0.6 (1.5) 0.71 0 to 11 72.1 0.0
CPQ8-10 25 7.8 (8.4) 0.87 0 to 43 13.7 0.0
Subscales
Oral symptoms 5 3.7 (3.5) 0.76 0 to 17 16.9 0.0
Functional limitations 5 2.0 (2.8) 0.71 0 to 14 43.2 0.0
Emotional well-being 5 1.1 (2.0) 0.70 0 to 12 57.9 0.0
CPQ11-14having the greatest. Whether this is problematic
is unclear at this stage; further investigation in other pop-ulations and settings is warranted. To further support the performance of these versions, the observed gradients in mean scores for both versions across the categories of the global items show that the concurrent validity was excellent. This means that, even at this young age, children
are aware of their poor oral health status and the impact on their quality of life.
Where construct validity is concerned, the associations with oral health were strong and significant and in the hypothesised direction (with poorer oral health in the children with the greatest caries experience). Children with more caries had oral symptoms domain scores
Table 3 Mean CPQ11-14, CPQ8-10and domains by sociodemographic characteristics and caries experience
(brackets contain standard deviation unless otherwise indicated)
Oral symptoms Functional limitations Emotional well-being Social well-being
CPQ11-14 CPQ8-10 CPQ11-14 CPQ8-10 CPQ11-14 CPQ8-10 CPQ11-14 CPQ8-10 CPQ11-14 CPQ8-10
All children 6.6 (6.6) 8.4 (7.8) 3.1 (2.9) 3.7 (3.5) 2.0 (2.6) 2.0 (2.8) 1.0 (1.8) 2.1 (2.0) 0.6 (1.5) 1.1 (2.4)
Older 7.2 (7.0)a 8.4 (8.9) 3.4 (3.0)a 4.1 (3.6)a 2.1 (2.5) 2.1 (2.8) 1.1 (2.0) 2.2 (2.2) 0.7 (1.7) 1.2 (2.7)
Younger 5.1 (5.5) 6.2 (6.9) 2.2 (2.4) 3.0 (3.2) 1.9 (2.7) 1.8 (2.8) 0.7 (1.1) 1.7 (1.3) 0.3 (0.7) 0.7 (1.4)
Sex
Male 5.4 (5.1)a 6.1 (5.9)a 2.8 (2.5) 3.5 (3.2) 1.8 (2.3) 1.5 (2.2) 0.6 (1.0)a 1.6 (1.0) 0.4 (1.2) 0.7 (1.8)a
Female 7.7 (7.7) 9.4 (10.0) 3.4 (3.2) 4.0 (3.8) 2.2 (2.8) 2.5 (3.2) 1.3 (2.3) 2.5 (2.5) 0.8 (1.7) 1.5 (2.8)
Ethnicity
NonMāori 6.5 (6.2) 7.5 (7.3) 3.1 (2.9) 3.7 (3.4) 2.1 (2.7) 2.0 (2.6) 1.0 (1.3) 2.1 (1.9) 0.6 (1.3) 1.0 (2.0)
Māori 6.6 (7.0) 8.0 (9.3) 3.1 (3.0) 3.7 (3.6) 1.9 (2.5) 2.0 (2.9) 0.9 (1.9) 2.1 (2.1) 0.6 (1.6) 1.2 (2.7)
NZDeph
High 7.5 (7.9) 9.2 (10.0) 3.5 (3.4) 4.1 (4.1) 2.2 (2.8) 2.3 (3.1) 1.1 (2.1) 2.3 (2.2) 0.9 (2.0) 1.7 (2.9)a
Medium 6.0 (5.9) 6.9 (7.3) 2.6 (2.3) 3.3 (2.7) 2.0 (2.5) 1.9 (2.7) 0.9 (1.7) 2.0 (2.0) 0.5 (1.1) 0.7 (2.0)
Low 5.7 (4.2) 6.6 (4.9) 3.2 (2.6) 3.9 (3.3) 1.7 (1.9) 1.6 (1.8) 0.7 (1.0) 1.7 (1.0) 0.1 (0.4) 0.4 (1.1)
dmft tertiles
Low (dmft≤4) 5.1 (5.3)ab 5.9 (6.2)ad 2.4 (2.6)af 3.0 (3.2)ag 1.6 (2.3) 1.5 (2.3) 0.5 (0.9) 1.6 (0.9) 0.6 (1.3) 0.8 (1.6)
Med (dmft 5 + 6) 5.7 (7.3)bc 6.8 (9.4)de 2.5 (2.7)f 3.1 (3.3)g 1.7 (2.3) 1.7 (2.8) 0.9 (2.0) 1.9 (2.1) 0.6 (1.8) 1.1 (3.0)
High (dmft≥7) 7.9 (6.6)c 9.5 (8.5)e 3.9 (3.0) 4.7 (3.7) 2.5 (2.9) 2.5 (3.0) 1.1 (1.7) 2.2 (1.9) 0.6 (1.4) 1.3 (2.3)
a
P < 0.05 Kruskal-Wallis/Mann–Whitney. bcdefg
Superscript letters with the same symbols indicate groups which do not differ significantly by post hoc criteria. h
data missing for 15 children.
Table 4 Mean CPQ11-14and CPQ8-10scores by global oral health questions (SD)
CPQ11-14 CPQ8-10
All Older Younger All Older Younger
Self-rated oral health
Very good 5.7 (6.5)a 6.8 (7.1) 3.3 (4.2)a 6.6 (8.2)a 7.8 (9.1) 4.1 (5.2)a
Good 5.7 (5.5) 6.1 (5.5) 4.7 (5.6) 6.8 (7.0) 7.2 (6.8) 5.6 (7.5)
OK/Poor 8.6 (7.9) 9.0 (8.5) 7.5 (6.0) 10.2 (9.8) 10.7 (10.9) 9.1 (6.8)
Spearman's rho 0.20c 0.13 0.36c 0.22c 0.15 0.36c
Impact of oral health on quality of life
Not at all 4.5 (4.9)b 5.0 (5.4)b 3.3 (3.5)b 5.1 (5.9)b 5.5 (6.3)b 4.1 (4.7)b
A little bit 7.8 (7.0) 9.0 (7.4) 3.8 (2.9) 9.2 (8.5) 10.5 (9.1) 4.7 (3.3)
Some/A lot 10.7 (8.1) 10.1 (8.5) 11.9 (7.5) 13.5 (11.3) 13.2 (12.3) 14.2 (9.8)
Spearmans rho 0.34c 0.34c 0.45c 0.40c 0.37c 0.46c
a
p-value < 0.05 Kruskal-Wallis. b
p-value < 0.01 Kruskal-Wallis. c
which were significantly higher than for those with less caries. This was also the case for the functional limitations domain scores for the CPQ8-10(but not for the CPQ11-14).
Gradients with caries experience were apparent across scores for all of the domains (except for social well-being in the CPQ11-14). A criticism of these findings is that they
could be due to the children not understanding the items in either instrument due to the language used. While this is possible, it is unlikely given the consistency of the gradi-ents across the response categories of the global OHRQoL item in Table 4: these suggest strongly that the younger children’s understanding of the items was as good as that of the older children. Thus, while there may be a theoretical objection to using the instrument with younger children, the empirical data do not support it.
There was a difference between the two original versions
in the reference period used: the CPQ8-10 had been
validated with a 4-week reference period and the CPQ11-14
validated with a 3-month one. This introduced the chal-lenge of which to use in this younger age group. We opted to use the 4-week reference period because a shorter time frame has been supported for use with younger children, with reference to the previous seven days having been ad-vocated previously [22]. However, as with the development of the SOHO-5, we felt that very few children would have experienced the impact of caries within such a short time frame [12]. The 4-week interval appeared to be acceptable for these younger children.
Developing a valid and reliable OHRQoL measure for young children has important implications because it can enhance understanding of how oral conditions affect the life of younger children. Dental caries is a chronic disease which affects many young children, with 50% of New Zealand 5-year-olds having experienced it [1]. It is thus important to measure how this impacts on children’s day-to-day lives and whether changes in clinical care may affect this. The CPQ versions have shown validity and reli-ability in older age groups and now appear to show some promise for use in a younger age group.
Conclusion
It appears that it is practical to use the CPQ11-14 with
children as young as five years old, although this study represents the first stage in validating this questionnaire for children younger than those for whom it was originally designed. However, further research with population-based samples and in other settings is required in order to con-firm the findings from this clinical sample of children with relatively high caries experience. Further work is necessary to determine the appropriateness of the language for the younger age group.
Competing interests
The authors declare that they have no competing interests.
Authors’contributions
All authors have made substantive contribution to this study and manuscript and have reviewed the final paper. All authors read and approved the final manuscript.
Acknowledgements
We thank the Health Research Council (for funding this project), the dental therapists in Hawkes Bay Community Oral Health Service, and the children who took part in the study.
Author details
1Department of Oral Rehabilitation, School of Dentistry, University of Otago,
PO Box 647, Dunedin, New Zealand.2Department of Oral Sciences, School of Dentistry, University of Otago, Dunedin, New Zealand.3Department of Oral Sciences, School of Dentistry, University of Otago, Dunedin, New Zealand.
Received: 8 January 2013 Accepted: 4 June 2013 Published: 12 June 2013
References
1. Ministry of Health:Our Oral Health: Key findings of the 2009 NZ Oral Health Survey. Wellington: Ministry of Health; 2010.
2. Malden PE, Thomson WM, Jokovic A, Locker D:Changes in parent-assessed oral health-related quality of life among young children following dental treatment under general anaesthetic.Community Dent Oral Epidemiol2008, 36:108–117.
3. Petersen PE:The World Oral Health Report: continuous improvement of oral health in the 21st century—the approach of the WHO Global Oral Health Programme.Community Dent Oral Epidemiol2003,2003:3–24. 4. Locker D, Allen PF:Developing short-form measures of oral health-related
quality of life.J Public Health Dent2002,62:13–20.
5. Jokovic A, Locker D, Stephens M, Kenny D, Tompson B, Guyatt G:Validity and reliability of a questionnaire for measuring child oral-health-related quality of life.J Dent Res2002,81:459–463.
6. Locker D, Jokovic A, Stephens M, Kenny D, Thomson B, Guyatt G:Family impact of child oral and oro-facial conditions.Community Dent Oral Epidemiol2002,30:438–448.
7. Jokovic A, Locker D, Stephens M, Kenny D, Tompson B, Guyatt G: Measuring parental perceptions of child oral health-related quality of life.J Public Health Dent2003,63:67–72.
8. Jokovic A, Locker D, Tompson B, Guyatt G:Questionnaire for measuring oral health-related quality of life in eight- to ten-year-old children. Pediatr Dent2004,26:512–518.
9. Broder HL, McGrath C, Cisneros GJ:Questionnaire development: face validity and item impact testing of the Child Oral Health Impact Profile. Community Dent Oral Epidemiol2007,35:8–19.
10. Gherunpong S, Tsakos G, Sheiham A:The World Developing and evaluating an oral health-related quality of life index for children; the CHILD-OIDP.Community Dent Health2004,21:161–169.
11. Pahel BT, Rozier RG, Slade GD:Parental perceptions of children’s oral health: The Early Childhood Oral Health Impact Scale (ECOHIS).Health Qual Life Outcomes2007,5:6.
12. Tsakos G, Blair YI, Yusus H, Wright W, Watt RG, McPherson LM:Developing a new self-reported scale of oral health outcomes for 5-year-old children (SOHO-5).Health Qual Life Outcomes2012,10:62.
13. Foster Page LA, Thomson WM, Jokovic A, Locker D:Validation of the Child Perceptions Questionnaire (CPQ 11–14).J Dent Res2005,84:649–652. 14. Foster Page LA, Thomson WM, Jokovic A, Locker D:Epidemiological
evaluation of short-form versions of the Child Perception Questionnaire. Euro J Oral Sci2008,116:538–544.
15. Wilson G, Broder HL, Philips C:Concordance between caregiver and child reports of children’s oral health-related quality of life.Community Dent Oral Epidemiol2007,35:32–40.
16. Hetherington EM, Parke RD, Locke VO:Child Psychology: A Contemporary Viewpoint.New York: The McGraw-Hill Companies; 1999.
17. French D, Christie M:Developing outcome measures for children:“quality of life”assessment for pediatric asthma. Hutchinson A, McColl E, Riccalton C, editors.Amsterdam: Harwood Academic Publishers; 1996.
19. Gowda SS, Thomson WM, Foster Page LA, Croucher NA:What difference does using bitewing radiographys make to epidemiological estimates of dental caries prevalence and severity in a young adolescent population with high caries experience?Caries Res2009,43:436–442.
20. Kline P:A Handbook of Psychological Testing.London: Routledge; 1993. 21. Streiner D, Norman G:Health Measurement Scales: a practical guide to their
development and use.3rd edition. Oxford: Oxford University Press; 2003. 22. Eiser C, Mohay H, Morse R:The measurement of quality of life in young
children.Child Care Health Dev2000,26:401–413.
doi:10.1186/1472-6831-13-26
Cite this article as:Foster Pageet al.:Do we need more than one Child Perceptions Questionnaire for children and adolescents?.BMC Oral Health201313:26.
Submit your next manuscript to BioMed Central and take full advantage of:
• Convenient online submission
• Thorough peer review
• No space constraints or color figure charges
• Immediate publication on acceptance
• Inclusion in PubMed, CAS, Scopus and Google Scholar
• Research which is freely available for redistribution