R E S E A R C H
Open Access
Rapid emergency assessment of ash and gas
hazard for future eruptions at Santorini
Volcano, Greece
S F Jenkins
1*, S Barsotti
2,3, T K Hincks
1, A Neri
2, J C Phillips
1, R S J Sparks
1, T Sheldrake
1and G Vougioukalakis
4Abstract
Hazard assessments for long-dormant volcanoes, where information is rarely available, typically have to be made rapidly and in the face of considerable uncertainty and often poor information. A conditional (assuming an eruption), scenario-based probabilistic approach to such an assessment is presented here for Santorini volcano (Greece). The rapid assessment was developed and implemented in response to the 2011-2012 unrest crisis in order to inform emergency management and planning. This paper synthesises the results presented to the Greek National Committee and scientific community involved. Two plausible eruptions at Santorini were investigated, using multiple inputs and dispersal models, based on observations of historic eruptions and expert judgement. For ash hazard, a‘most likely’eruption scenario was developed, characterised by slow lava extrusion over periods of one to two years with weak but persistent explosions and ash venting up to 3 km. A second‘largest considered’ sub-Plinian explosive scenario assumed a 12 km high column of 4-h duration. For gas hazard, constant fluxes of 200 and 800 tons/day SO2were assumed for the duration of the eruption scenarios, noting that there is very little
evidence to constrain SO2flux from Santorini eruptions. Statistical models of likely wind conditions with height
and season were developed from decadal reanalysis time series showing that consistent low-altitude winds were rarely maintained for more than a few days. Stochastic models of ash (TEPHRA2, VOL-CALPUFF) and gas (AERMOD) dispersal provided outputs in the form of probability maps and exceedance probability curves for key loading and concentration thresholds at important locations on the island. The results from the rapid assessments presented in this paper confirm that ash and gas hazard is likely to be of concern if an eruption of Santorini occurs. Higher hazard may be expected to the south and east of the volcano, notably at important tourist and transport hubs. Low hazard to the north and northwest suggests that these may be suitable locations for emergency response centres and emergency critical infrastructure. This approach may provide a blueprint for rapid ash and gas assessment for other long-dormant volcanoes and we provide suggestions for refining the methods used.
Keywords:Volcanic hazard and risk assessment; Ash and gas dispersal modelling; Scenario-based probabilistic hazard modelling; Emergency management planning; Santorini Volcano; Greece
Introduction
Unrest on long-dormant volcanoes, for which hazard in-formation is commonly sparse, typically requires rapid hazard assessment, given that possible onset of eruption may be within days to months of the start of unrest. As-sessments have to be made promptly to inform decision-making and planning for an emergency. However, the information that is required as input for such assessments
may be incomplete, of poor quality or even non-existent. It is likely that such volcanoes either have no historic rec-ord or that the last historic eruption was prior to the avail-ability of modern instrumental monitoring, which is now common on many active volcanoes (Sparks et al. 2012). Some important types of data, such as volcanic emissions, may thus be completely absent and there will be limited time for gathering new data or carrying out new research. In these cases, information from similar volcanoes with better information may help in estimating some critical parameters.
* Correspondence:Susanna.Jenkins@bristol.ac.uk
1Department of Earth Sciences, University of Bristol, Bristol BS8 1RJ, UK
Full list of author information is available at the end of the article
Here we describe rapid hazard assessments carried out for Santorini volcano, Greece, during a recent period of
unrest (2011–2012). The last eruption of the volcano
was in 1950 and was relatively weak, however historical and geological records suggest that larger eruptions were possible. The assessments presented here were carried out to inform the Greek National Committee and assist them in considering emergency management and plan-ning for a future eruption. This approach may provide a blueprint for rapid ash and gas assessment for other long-dormant volcanoes.
Study overview
Following approximately 60 years of relative quiescence at Santorini volcano, Greece, seismic swarms and expanding radial deformation began in January 2011, continuing throughout the year before dying down early in 2012. Deformation and seismicity were focussed in the northern portion of the caldera, approximately 4 km below the sur-face (Newman et al, 2012; Parks et al, 2012; Parks et al, 2013). Observations of this sequence of unrest were un-precedented at Santorini and raised concerns about the impact of a future volcanic eruption. In response to this, and in collaboration with the Greek National Committee for the Scientific Monitoring of Santorini Volcano, we undertook preliminary studies of the potential ash and gas hazards from an eruption at Santorini. The hazards from emissions of volcanic ash and gas are of particular signifi-cance because of their potential impact on the island’s population, economy and critical infrastructure. In par-ticular, closure or disruption of roads, the airport or port may limit the scope of any evacuation or other emergency management actions, such as the provision of supplies or clean-up.
This paper describes two parallel rapid hazard assess-ments that were co-ordinated by two different research groups and undertaken during the state of unrest in late 2011 and early 2012 as concern about volcanic unrest grew. Two of the authors (RSJS and GV) were part of a small group of scientists convened by the local author-ities on Santorini to provide advice and expertise to in-form the authorities about the potential for eruption and possible impacts. The hazard assessments were carried out rapidly to inform this advice. Results were delivered to the Greek National Committee in May and July 2012 and discussed during scientific meetings on Santorini in March 2012 and October 2012. A further parallel inves-tigation was carried out for the Committee that com-bined multiple strands of observational and scientific evidence to quantitatively assess the relative probabilities of different unrest outcomes (see Aspinall and Woo, 2014). Our ultimate aim was to link the assessments so that long-term and real-time revised hazard assessments may be carried out as new evidence becomes available,
potentially also contextualising volcanic hazards along-side other risks facing the island, such as tectonic earth-quake and tsunamis. However, the unrest at Santorini subsided through 2012 and the studies were not pro-gressed to this stage. Ideally, and prior to any future un-rest emergencies, such assessments should be elaborated upon and reviewed in detail.
A small number of plausible eruption scenarios at San-torini were investigated based on observations of historic eruptions and expert judgement, and using stochastic models of ash and gas dispersal. Different tools and data sets were employed by the two groups but both hazard assessments used consistent input data of the eruption scenarios. Ash and gas hazard modelling outputs were produced as probability maps for exceeding key critical thresholds and exceedance probability curves for key lo-cations. We have since bought together the studies to compare and contrast dispersal modelling outputs and to make available a more comprehensive initial evalu-ation of potential ash and gas hazard at Santorini and to suggest emergency management measures. This paper describes a methodology for near real-time hazard assess-ment at volcanoes showing signs of unrest, and should not be used in place, or as an exemplar of, a comprehen-sive volcanic hazard and risk assessment. More detailed study, without the time and data constraints that are im-posed by an emergency, is advisable for Santorini before a further period of unrest or an eruption.
Volcanic setting
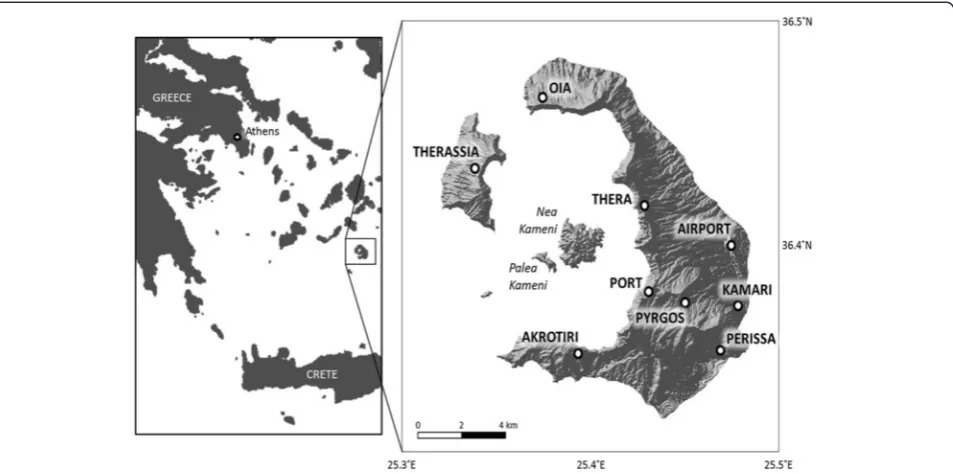
Santorini is the most active volcano in the South Aegean volcanic arc. It comprises a caldera that formed during the catastrophic Thera eruption approximately 3600 years ago, one of the largest volcanic eruptions recorded in hu-man history. Currently Santorini volcano is within an effu-sive phase with dacitic volcanism focussed on the Kameni islands (Fig. 1), which rise 500 m above the flooded cal-dera floor and represent the peak of a sub-aerial shield volcano constructed on a cone of hyaloclastites and sub-marine lava. Previous inter-caldera phases have been char-acterised by extended periods of lava effusion and sporadic tephra emission, leading to the intercalations of lava and tephra layers exposed within the caldera cliffs (Druitt et al, 1999).
intermittent ash explosions over a few months or years (Smithsonian Institution 2013).
There is limited historical information on unrest activ-ity at the volcano. What is available suggests that erup-tions are preceded by an extended period (weeks to months) of felt seismicity and local deformation immedi-ately (days) prior to eruption (Fytikas et al, 1990; Pyle and Elliot, 2006). There are also records of unrest prior to the 2011–2012 unrest episode that did not result in eruption (e.g. Stiros et al, 2010).
Economic and demographic setting
Santorini island is home to just over 15,000 people (Hellenic Statistical Authority 2011), which can swell to more than 500,000 in the summer months. The well-established tourism industry on the island has led to significant eco-nomic and population growth and the majority of the per-manent population are employed within the tourist sector. Only a small proportion of the population still have trad-itional occupations of fishing and viniculture (Dominey-Howes and Minos-Minopoulos, 2004; Vougioukalakis and Fytikas, 2005). Thus all livelihoods are at risk from a fu-ture volcanic eruption and any evacuation, unrest or non-magmatic activity (e.g. phreatic eruptions) is capable of having a significant impact upon the local economy.
Stochastic hazard models
In carrying out the parallel rapid hazard assessments de-scribed in this paper, two ash models were used: TEPHRA2 (Bonadonna et al, 2005) to allow for rapid computation of
ash fall hazard and VOL-CALPUFF (Barsotti et al, 2008) to assess the airborne ash hazard. VOL-CALPUFF also out-puts the ash fall hazard and so we were able to quantita-tively compare the hazard outputs from numerically different approaches to ash fall modelling. The rationale for assessing the hazard independently using different models and datasets is not to carry out a systemic model compari-son but to describe how science is undertaken by different groups in an emergency: broadly similar hazard outputs would strengthen our confidence in the presented results. For modelling of gas (SO2) dispersal, the boundary layer
pollution model AERMOD (Cimorelli et al, 2005) was used. In what follows, we briefly introduce each of these models before discussing the statistical models of wind conditions developed for the study.
TEPHRA2
TEPHRA2 is a Eulerian dispersal model that assumes an initial released mass of ash distributed between the ground and the plume top for a single event (Bonadonna et al, 2005). Particles are then advected by a steady-state wind at source and spread out by atmospheric diffusion, diluting their concentration. Particles fall according to
terminal velocities that account for Reynold’s number
variations along the particle’s fall to earth, derived from the particle size distribution and the stratified wind field (Bonadonna et al, 2005). Model inputs are shown in Table 1 and were estimated from expert judgement, based on experience and knowledge of the scientific literature and analogous volcanoes. As we were concerned with Fig. 1Map of Santorini caldera, and its location within Greece, the recent volcanic islands of Nea Kameni and Palea Kameni and nine key
proximal on island deposits (<10 km from source), the dif-fusion coefficient and fall time threshold were relatively low to be appropriate for the area scale of the modelling (Bonadonna et al, 2005). Model outputs for each simula-tion comprise the ash load at each cell, with target cells computed individually rather than across a uniform‘grid’, giving an ash load‘footprint’for each released ash mass.
VOL-CALPUFF
VOL-CALPUFF couples a Eulerian description of plume rise with a Lagrangian representation of ash dispersal as a series of diffusing packets (Barsotti et al, 2008). The model is able to describe the tilting effects of the plume due to wind action and uses orography-corrected me-teorological and volcanological conditions that simulate the transient and three-dimensional transport of vol-canic ash throughout the eruption duration. The settling velocities of particles are described as a function of par-ticle characteristics (density, size and shape) and atmos-pheric conditions. VOL-CALPUFF is therefore a useful tool for reconstructing and forecasting both ash concen-trations in the air and ash fallout (dry and wet) on the ground from the same scenario (Barsotti and Neri 2008; Spinetti et al, 2013). To enable comparison of the ash fall footprints from VOL-CALPUFF with those derived from TEPHRA2 we deliberately used the same volcano-logical input parameters for the two models (Table 1). For the presented results, VOL-CALPUFF has been run by using hourly meteorological data pre-processed by using CALMET (Scire et al. 1990).
AERMOD
AERMOD is a widely used boundary layer pollution model that involves release of a source plume of tracers (e.g. SO2or ash), which are then tracked as they are
car-ried by wind and interact with topography (Cimorelli et al, 2005). The model has been applied at Masaya volcano
in Nicaragua and compared well with measurements of
SO2 concentration (Johns, 2010). Input parameters
include vent radius, vent velocity, exit temperature and tracer flux (Table 2). These parameters are not independent because values have to be internally consistent since tracer flux depends on radius and velocity. Near ground concen-trations of SO2are calculated and reported here. Results
are weakly sensitive to variations of velocity and radius for fixed mass flux because overall source buoyancy is con-stant and plume heights are only weakly dependent on ini-tial momentum.
Wind conditions
The wind is a primary control on dispersal of ash and gas. Statistical analysis of wind data at different altitudes characterises variability of wind speed and direction as functions of height. Model wind data were sourced for TEPHRA2 from the European Centre for Medium Range Weather Forecasts (www.ecmwf.int) and constitute 20 years of daily averaged regional ERA-Interim re-analysis data (1990 to 2011) sourced from a 0.7° grid. Model wind data for use with VOL-CALPUFF were sourced from the Na-tional Centers for Environmental Prediction and Atmos-pheric Research (www.cpc.ncep.noaa.gov) and constitute 10 years of regional re-analysis data (1980 to 1990) avail-able on a 0.75° grid with a temporal resolution of 6 h. The different types of wind data adopted by the two models were a result of the different nature of the two dispersal models and also the requirement for wind data to be pre-processed and rapidly available so that model outputs
Table 1Ash modelling inputs for an expected most likely future eruption at Santorini
Model input parameter Value Description
Vent elevation 367 (m) From Smithsonian Institution (2013)
Eddy constant 0.04 Eddy diffusion value for Earth for small particles (Suzuki,1983)
Diffusion coefficient 142.6 Describing the advection and diffusion of large particles (m2/s)
Fall time threshold 188.6 Threshold for change in diffusion calculation (seconds fall time)
Particle density 2300 Assumed density of particles (kg/m3)
Plume steps 200 Number of column integration steps
Particle classes 100 Number of particle size classes
Plume ash distribution 0 Initial mass uniformly distributed from base to top of plume
Table 2Gas modelling inputs for an expected most likely future eruption (a 200 tons/day or 800 tons/day scenario) at Santorini
Model input parameter
Value Description
Vent elevation 113 m From Pyle and Elliot,2006
Exit temperature 1000 K Typical temperature of magmatic gases from dacitic magma
Proportion of SO2 5 % As a proportion of erupted gas,
the other gas being water
Gas exit velocity 10 m/s Estimate made from typical values
Gas exit density 0.12 kg/m3 Density of water at 1000 K
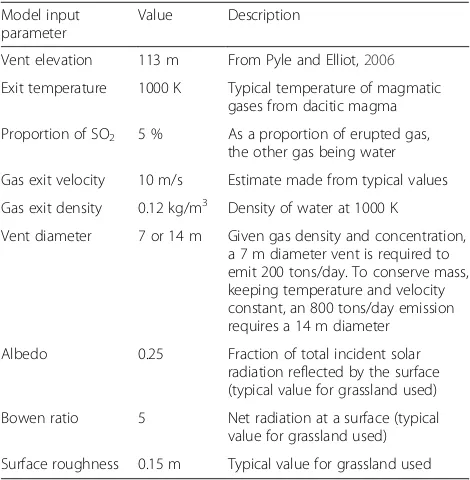
Vent diameter 7 or 14 m Given gas density and concentration, a 7 m diameter vent is required to emit 200 tons/day. To conserve mass, keeping temperature and velocity constant, an 800 tons/day emission requires a 14 m diameter
Albedo 0.25 Fraction of total incident solar
radiation reflected by the surface (typical value for grassland used)
Bowen ratio 5 Net radiation at a surface (typical value for grassland used)
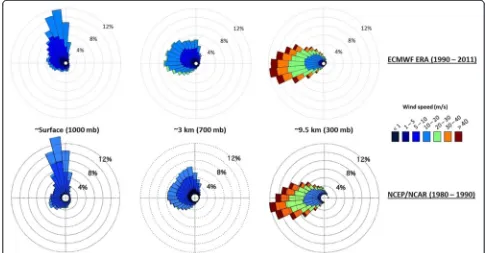
could be obtained as quickly as possible. As an advection– diffusion model, TEPHRA2 uses a single time-averaged wind record at source that does not vary with time; by con-trast, VOL-CALPUFF accounts for temporal and spatial variation in the wind and therefore requires processing of the reanalysis data to provide time-varying and high-resolution wind inputs. Figure 2 summarises the data from both data sets with rose diagrams showing the proportions and ranges of wind speed and direction at three different heights and suggests that minimal differences exist in wind statistics between the two datasets. Comparison between the outcomes from the two models and their underlying wind datasets (Comparison of model outputs) allowed us to evaluate the effect of different models and model input data on hazard analyses and therefore to highlight the most robust outcomes of the assessment.
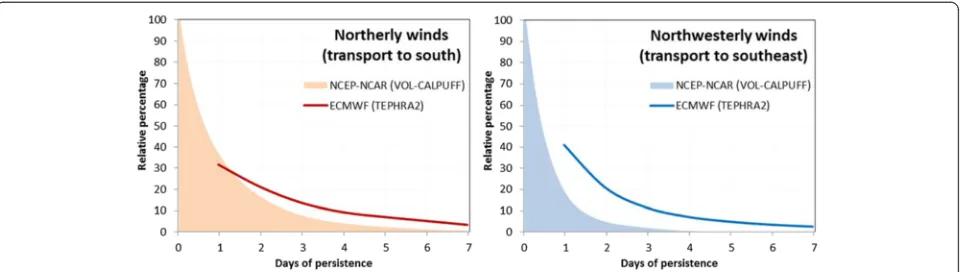
The key features of the wind statistics are the predomin-ance of northerly winds at low altitude (<1 km) while there is a dominance of westerly and north-westerly winds at higher altitudes, which are weaker over the summer months (June to August). Wind speeds are mostly below 10 to 20 m/s at lower altitudes (≤3 km) but at higher alti-tudes relevant to the sub-Plinian scenario (12 km), speeds are commonly up to 30 to 40 m/s. These wind character-istics have first order hazard implications discussed later. Another useful parameter when considering ash dispersal is wind persistence towards a given direction. We divided direction into eight 60° sectors and used the two sets of
re-analysis data to calculate separately the statistical distri-bution of the number of days that the wind persisted in that direction. Salient examples are shown in Fig. 3 and they indicate that the ECMWF and NCEP/NCAR datasets produce similar information on wind conditions at Santo-rini. Analysis of these data shows that a consistent low altitude wind direction is rarely maintained for more than a few days. Thus it is highly probable that in a prolonged eruption all parts of the island will be affected.
Scenario identification
Given the rapidity of this study, being carried out during the unrest crisis, and the limited supporting data available to characterise a full suite of eruption scenarios with ap-propriate distributions and parameterisation, we chose to consider only a small number of plausible and representa-tive scenarios. Using arbitrary choices based on such few data (even with input from expert judgement) to inform a fully probabilistic assessment may have suggested that model parameters (and associated uncertainties) were well constrained, leading to a false degree of confidence in the output. Conversely, had input ranges been used that rep-resented the (true) high degree of uncertainty, rather than those refined through the use of scenarios, resulting out-puts would vary so much as to have little practical value. The outputs provde a starting point from which to identify potential hazards and areas at greatest risk so as to inform further, more detailed, analysis. Ideally, hazard assessment
at long dormant volcanoes would draw in more analogue and volcano-specific data and carry out more detailed time-series analysis than was possible at the time of the Santorini crisis. We would also recommend that a range of experts be elicited, formally or informally, in order to quantify better the credible ranges over which scenarios and inputs vary. Where possible, identifying which outputs are of most importance for emergency managers would help in deciding which inputs to focus on.
The eruption history at Santorini exhibits three main styles of eruption: 1) caldera-forming eruptions with a Volcanic Explosivity Index (VEI) of 6 or 7, analogous to the 3600 Ka Thera eruption; 2) sub-Plinian explosive (VEI 4) eruptions, similar to that of 726 AD; and 3) long-duration weak ash emissions that accompany extrusion of lava, as seen at Santorini over the last 500 years (Fytikas et al. 1990; Druitt et al, 1999; Pyle and Elliot, 2006; Smithsonian Institution 2013). An eruption similar to the Thera eruption would blanket the island of Santorini in pyroclastic deposits and have significant regional, and global, effects. However, the recurrence interval of such an eruption is approximately 15 to 20 thousand years (Dominey-Howes and Minos-Minopoulos, 2004) and the consensus interpretation is that Santorini is in a post-caldera shield-building stage of volcanism. Thus we considered this eruption style very unlikely in the current impact assessment. We therefore restricted our
assess-ment to two scenarios: a ‘most likely’ weak ash plume
based on recent historical eruptions of 1866–70, 1925–26 and 1939–40, and a‘largest considered’sub-Plinian event, based on evidence of significant pumice generation in the eruption of 726 AD and on geological records that suggest Santorini is capable of powerful mid-intensity explosive eruptions. As a consequence, for each scenario, we only account for aleatoric uncertainty in the wind conditions at the time of eruption by simulating a large number of runs into multiple wind conditions producing condi-tional (assuming an eruption) probabilistic outputs. The
volcanological inputs for modelling of these scenarios are detailed over the next sections.
Most likely scenario
The perceived ‘most likely’ future eruption scenario at Santorini is informed by the studies of Fytikas et al. (1990), Pyle and Elliot (2006) and Watt et al. (2007) and by descriptions of past eruptions, notably 1866–70, 1925– 26 and 1939–40. Historical observations at Santorini indi-cate that ash emissions are related to intermittent explo-sions and ash venting that occurs contemporaneously with extrusion of lava. Compared to many other arc volca-noes, explosive activity is quite small in magnitude and weak in intensity. The largest events consist of Vulcanian explosions that can eject blocks of rock as far as 2 km from the vent and produce ash plumes that reach up to 3 km height. However, most of the explosive activity is less intense, generating plumes in the range of a few hundred metres to not much more than 1 km height. Hazards asso-ciated with these eruptions include the ejection of ballis-tics during explosions, the dispersal and fallout of ash and the release of volcanic gas from the vent and as lava enters the sea (Fytikas et al, 1990). Historical accounts suggest that the range of ballistics is about 1 km (Fytikas et al, 1990). As there are no settlements within 2 km of the likely future vent on the Kameni islands we did not further consider the potential impact from ballistics, although large ships that necessarily pass close to the likely future vent on Nea Kameni islands en route to the Port may be at risk from this hazard.
Ash modelling inputs
1866–70 eruption by Schmid (1874), Fouqué (1879) and Dekigalla (1881), and also considering some of the eruption data summarised by Watt et al. (2007). During any of the previous eruptions, a maximum plume height of around 3200 m was observed (in 1925), with minimum plume heights in the order of a few tens to hundreds of metres. We therefore chose to model four separate plume heights: 0.5, 1, 2 and 3 km, on the basis that this accounted for the variability observed in previous eruptions and therefore covered what was likely for a future most likely scenario. By modelling specific plume heights, rather than a continous range between 0.5 and 3 km, we could then provide individual hazard maps for different plume heights. We consider that this approach was appropriate for emer-gency managers in permitting near real-time forecasting of the hazard from specific events and for scenario planning. Two separate cases for ash production during a most likely scenario eruption are described here to account for differ-ent approaches to calculating mass flux from plume height. The vast majority of Vulcanian plumes are best charac-terised as starting plumes. Volcanic ash plumes are only modelled as thermals if the event is very close to being instantaneous; by contrast, the source explosion supplying a starting plume does so over times comparable to, or greater than, the time taken for the plume to rise to its neutral buoyancy height (see Sparks and Wilson, 1982; Sparks et al, 1997). Observations of the ash plume spread-ing rate can be used to distspread-inguish easily between a thermal and a sustained or starting plume as the entrainment coef-ficient is about 0.25 for a thermal and about 0.1 for a sus-tained or starting plume (Sparks et al, 1997). This leads to a height to width ratio of approximately 25 and 10 respect-ively. The majority of plumes generated by Vulcanian explosions, including historic photographs of Santorini ex-plosions, are closer to 10 than 25, indicating that they are best characterised as starting plumes.
There are well established empirical relationships be-tween plume height and mass flux (e.g. Sparks et al, 1997; Mastin et al, 2009) based mostly on powerful eruptions, and these are widely used to assess ash hazard to aviation. Santorini‘Strong’assumes that this relation-ship is valid. However, recent studies suggest that these relationship are not accurate for weak plumes strongly affected by wind, e.g. 2010 Eyjafjallajökull eruption, Iceland. The Santorini‘Weak’scenario accounts for this using the scaling relationship of Woodhouse et al. (2013) with the scenario column heights and wind shear calcu-lated from averaged reanalysis data, which results in an order of magnitude increase in mass flux (Table 3). The total time and the total mass fraction of erupted ash has been calculated for the baseline Santorini Strong and Weak scenarios (Table 4), given the calculated mass fluxes and an estimate of total erupted volume from historical eruptions at Santorini. Only a very small percentage of
magma erupted in a most likely scenario is expected to be ash (0.1 % in Santorini Strong and 1 % in Santorini Weak). Over the assumed two-year period the percentage of time the models assume ash is generated is 15.3 % and 7.6 % of the total time, respectively. These numbers are indicative and qualititatively consistent with descriptions of historic eruptions. The‘Santorini Weak’case, where we considered the effect of local wind conditions on bending over a weak plume, gives higher mass loadings than assuming no wind-plume interaction (‘Santorini Strong’) because of the increased mass. Thus the calculated hazard will be higher during ashing events in this case, although there are more periods when there is no ash.
due to lack of data. To begin to investigate the effect of event clustering on the potential ash hazard, a modifica-tion to the base Santorini Strong and Weak scenarios is identified where we simulate a non-stationary Poisson process by increasing the Poisson rate parameter to ac-count for shorter inter-event times, and therefore cluster-ing of events (with the total duration of the ash-produccluster-ing portion of eruption assumed to be 1 year, see scenario var-iations in Table 3).
Grain size distributions (Table 3) are based on qualita-tive descriptions of ‘sandy to very fine’ ash in Santorini eruptions (Kténas, 1926). However, a common process in volcanic eruptions is particle aggregation, in which fine ash (typically < 64 μm) is deposited in the form of
clusters containing tens of thousands of particles. These aggregated particles deposit much more quickly than the individual particles, but often break up on impact with the ground. The resulting increased abundance of very fine ash exacerbates health hazards (Horwell and Baxter, 2006). Commonly the mass fraction of fine ash can exceed 50 %, but this is not known from Santorini eruptions. To simulate the effect of particle aggregation on ash dispersal and deposit loading on the ground, we investigate a fur-ther variant of both the‘Santorini Strong’and‘Weak’ sce-narios. Aggregated particles are assumed to be in the reduced range 1 cm - 100 microns (phi−3.32 to 3.32), but with a modified grain size distribution that favours larger particle sizes (Table 3). This modification is purely qualita-tive and requires further investigation and grain size char-acterisation before being used in a more comprehensive assessment.
For these six scenario variants (Table 3), individual event deposits and cumulative mass loads (total deposit from all events over the 1 or 2 year duration of the eruption) were logged for each grid location and used to produce probability of exceedance curves. The deposits (from all plumes) for each day of the eruption were also summed to get the cumulative daily, weekly, monthly and total deposit at any given site. Results for the six variants were presented separately to elucidate the effect of different mechanisms on the hazard and also to allow
Table 3Volcanological inputs for a‘most likely’long-duration ash emission with assumed event mass and duration (and thus mass flux) given two scenario cases:‘Strong’assumes that the Sparks et al. (1997) empirical relationship between plume height and mass flux is valid (i.e. the plume is not strongly affected by wind), while‘Weak’considers that the plume is affected by wind and follows the relationship of Woodhouse et al. (2013)
Height (km)
Number of events
Poisson rate parameter
Event ash mass (x106kg) Duration (mins) Particle size (phi)
Strong Weak Strong Weak
Total eruption duration: 2 years
3 5 0.007 6 60 10 10 Range:−3.32 to 6.64
2 20 2.74 × 10⁻² 1.8 30 15 15 Median: 1.66
1 75 0.103 1.1 5.4 120 60 Standard deviation: 2
0.5 400 0.548 0.2 1.1 360 180
Scenario variants to investigate the effect of ash aggregation
Particle size is modified to favour larger particles. Range:−3.32 to 3.32
All parameters as for the base Santorini‘Weak’and‘Strong’scenarios. Median: 0.00
Standard deviation: 2 Scenario variants to investigate the effect of event clustering
Total eruption duration: 1 year
3 5 0.014 Increased Poisson rate parameter simulates shorter inter-event times.
2 20 5.48 x 10⁻²
1 75 0.205 All other parameters as for the base Santorini‘Weak’and‘Strong’scenarios.
0.5 400 1.096
Duration refers to individual events, rather than the total eruption duration, and relates to the event ash mass and calculated mass flux. Further variants build upon these base scenarios to investigate the influence of aggregation and event clustering on simulated hazard
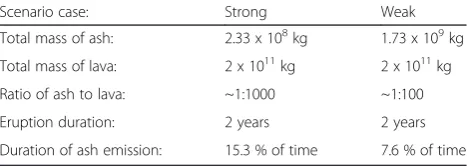
Table 4Summary values for the two‘most likely’scenario cases at Santorini. The‘Strong’case assumes no influence of the wind upon the plume (Sparks et al, 1997) and the‘Weak’considers that the plume may be affected by wind (Woodhouse et al, 2013)
Scenario case: Strong Weak
Total mass of ash: 2.33 x 10⁸kg 1.73 x 10⁹kg
Total mass of lava: 2 x 10¹¹kg 2 x 10¹¹kg
Ratio of ash to lava: ~1:1000 ~1:100
Eruption duration: 2 years 2 years
direct comparison between the models. Exceedance probability maps and curves were also produced for each of the fixed height plumes to show the likely hazard as-sociated with any one event.
Gas modelling inputs
Significant health effects from magmatic gases have been historically documented during past eruptions of Santorini (Dakoronias, 1879). However, no direct measurements of SO2fluxes exist for these events making it difficult to
con-strain likely fluxes in a future eruption. For the emergency assessment, we considered two daily averaged fluxes for the most likely two-year scenario: 200 tons/day and 800 tons/ day. Fluxes have been estimated based on petrological ana-lyses and inferred discharge rates for previous eruptions. Using a typical sulphur content of 1000 ppm for dacitic magmas and magma discharge rates of 1 m3/s, similar to those observed historically (Pyle and Elliot, 2006), a default scenario with a constant flux of 200 tons per day is pro-vided. Such a value is characteristic of many effusive erup-tions of dacitic arc volcanoes, such as Mount Unzen, Japan,
1991–1995 (Hirabayashi et al, 1995) and Mount Saint
Helens, USA, 2004–2005 (Gerlach et al, 2008). Higher
fluxes of SO2 may be expected if there is an increased
erupted mass flux (i.e. Santorini Weak) or more explosive activity. Furthermore, many arc volcanoes exhibit an“excess degassing”phenomena where fluxes of SO2are too large to
originate exclusively from the magma that is erupted, sug-gesting that other SO2sources are contributing (Shinohara,
2008). A scenario based solely on mass fluxes (as for the 200 tons/day case) could therefore be an underestimation of the true flux; however, reliable constraints for sources and fluxes of SO2could not be achieved. A best estimate of 800
tons/day was chosen, which reflects the elevated fluxes ex-pected from an eruption with increased mass flux or excess degassing. This value was based on expert judgement and gas fluxes from analogous arc volcanoes that exhibit more explosive activity and degassing over similar two-year time-scales, such as Mount Augustine (McGee et al, 2010).
We chose values of gas exit velocity, vent radius and gas exit density that were consistent with the mass flux
identified (200 or 800 tons/day) and an SO2proportion
of 5 %, using the standard equation for state of water at 1000 K at 1 atmosphere to calculate the gas exit density. For each eruption scenario, 100 two-year simulations were randomly sampled from a synthetic catalogue of 379 simulations to obtain 0.05, 0.5 and 0.95 probability of exceedance values. Initial wind conditions were sam-pled from within a 20-year record and daily wind re-cords over the following two years were used.
Largest considered scenario
The second key scenario employed in this study was a sub-Plinian eruption, a largest considered scenario for a
future eruption at Santorini, with lower probability of occurrence than the most likely scenarios but higher probability than a large caldera-forming eruption. Based on very limited and uncertain data (one pumice eruption in 726 AD of unknown magnitude out of eight historic eruptions) the chances of the next eruption at Santorini being sub-Plinian are thought to be no more than 1 in 10 and likely much lower given that the past seven erup-tions have been largely lava eruperup-tions. For gas outputs, averaged daily values of 800 tons/day may provide a first-order indication of hazard appropriate to a large ex-plosive eruption followed by sustained degassing.
Ash modelling inputs
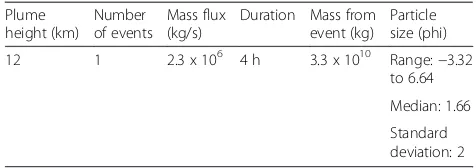
Based on analogous sub-Plinian eruptions (Pyle 2000) and the limited historical accounts of 726 AD (Friedrich et al, 2006), we considered a plume height of 12 km (Table 5) and discharge rate of 1000 m3/s, which correlates with an erupted mass of 3.3 × 10¹⁰kg over four hours, given a dens-ity of erupted material of 2300 kg/m3(following the empir-ical relationship of Sparks et al, 1997). Ash produced during the largest-considered scenario represents approxi-mately 15 % of the total expected volume, but 150 % of the expected total ash mass in the more voluminous most likely scenario (Santorini Weak). In the absence of specific infor-mation, we used the same grain size distribution as for the weak plume scenarios, approximately representing sandy to very fine ash (Table 5). Grain size estimates could be refined using information from analogue sub-Plinian eruptions at other volcanoes. For the sub-Plinian scenario suggested here, it is possible that as much as 40 % of the erupted ma-terial would comprise fine ash (<63μor >4 phi) (Mastin et al, 2009). This would have the effect of reducing the deposit in more proximal on-island areas as the fine ash fraction would remain in suspension for longer and be carried far-ther from the vent. Particle density (Table 1) was kept fixed at 2300 kg/m3; any pumiceous particles will likely be lower density than this and ideally the sub-Plinian scenario would account for this, particularly for more proximal hazard esti-mation. As with a finer ash mass fraction, reduced particle densities would act to reduce the amount of ash falling out in more proximal areas. However, the uncertainty related to grain size and density characteristics are modest compared to uncertainties related to the relationships between plume
Table 5Volcanological inputs for a‘largest considered’ sub-Plinian eruption scenario
Plume height (km) Number of events Mass flux (kg/s)
Duration Mass from event (kg)
Particle size (phi)
12 1 2.3 x 10⁶ 4 h 3.3 x 10¹⁰ Range:−3.32
to 6.64
Median: 1.66
height and mass flux in the source term, duration and the abstraction of historic eruption data as discrete and simpli-fied events. It is unlikely that improving the sophistication in modelling grain size characteristics would affect the first-order hazard effects and their implication for emergency planning. One simulated event was modelled for each daily wind record, i.e. 7305 simulations in total, to account for uncertainty in likely wind conditions.
Thresholds and critical locations
Ash fall load thresholds were chosen that approximately re-lated to key hazardous impacts. A threshold of 100 kg/m2 was identified as a conservative loading above which roof collapse may become an issue for very weak roof types (Blong, 1984), and is approximately equivalent to 10 cm of dry ash thickness assuming a fall density of 1000 kg/m3. Using the same ash density assumption, a load of 1 to
10 kg/m2is equivalent to between 1 mm and 1 cm of ash
deposit, and is known to disrupt airport operations, trans-port, cause damage to crops and in certain cases cause elec-trical circuits and electronic systems to malfunction (Barsotti et al, 2010; Jenkins et al, 2014; Wilson et al, 2012).
For suspended ash concentrations, we considered the probability of exceeding ash concentrations of 50 μg/m3 following the World Health Organisation (WHO) air quality standard for 10 micron particulate matter (PM10), and also 2 mg/m3and 0.2 mg/m3as the defined enhanced procedure zone and 2010 safe flying limit for commercial aviation, respectively (ICAO, 2010; Zehner, 2010).
The WHO also provides an Air Quality Guideline (AQG) for daily SO2concentration thresholds of 20μg/m3, below
which air quality is deemed good. The European Commis-sion (EC) provide a daily threshold of 125 μg/m3 beyond
which SO2 concentrations are considered dangerous. EC
and WHO also provide short-term ten minute averages of 350 and 500μg/m3respectively. However, with the uncer-tainty in being able to constrain both the magnitude and temporal variation in SO2fluxes it is felt that the daily
aver-age is the most appropriate limit to use as an initial assess-ment of SO2hazard. The SO2thresholds are used here as
points of reference for modelling purposes and are conser-vative values that have been defined with reference to a general population undertaking everyday activities. Thus they may not be appropriate to an emergency situation; more specific health risk assessments will be needed in case of an eruption, where air quality monitoring and health sur-veillance of the population will be a requirement.
For the objectives of this study, we identified nine lo-cations on the island that represent key centres of popu-lation or critical infrastructure (Fig. 1 and Table 6).
Ground ash hazard
The results of the ash fall modeling can be displayed in several ways to help elucidate the hazard; perhaps the
most useful are exceedance probability maps and exceed-ance curves for individual events. Assuming that each simulation run for any given scenario is equally probable (i.e. probability = 1/number of simulations), the exceed-ance probability is calculated for each grid cell by sum-ming the probabilities from all simulations for the given scenario that exceed the loading threshold at that grid cell. In this way exceedance probability maps or location-specific curves highlight patterns in possible wind condi-tions at the time of a future eruption. Here, we discuss the results from our two defined scenarios: a most likely weak plume and a largest considered sub-Plinian eruption. Pri-mary ash fall hazard results are shown from TEPHRA2 outputs but for the most likely scenario they are also com-pared with those from VOL-CALPUFF.
Most likely scenario
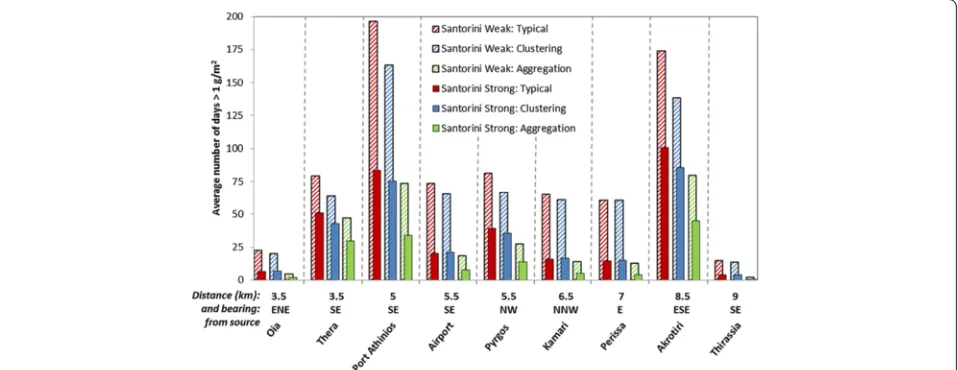
The ground ash hazard assessment for a long-duration weak plume event shows that ash hazard is strongly af-fected by wind direction, with relatively high ash hazard in the south and east of the island, notably at the Port and Akrotiri, and very low hazard at Oia in the north. For each of the six eruption scenario variants (see Scenario identifi-cation and Table 3), Fig. 4 shows the average number of days in the total eruption scenario that the daily ash load exceeds 1 g/m2, considered to be approximately equivalent to the onset of ash fall and reduced air quality. Such ash events are forecast to be about 10 times more likely at the Port than at Oia (Fig. 4).
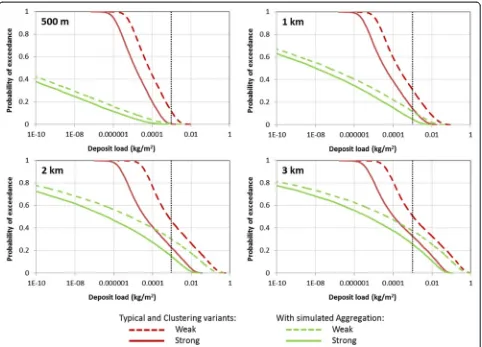
When considering individual events for the typical San-torini Weak case, the probability that the 1 g/m2threshold is exceeded at the Airport changes from 20 to 50 % for plume heights from 0.5 to 3 km (Fig. 5). If 35 % is taken as representative then under the typical Santorini Weak case ash is produced 7.6 % of the time so that the expected pe-riods when ash approaches or exceeds suspended concen-trations would be about 3 % of the eruption duration, or a 1 in 30 chance of flights being disrupted during a two year eruption. Similar relationships to those seen at the Airport (Fig. 5) are observed in the results for other locations. In-creased plume heights produce higher probabilities at all study sites, reflecting the greater reach of the ash. Ash
loading hazard that assumes the ‘Santorini Weak’ case
reduced because the stronger higher plumes, particularly in stronger winds, have similar reach for both assumed grain size distributions. This suggests a lower sensitivity to assumed grain size distribution for the more intense erup-tions. Grain size is poorly constrained at Santorini because of the lack of ash grain size studies for historic Santorini eruptions and this finding suggests that grain size studies should prioritise fallout from weaker ash emissions.‘ Clus-tering’ of events, achieved by reducing the inter-event times according to an increased Poisson rate parameter, leads to more days with higher concentrations; for distinct periods of explosivity within this eruption scenario variant, the more frequent explosive activity invoked by clustering of events may lead to a greater disruption of activities on the island, especially as more closely spaced events will
limit the extent to which manual or environmental ash re-moval can occur. Consequences of this for aviation and the tourism industry and for repeated clean-up activities may be significant.
For a long duration event, as may be expected with the most likely scenario, ash falls may cumulate from multiple events over weeks, months or years and this will lead to much greater accumulations than for the individual events. Plotting the total ash accumulations over two years therefore provides an estimate of the maximum loading; erosion, wind re-distribution, rain and clean-up operations will act to reduce this load in uncertain ways. Figures 6 and 7 show the same results in three different ways to elucidate different aspects of the hazard. Figure 6a shows the hazard spatially as the cumulative deposit with 0.5
Table 6Names and description of key population centres and critical infrastructure, with their location relative to the Kameni islands, the most likely source for a future eruption of Santorini
Name Description Distance and bearing
from Nea Kameni
Thera (Fira) The modern capital of Santorini and a key tourist centre 3.5 km east-northeast
Santorini airport A military and civilian airport receiving international flights 7 km east
Port Athinios The main harbour serving passenger and cargo ships 3.5 km southeast
Pyrgos Tourist village in the centre of the island 5.5 km southeast
Kamari Coastal settlement to the southeast of the island built after the devastating earthquake of 1956
8.5 km east-southeast
Perissa Coastal settlement to the southeast of the island 9 km southeast
Akrotiri An important archaeological site where a Minoan settlement was buried under pyroclastic deposits during the Thera eruption in approximately 1630 BC
5 km south
Therassia The smaller island forming the remains of the caldera wall 5.5 km northwest
Oia A relatively large town of more than 4000 inhabitants 6.5 km north-northwest
Fig. 4The average number of days, for the six scenario variants identified in Table 3, during the course of the one or two-year simulated most
likely eruptions, as computed by the TEPHRA2 model, that the daily deposit exceeded 1 g/m2, approximately related to the onset of ash fall
and reduced air quality. Santorini Weak cases where no aggregation or event clustering is simulated (‘Typical’) result in the highest hazard:
exceedance probability (50 % probability of being exceeded), while Fig. 6b shows the probability of the
cu-mulative deposit exceeding 10 kg/m2 (an exceedance
probability map). Fig. 7 shows the probability of exceed-ing a range of cumulative ash loads at each of the nine sites of interest (an exceedance probability curve). Even considering a maximum cumulated load, the probability of reaching conditions for collapse of very weak roofs (~100 kg/m2) is negligible on the island. These results further indicate that, in the event of a future long-duration eruption, much of the ash will fall out in the caldera and deposits on island will be quite thin, with lowest ash hazard likely in the north of the island at Oia and relatively high ash hazard at Thera, the Port and Akrotiri.
Comparison of model outputs
TEPHRA2 is an open-source, simple advection–
diffu-sion model that assumes an instantaneous release of the erupted mass and steady-state atmospheric conditions. The code can run in minutes on a desktop computer, making it ideal for the rapid hazard assessment and simulation of multiple ash fall scenarios described here, particularly at medium to distal locations. We compare the ground ash hazard results above with an equivalent assessment using the CALPUFF model. VOL-CALPUFF can model a continuous release of mass during an eruption and account for changes in wind condition with distance from source and with time through the eruption. It is able to calculate ash concen-tration in the air as well as loading on the ground, with Fig. 5Exceedance probability curves for ash loading at the Airport for four fixed plume heights as computed by the TEPHRA2 model. Each plot shows the simulated influence of eruption flux to plume height relationships (by assuming the standard relationship of Sparks et al, 1997 for Santorini Strong or the revised Woodhouse et al, 2013 relationship that accounts for wind conditions on weak plume for Santorini Weak) and aggregation (by increasing grain sizes) on ash fall loading. The plots show results for individual eruptions of fixed plume height and so deposit loads are the same for eruptions within the Typical and Clustering variants. Similar results were found for the other key sites. Dashed lines mark
the 1 g/m2threshold, which is used to represent the onset of ash fall and reduced air quality. Note that ash loads are shown on a base 10
particular accuracy at proximal to medium locations. VOL-CALPUFF samples from a 10 year wind dataset sourced from NCEP/NCAR; statistical analysis of this data-set relative to the 20 year ECMWF data used with TEPHRA2 shows little variation between the two sources (Fig. 2). The two models differ fundamentally with VOL-CALPUFF (and other coupled meteorological transport models) having greater input requirements (due to the ex-plicit consideration of the dynamics of the source plume) and more detailed outputs, but longer runtimes than sim-pler advection–diffusion models like TEPHRA2. Few direct comparisons of the models exist and therefore, comparing the models like-for-like provides a representative measure
of model uncertainty in forecasting potential impact and al-lows us to identify areas of impact for which we have the greatest confidence (Fig. 8). Given the computational re-quirements of VOL-CALPUFF, only one scenario variant (the Typical Weak) could be modelled and we compare the results of these runs with the equivalent outputs from TEPHRA2 here.
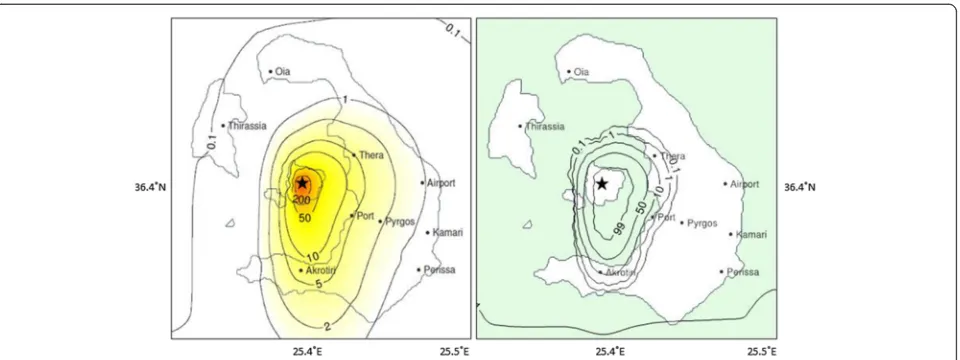
For the simulated most likely weak plume eruption scenario, Fig. 8 shows a comparison between the out-comes of the two models in terms of exceedance prob-abilities with reference to a ground load of 1 kg/m2. The maps show a high level of agreement, particularly for the higher probabilities and so the implications for Fig. 6Probability maps that represent total ash accumulation on the ground over a most likely eruption scenario as computed by the TEPHRA2 model. The same results are shown in two different ways: a) the 0.5 exceedance probability (50 % probability of being exceeded) cumulative
deposit (in kg/m2) in each grid cell; and b) the probability (as a percentage) of the cumulative deposit exceeding 10 kg/m2over the simulated
eruption. A Santorini Weak typical case is assumed. In reality, these probabilities represent an upper bound because ash will be removed or remobilised by natural (rain, wind) and manual clean-up operations. The black star marks the simulated vent location
emergency management planning are similar. In particu-lar, both models show the highest hazard across the southern part of the island. At loads of 1 kg/m2, VOL-CALPUFF shows comparatively larger affected areas, but this trend is reversed at very small loads (<0.01 kg/m2), particularly for weaker events (1 km plume: Fig. 9). Two main factors are thought to describe this outcome. First, the use of hourly meteorological data with VOL-CALPUFF, which allows for wind field variations with time and space and has a strong influence on the ash
dispersal process. In fact, even small changes in wind direction over time will affect ash deposition, particularly in a prolonged eruption. This is confirmed by the fact that the weaker (1 km), but longer (Table 3), events show the largest differences when VOL-CALPUFF and TEPHRA2 outputs are compared (Fig. 9). On the other
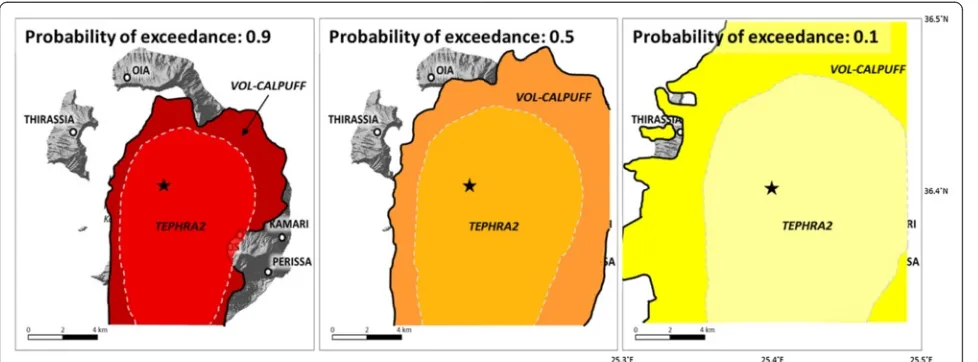
hand TEPHRA2, as any other pure Eulerian advection–
diffusion code, is relatively more diffusive at source and as a consequence affects larger areas with lower mass loadings. This implies that, relative to VOL-CALPUFF, Fig. 8Model comparison plot for a cumulative 2 year ground deposit from the most likely eruption scenario (Santorini Weak) exceeding 1 kg/m2. Results compare outputs from the TEPHRA2 and VOL-CALPUFF ash dispersion models with shaded areas showing the 0.9 (left), 0.5 (middle) and 0.1 (right) probability of exceedance for both models. The black star marks the simulated vent location
more distal locations will be affected by smaller deposits, but that the probability of reaching higher tephra loads in more proximal areas will be lower, as shown in Figs. 8 and 9. In addition to the wind variability over time and plume diffusivity, the different wind datasets employed by the two models may also play a role in differences in model output: at lower altitudes (<1 km), the ECMWF data used by TEPHRA2 has comparatively faster wind speeds than the NCEP/NCAR data used by VOL-CALPUFF (Fig. 2), which may help to compensate for the less lateral disper-sal in the plume. At higher altitudes (~3 km), the wind data are more comparable, although ECMWF reanalysis data show slightly more dominant westerly winds than NCEP/NCAR (Fig. 2). These effects (wind variability and less diffusivity for VOL-CALPUFF) are more evident when a single fixed height scenario is assumed, and are masked within the cumulative 2-years long scenario. Nevertheless, the overall similarity in results is comforting and suggests that for the purposes of rapid emergency management planning a simple advection–diffusion model such as TEPHRA2 can capture the first-order distribution of ash fall hazard locally.
Largest considered scenario
The results of the TEPHRA2 sub-Plinian ground ash haz-ard model are shown in Figs. 10 and 11 as exceedance probability maps and site-specific curves. In this case there is a possibility of roof collapse occurring, although it is small. For weak roof structures at Thera (old or poor condition tiles and lightweight metal sheeting), there may
be approximately a 10 % to 15 % chance of roof collapse (≥200 kg/m2). For the dominant roof type on Santorini (reinforced concrete slab) the chance of roof collapse is negligible (a few %) (following Spence et al, 2005), al-though the hazard could approximately double if there was rain during or shortly after the eruption because of the increased load from saturated ash (Macedonio and Costa, 2012). Local disruption to aviation is certain and might extend tens or even hundreds of kilometres away in regional airspace (although a quantitative assessment of this is outside the scope of this study). Dominant north-westerly and north-westerly winds above 1 to 2 km altitude are most likely to control the dispersal of a sub-Plinian plume and so at lower thickness thresholds (Fig. 10a) areas to the south and east are subject to highest hazard, as for simu-lated weak plumes. With increasing ash load threshold (Fig. 10b), higher hazard is orientated towards the south because lower altitude winds become important for parti-cles that fall out more quickly and for the increased ash amount. Overall, probabilities of ash hazard at Oia and Therassia are much lower than in the south and east (Figs. 10 and 11), with only a 5 to 10 % chance of loads ex-ceeding 10 kg/m2, approximately equivalent to 10 mm de-posit. As with the most likely eruption scenario, this is predominantly a consequence of local wind conditions.
Airborne ash hazard
The presence of an international airport just 7 km to the east of the most recent vent and the importance of Santo-rini as a tourist destination made it important for this rapid
study to also consider the potential ash concentration at altitude. Using VOL-CALPUFF, we generated exceedance probability maps of aerial ash concentration at 1000 m above ground level for two thresholds for aviation safety at
that time: 2 and 0.2 mg/m3. We also used VOL-CALPUFF
to assess ash concentration at ground level because of its important with regard the presence of fine ash that could be inhaled by the population (assumed here to be 15 micron sized particles or less, as a proxy for PM10). We
discuss results for the most likely weak plume eruption sce-nario here.
Most likely scenario
Reference concentration thresholds were exceeded with very low probabilities in the aerial space around the Air-port (Fig. 12); only the 2 and 3 km plume scenarios were able to bring suspended ash towards the east at an alti-tude of 1000 m a.g.l. Assuming a fixed plume height of
3 km, ash concentrations of 2 mg/m3or greater
(Com-mercial aviation Enhanced Procedure Zone) may be ex-pected with a probability of less than 5 %. Smaller fixed plume height scenarios of 0.5 km affected the atmos-phere at altitudes of a few hundred metres in the south-ern part of the island but did not extend to the Airport.
In contrast to the estimated ground deposit hazard, fixed plume height exceedance probability curves for ash concentrations at ground level show hazard (probabil-ities associated with the amount of suspended fine par-ticulate matter) at the nine study sites to be higher for smaller events, i.e. lower plume heights, than for larger events (Fig. 13). Barsotti et al. (2010) have suggested that higher plume heights, releasing larger amounts of ash higher into the atmosphere, support the transport of the finer portion of ash farther from the vent. At Santorini, stronger wind speeds at altitudes above 1 to 2 km (Fig. 2)
will exacerbate this situation, although larger amounts of fine material may be associated with stronger events mean-ing that the difference in hazard close to source remains small. Areas to the south (Akrotiri) are expected to experi-ence highest hazard with respect to the other locations con-sidered for plumes of 2 km or lower. Vice versa, enhanced dispersion and highest hazard towards the east (Port, Thera) are expected with a 3 km plume. These results sug-gest that 10 to 50 % of events with plume heights greater than 1 km will cause conditions in the south and east of the island that could raise health concerns (Fig. 13). How-ever, environmental conditions will strongly influence the level of fine ash exposure and associated impact on air quality. For example, frequent rain will reduce airborne ash concentrations while resuspension of ground ash de-posits through wind, traffic and/or human activities like clean-up will increase airborne ash concentrations, leading to a potentially significant reduction in air quality (e.g. Thorsteinsson et al, 2012).
SO2gas hazard
Significant health effects related to volcanic gases were ob-served during the 1866 eruption of Santorini (Dakoronias, 1879). Thus we made preliminary estimates of future SO2
gas concentrations around the island. We stress that SO2
fluxes from typical Santorini eruptions are poorly
con-strained and large fluctuations in SO2 flux are likely
during eruption. Measurements at other arc volcanoes suggest that these variations can approach an order of magnitude either side of the long-time average flux and that fluctuations can be on time scales of hours to many months. In the event of a future eruption at Santorini, the collection of SO2flux data will be critical in evaluating the
gas hazard more accurately than is possible here. In par-ticular, the vulnerability of at-risk groups in the population Fig. 11Exceedance probability curves for ash loading at each of the key sites on Santorini following the largest considered scenario. The legend
shows sites in order of decreasing hazard at the 100 kg/m2threshold. Sites to the North and West (Oia and Therassia) show very low hazard
will need to be assessed in the light of measured peaks of
SO2of short duration (15 min measurements) and
pos-sible synergistic health impacts from combined elevated fine ash particulate and SO2levels, amongst other factors
not appropriate to consider here. The hazard modelling shows that the effects on air quality in the scenarios out-lined are not trivial and health impact assessments will be a priority in future preparedness measures and actual cri-sis management. Expert medical and air pollution expert-ise should be sought.
The mean number of days (within a two-year degas-sing period) that SO2 concentrations exceed air quality
guideline thresholds set out by the World Health Organ-isation (WHO) and European Commission (EC) for the reference eruption scenarios are shown in Table 7. Results suggest that exposure to reduced air quality (>20 μg/m3) during an eruption is likely to be wide-spread and frequent across the island and Thera, the capital of Santorini and an important tourist site, may experience gas concentrations > 125μg/m3approximately Fig. 12Exceedance probability maps, where the contours show the probability as a percentage, for ash concentrations exceeding 2 mg/m3 (aviation enhanced procedure zone), given fixed plume heights of 0.5, 1, 2 and 3 km within the Santorini Weak case, as computed by the
VOL-CALPUFF model. Exceedance probability maps for the smaller 0.2 mg/m3threshold (2010 aviation safe flying limit) show a similar pattern
one day in every eleven (Fig. 14 and Table 7). However, as with ash, the gas hazard is strongly influenced by wind conditions, and the greatest hazard, in terms of the prob-ability that SO2concentrations in any one day will exceed
the EC threshold of > 125 μg/m3, can be found to the south at Akrotiri, with an approximately 5 % probability during the 200 tons/day scenario and 25 % during the 800 tons/day scenario. The lowest hazard is to the north at Oia (<2 %) (Fig. 14). The two emission scenarios show sig-nificantly different probabilities more than 4 km from the vent (i.e. all sites except Thera and the Port), particularly for exposure to gas concentrations > 125 μg/m3. This
provides further impetus for collecting measurements that
can constrain SO2 flux estimates in the event of an
eruption. More studies are required to see what effect a stronger plume than that simulated here would have for the hazard at each of the key sites.
Conclusions and emergency management implications
Here we have summarised the main outcomes of two parallel coordinated investigations, which aimed to pro-vide scenario-based probabilistic ash and gas hazard as-sessments for Santorini volcano during the unrest of Fig. 13Exceedance probability curves for VP15ash concentrations at the key nine sites, as computed by VOL-CALPUFF for individual plume
heights within the Santorini Weak case for the mostly likely eruption scenario. The WHO daily threshold for good air quality (50μg/m3) is shown
by the vertical line. Note the maximum value of 0.2 on the y axis and that ash loads are shown on a base 10 logarithm scale
Table 7Mean percentage of days (in a two year period of degassing activity) that SO2concentrations exceed air quality guidelines and standards, given 200 tons/day and 800 tons/day emission scenarios
200 tons SO2/day 800 tons SO2/day
WHO limits: WHO AQG - 20μgm−3 EC AQG–125μgm−3 WHO AQG - 20μgm−3 EC AQG–125μgm−3
Oia 6 0.3 8 2
Thera (Fira) 16 4 17 9
Port Athinos 20 3 20 6
Airport 15 0.4 22 5
Pyrgos 17 0.8 22 10
Kamari 14 0.3 21 4
Perissa 13 0.1 21 3
Akrotiri 37 4 43 23
Therassia 4 0.3 5 1
The lower threshold (20μg/m3
) represents Air Quality Guidelines (AQG) stated by the World Health Organisation, below which air quality is deemed to be good, and the upper threshold (125μg/m3
2011–2012. The studies were carried out within a short timeframe and in the face of significant uncertainty in order to inform emergency management and planning for a future eruption. As such, they exemplify a rapid emergency hazard assessment undertaken in an emer-gency to provide a first-order indication of likely hazard.
The results of the two independent emergency studies both confirm that ash and gas hazard is likely to be of
concern if an eruption of Santorini occurs. That the studies were carried out independently and were of broad agreement strengthens our confidence in the haz-ard outputs. Fixed plume height exceedance probability maps and curves of ash loading and airborne ash were found to represent the more useful tool as they give an indication of hazard, and therefore required manage-ment actions, associated with individual scenarios. Ash
0 50 100 150 200 250
0.0
0.1
0.2
0.3
0.4
0.5
SO2Concentration(µg m−3)
Daily e
xceedance probability
Thera: 200 tons SO2per day
EC Air Quality Standard(125µg m−3) WHO Air Quality Guidline(20µg m−3)
0 50 100 150 200 250
0.0
0.1
0.2
0.3
0.4
0.5
SO2Concentration(µg m−3)
Daily e
xceedance probability
Thera: 800 tons SO2per day
EC Air Quality Standard(125µg m−3) WHO Air Quality Guidline(20µg m−3)
0 50 100 150 200 250
0.0
0
.1
0.2
0.3
0.4
0.5
SO2Concentration(µg m−3)
Daily e
xceedance probability
Akrotiri: 200 tons SO2per day
EC Air Quality Standard 125(µg m−3) WHO Air Quality Guidline 20(µg m−3)
0 50 100 150 200 250
0.0
0
.1
0.2
0.3
0.4
0.5
SO2Concentration(µg m−3)
Daily e
xceedance probability
Akrotiri: 800 tons SO2per day
EC Air Quality Standard(125µg m−3) WHO Air Quality Guidline(20µg m−3)
0 50 100 150 200 250
0.0
0
.1
0.2
0
.3
0.4
0
.5
SO2Concentration(µg m−3)
Daily e
xceedance probability
Oia: 200 tons SO2per day
EC Air Quality Standard 125(µg m−3) WHO Air Quality Guidline 20(µg m−3)
0 50 100 150 200 250
0.0
0
.1
0.2
0
.3
0.4
0
.5
SO2Concentration(µg m−3)
Daily e
xceedance probability
Oia: 800 tons SO2per day
EC Air Quality Standard 125(µg m−3) WHO Air Quality Guidline 20(µg m−3)
Fig. 14Daily median exceedance probability curves (shaded areas represent the interval between the 0.05 and 0.95 probability of exceedance,
based on sampling 100 two-year simulations) for SO2gas concentration at Thera (upper), Akrotiri (middle) and Oia (lower) as computed by the
AERMOD model. Scenarios of 200 tons SO2/day (left) and 800 tons SO2/day (right) are shown as are the EC and WHO air quality thresholds for
dangerous (orange dashed line: 125μg/m3) and reduced (blue dashed line: 20
μg/m3) air quality, respectively. Note the maximum value of 0.5 on
and gas hazards are relatively high at key population centres in the south and east such as Thera and Pyrgos, and at transport hubs, notably the Port and Airport, principally as a consequence of the dominant wind di-rections. However, the level of hazard is also influenced by the intensity of the event, the altitude over which the volcanic material is released, distance from the vent and the occurrence of precipitation. The north of the island has much lower ash and gas hazard, and therefore is the logical place to develop emergency services, such as a volcano observatory, civil defence headquarters and medical facilities. For the most likely eruption scenario (i.e. long-duration and intermittent ash production from weak plumes), ash loading is expected to be too small for roof collapse to be a threat. However, ash and gas will be an intermittent threat to air quality, critical infra-structure and aviation.
For the first time, probability maps of aerial ash con-centration have been created for Santorini. Suspended ash levels in a most likely weak plume scenario are cal-culated to be at levels likely to be of concern for the avi-ation industry, it seems probable that the Airport will be affected for some ash events and also that operations at the Port may be disrupted. Volcanic ash plumes will be persistent and largely unpredictable so that cancellation or diverting of flights and temporary grounding of air-craft may happen more frequently than actual ash con-centrations may require. In particular, disruption of international flights and the risk of adverse impacts for cruise ships anchoring in the southern and eastern por-tions of the caldera during the summer months, e.g. through passenger respiratory issues or corrosion to paintwork, has large potential economic impact for the important tourism industry. Modelled ash and gas con-centrations exceeded current World Health Organisation thresholds for safe air quality standards more than once a week (15 to 20 %). People may be affected for periods of hours to days and such conditions will occur repeat-edly during an eruption. This supports historic observa-tions of health issues associated with the 1866 to 1870 eruption of Santorini. However, potentially harmful fluc-tuations in gas or ash emissions, wind directions and/or resuspension of ash by wind are not captured in this modelling and health advice should be taken from med-ical experts. Adequate supplies of dust masks are recom-mended for citizens and tourists and regular monitoring of the air quality (ash and gas concentrations) during the eruption is advised. The combination of fine ash and gas with dry, hot or windy weather may also require further precautions to be undertaken, such as partial or full evacuation. In addition to the health impacts of fine ash exposure, agriculture is likely to be adversely affected by fine ash and acid rain, especially in the growing seasons of spring and early summer.
The largest considered sub-Plinian eruption is ex-pected to cause significant disruption and hazards but to be relatively short-lived. The shift in wind directions to-wards the east with increasing altitude means that, in particular, the Port is subject to high hazard (>60 % probability of loads exceeding 10 kg/m2) and there is a possibility of roof collapse for weaker structures in the east (Thera: 10 % to 15 % probability of loads exceeding 200 kg/m2), but also the south of the island (Akrotiri: 15 % to 20 % probability).
The calculations in this assessment proved useful in highlighting areas that would benefit from further data and/or study in preparation for a future eruption. How-ever, they should be regarded as preliminary and with large uncertainties. One of the key limitations in develop-ing the stochastic models presented here was in derivdevelop-ing reliable estimates of model input parameters given uncer-tain and few data, and with limited time. The ash and gas hazard assessment presented here should therefore be used as a starting point for a refined assessment, to be undertaken prior to another period of unrest or a future eruption. Potential improvements include further investi-gating historical eruption accounts and geological data at Santorini and analogous volcanoes to improve model in-put parameters such as grain size distributions, column height estimates or characterisation of eruption time-series as a Poisson point process. A more accurate de-scription of the source plume dynamics should also be obtained, mostly in terms of vertical mass distribution and wind effects on the plume. Ash thresholds appropriate to an eruption crisis on Santorini should be refined through studies of exposed infrastructure, agriculture and build-ings and through discussion with health officials. In particular, assessing short fluctuations in ash and gas hazard will be important from a health perspective. In the event of a future eruption, it will be imperative to make measurements of ash and gas emissions, including time series of plume heights, SO2fluxes and systematic
sampling of the ash, supported by characterisation of its properties, to support future hazard assessments at Santorini and elsewhere.