R E S E A R C H
Open Access
Training in crisis communication and volcanic
eruption forecasting: design and evaluation of
an authentic role-play simulation
Jacqueline Dohaney
1,3*, Erik Brogt
1,2, Ben Kennedy
1,3, Thomas M Wilson
1,3and Jan M Lindsay
4Abstract
We present an interactive, immersive, authentic role-play simulation designed to teach tertiary geoscience students in New Zealand to forecast and mitigate a volcanic crisis. Half of the participating group (i.e., the Geoscience Team) focuses on interpreting real volcano monitoring data (e.g., seismographs, gas output etc.) while the other half of the group (i.e., the Emergency Management Team) forecasts and manages likely impacts, and communicates emergency response decisions and advice to local communities. These authentic learning experiences were aimed at enhancing upper-year undergraduate students’transferable and geologic reasoning skills. An important goal of the simulation was specifically to improve students’science communication through interdisciplinary team discussions, jointly prepared, and delivered media releases, and real-time, high-pressure, press conferences.
By playing roles, students experienced the specific responsibilities of a professional within authentic organisational structures. A qualitative, design-based educational research study was carried out to assess the overall student experience and self-reported learning of skills. A pilot and four subsequent iterations were investigated.
Results from this study indicate that students found these role-plays to be a highly challenging and engaging learning experience and reported improved skills. Data from classroom observations and interviews indicate that the students valued the authenticity and challenging nature of the role-play although personal experiences and team dynamics (within, and between the teams) varied depending on the students’background, preparedness, and personality. During early iterations, observation and interviews from students and instructors indicate that some of the goals of the simulation were not fully achieved due to: A) lack of preparedness, B) insufficient time to respond appropriately, C) appropriateness of roles and team structure, and D) poor communication skills. Small modifications to the design of Iterations 3 and 4 showed an overall improvement in the students’skills and goals being reached.
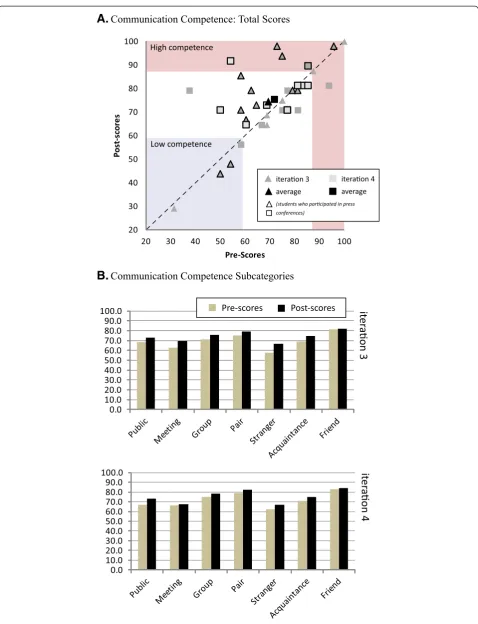
A communication skills instrument (SPCC) was used to measure self-reported pre- and post- communication competence in the last two iterations. Results showed that this instrument recorded positive shifts in all categories of self-perceived abilities, the largest shifts seen in students who participated in press conferences. Future research will be aimed at adapting this curricula to new volcanic and earthquake scenarios.
Keywords:The volcanic hazards simulation; Education; Role-play; Simulation; Volcanic hazards; Emergency management; Communication competence; Risk communication
* Correspondence:[email protected] 1
Geoscience Education Research Group, The University of Canterbury, Christchurch, New Zealand
3
Department of Geological Sciences, The University of Canterbury, Christchurch, New Zealand
Full list of author information is available at the end of the article
Introduction
During natural hazards crises, geoscientists and emer-gency managers work together to assess the scientific, commercial, environmental, political and cultural interests of their community (Fiske 1984; Voight 1990). Events such as the 1985 Nevada Del Ruiz lahar (Sigurdsson and Carey 1986), the 1991–1992 eruptions of Pinatubo (e.g., Tayag et al. 1996), ash impacts of the 2010 Eyjafjallajökull, Iceland eruptions (Harris et al. 2012) and the 2009 L’Aquila Earthquake (Jordan et al. 2011) highlight the difficult and crucial role that scientists play in disaster
communication and mitigation. Effective communication
is important during volcanic crises (IAVCEI Subcommit-tee for Crisis Protocols 1999; Haynes et al. 2007) and has been identified as a key disaster risk reduction practice (a.k.a., skill or competency) (Integrated Research on Disaster Risk (IRDR) 2011).
The geoscience and engineering community have long recognized the deficit of quality teamwork and commu-nication skills in their graduates (Dannels 2002; Heath 2000; 2003; Ireton et al. 1996; McMasters and Matsch 1996; Sageev and Romanowski 2001; Seat et al. 2001). These competency gaps in geoscience and engineering students specifically deal with information-sharing, cooper-ation, as well as ethical decision-making and behaviour
(Meier et al. 2000). To acquire and perfect these skills, re-search suggests students need to practice them in au-thentic scenarios (Cox et al. 2012).
In this paper, we report on and discuss the iterative de-sign of the Volcanic Hazards Simulation (i.e., an authentic, scenario-based role-play simulation) which was designed with the explicit purpose of teaching the skills and con-cepts necessary to predict and mitigate a volcanic eruption (Table 1). Our research aims focused on the evaluation of the simulation using a design-based research method (Barab and Squire 2004; Edelson 2002; Sandoval and Bell 2004). Design-based research provides a flexible, inter-connected, complex line of inquiry that is required to understand the environment, input, social dynamics and outputs of complex learning activities (Brown 1992). The design method is guided by theoretical and practical con-siderations and supported by student and instructor feedback in order to develop a learning activity which challenges students’knowledge and skills, but does not overwhelm them to the point of failure.
Background
The effectiveness of role-play and simulation for learning has been reported in a number of studies (e.g., DeNeve and Heppner 1997; van Ments 1999). They have been
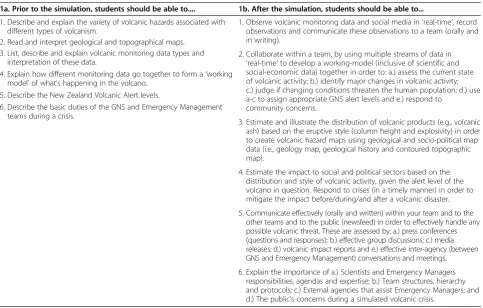
Table 1 Learning Goals of the Volcanic Hazards Simulation
1a. Prior to the simulation, students should be able to.... 1b. After the simulation, students should be able to...
1. Describe and explain the variety of volcanic hazards associated with different types of volcanism.
1. Observe volcanic monitoring data and social media in‘real-time’, record observations and communicate these observations to a team (orally and in writing).
2. Read and interpret geological and topographical maps.
2. Collaborate within a team, by using multiple streams of data in
‘real-time’to develop a working-model (inclusive of scientific and social-economic data) together in order to: a.) assess the current state of volcanic activity; b.) identify major changes in volcanic activity; c.) judge if changing conditions threaten the human population; d.) use a-c to assign appropriate GNS alert levels and e.) respond to
community concerns. 3. List, describe and explain volcanic monitoring data types and
interpretation of these data.
3. Estimate and illustrate the distribution of volcanic products (e.g., volcanic ash) based on the eruptive style (column height and explosivity) in order to create volcanic hazard maps using geological and socio-political map data (i.e., geology map, geological history and contoured topographic map).
4. Explain how different monitoring data go together to form a‘working model’of what’s happening in the volcano.
4. Estimate the impact to social and political sectors based on the distribution and style of volcanic activity, given the alert level of the volcano in question. Respond to crises (in a timely manner) in order to mitigate the impact before/during/and after a volcanic disaster. 5. Describe the New Zealand Volcanic Alert levels.
5. Communicate effectively (orally and written) within your team and to the other teams and to the public (newsfeed) in order to effectively handle any possible volcanic threat. These are assessed by: a.) press conferences (questions and responses); b.) effective group discussions; c.) media releases; d.) volcanic impact reports and e.) effective inter-agency (between GNS and Emergency Management) conversations and meetings. 6. Describe the basic duties of the GNS and Emergency Management
teams during a crisis.
found to require more active participation from students than traditional, lecture-based teaching techniques and intend to teach practical and theoretical skills that are transferable to different future situations (e.g., Lunce 2006; Roth and Roychoudhury 1993). In this section, we define role-play, simulation, previous studies and outline the basic design of the Volcanic Hazards Simulation.
Previous studies
We define‘simulation’as a learning experience that occurs within an imaginary or virtual system or world (van Ments 1999) and‘role-play’as the importance and interactivity of roles in pre-defined scenarios (Errington 2011; Errington 1997). Research shows that role-play and simulation im-prove student attitudes towards learning (DeNeve and Heppner 1997; Livingstone 1999; Shearer and Davidhizar 2003) and interpersonal interactions (Blake 1987; van Ments 1999; Shearer and Davidhizar 2003), generic trans-ferable skills (problem-solving and decision-making skills (Errington 1997; Barclay et al. 2011); communication skills (Bales 1976; Hales and Cashman 2008; van Ments 1999); and teamwork skills (Maddrell 1994; Harpp and Sweeney 2002)), as well as discipline-specific knowledge (DeNeve and Heppner 1997; Livingstone 1999) and volcanic eruption forecasting skills (Hales and Cashman 2008; Harpp and Sweeney 2002).
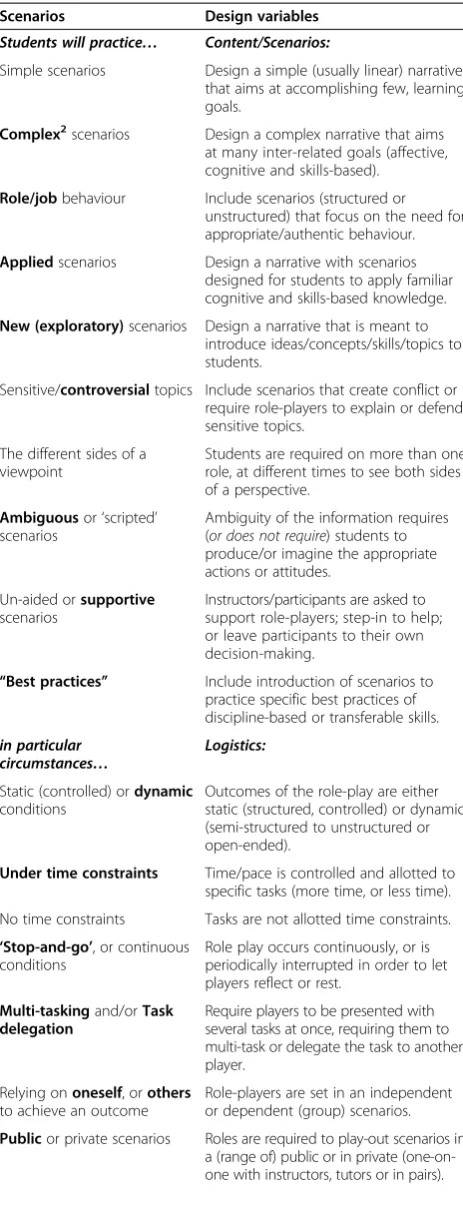
This simulation is a capstone activity emulating and integrating pedagogical elements (Table 2) from many of the above studies. The research here shows how a design-based approach can be used to iteratively im-prove and assess a simulation where student learning is a product of many elements. Table 2 lists the scenarios, settings, conditions and accompanying design variables that can be used in any role-play and the italicized parts of table were all identified as being relevant in the design of the Volcanic Hazards Simulation.
Table 2 Role-play scenarios1and associated design variables
Scenarios Design variables
Students will practice… Content/Scenarios:
Simple scenarios Design a simple (usually linear) narrative that aims at accomplishing few, learning goals.
Complex2scenarios Design a complex narrative that aims at many inter-related goals (affective, cognitive and skills-based).
Role/jobbehaviour Include scenarios (structured or unstructured) that focus on the need for appropriate/authentic behaviour.
Appliedscenarios Design a narrative with scenarios designed for students to apply familiar cognitive and skills-based knowledge.
New (exploratory)scenarios Design a narrative that is meant to introduce ideas/concepts/skills/topics to students.
Sensitive/controversialtopics Include scenarios that create conflict or require role-players to explain or defend sensitive topics.
The different sides of a viewpoint
Students are required on more than one role, at different times to see both sides of a perspective.
Ambiguousor‘scripted’ scenarios
Ambiguity of the information requires (or does not require) students to produce/or imagine the appropriate actions or attitudes.
Un-aided orsupportive
scenarios
Instructors/participants are asked to support role-players; step-in to help; or leave participants to their own decision-making.
“Best practices” Include introduction of scenarios to practice specific best practices of discipline-based or transferable skills.
in particular circumstances…
Logistics:
Static (controlled) ordynamic
conditions
Outcomes of the role-play are either static (structured, controlled) or dynamic (semi-structured to unstructured or open-ended).
Under time constraints Time/pace is controlled and allotted to specific tasks (more time, or less time).
No time constraints Tasks are not allotted time constraints.
‘Stop-and-go’, or continuous conditions
Role play occurs continuously, or is periodically interrupted in order to let players reflect or rest.
Multi-taskingand/orTask delegation
Require players to be presented with several tasks at once, requiring them to multi-task or delegate the task to another player.
Relying ononeself, orothers
to achieve an outcome
Role-players are set in an independent or dependent (group) scenarios.
Publicor private scenarios Roles are required to play-out scenarios in a (range of) public or in private (one-on-one with instructors, tutors or in pairs).
Table 2 Role-play scenarios1and associated design
variables(Continued)
while playing (in)… Roles:
‘Real-life’roles Include roles in the simulation that values, agenda and responsibilities are realistic.
Themselves Include roles that purpose is to act out personally-driven agendas, attitudes or emotions.
‘Real-life’Role hierarchies Include roles within an organized structure that is near-real life.
Inter-Role interactions Include roles and scenarios that focus on informal and formal interactions and behavior.
1
Compiled from Van Ments (1999) and Blake (1987) with additions from the results of this study.
2
Basic design of the volcanic hazards simulation
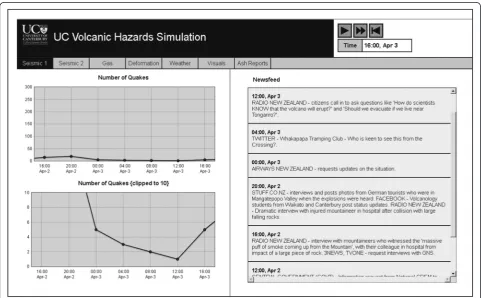
Our original design of the simulation was based on Harpp and Sweeney’s (2002) Eruption Simulation. Multiple vol-canic monitoring datasets were researched and‘streamed’ in real-time and were presented in several labeled tabs on a custom-designed website interface (Figure 1). These data sets included: seismic activity, ground deformation, visual surveillance of eruptions (including imagery and auditory data), ash distribution and thickness, volcanic gases (CO2 and SO2), weather conditions, and social media. We adapted the Eruption Simulation to focus more specifically on the roles, protocols and challenges from an authentic New Zealand geoscience and emergency management perspective. Our understanding of these roles and protocols was obtained via interviews and consultation with volcanic hazards professionals at the Institute of Geological and Nu-clear Sciences (GNS Science) and the Civil Defence and Emergency Management sector (CDEM) of New Zealand.
It should be noted here that emergency management protocols, roles and responsibilities of scientists, cultural and societal expectations, and other important aspects of disaster management are unique to each nation and set-ting. This simulation models the New Zealand organisa-tional structure and responsibilities, largely because the students who participate are potential future employees.
A review of the New Zealand emergency management paradigm can be found in Britton and Clark (2000) and Hudson-Doyle et al., (this issue).
The Tongariro Volcanic Complex (e.g., Cole 1978; Hobden et al. 1999) was chosen as the host-volcano as it is a primary field site for the student participants enrolled in a 4th year physical volcanology field trip (see Table 3: Pilot, Iteration 2 and 3). As modelled in Eruption Simu-lation (Harpp and Sweeney 2002), the volcanic activity progresses from a quiescent stage, through small eruptions (i.e., ‘unrest’) concluding with a very large event, based on the 1991 Mt Pinatubo eruptions (e.g., Wolfe and Hoblitt 1996). This eruption scenario was chosen because there was existing volcanic monitoring data available for streaming the data ‘real-time’, it pro-gresses through forecasting stages (which can be denoted by precursors that students could identify), and results
in a ‘blockbuster’ climax (which is exciting to the
participants).
The simulation consists of a series of complex, intercon-nected team tasks. One team focuses on recording, pro-cessing and interpreting the monitoring data mentioned above, while the other manages and mitigates the effects of volcanic eruptions on local communities. This requires effective use of the students’cognitive skills (Bloom et al.
1956; Isaacs 1996; Lord and Baviskar 2007), and effective communication within the teams and between the two teams and to the local communities. For example, one
task might require the students to weigh and judge the
impacts of a volcanic event (e.g., an ash-producing eruption, which deposits ash onto road networks), andevaluatewhich impact(s) are of greater priority. The simulation is typically run in a single 4 to 6-hour session with between 15 and 40 students. At various stages during the simulation, injects are placed to trigger group tasks. The target audience for the simulation is upper-year undergraduates (300-level) and postgraduates (400-level and Masters) geoscience and hazards management students. The simulation is assessed slightly differently in each course within which it is offered; typically it comprises 5-10% of the final course mark. Suggestions for assessment can be found in the Instruction manual (Files can be found on the VHUB website; https://vhub.org/resources/3395).
Over a three year period from 2010 to 2012 we have developed and adapted the simulation in an iterative process guided by a design-based method and educa-tional theory and practices to achieve the desired learn-ing goals (Table 1).
Methods I. Theoretical framework
The design of the simulation was guided by three main areas of science education and educational psychology research:
1. Motivational theories, and in particular the concept of subjective task value (e.g., Eccles and Wigfield 2002; Eccles2005; Ryan and Deci2000);
2. Cognitive load theory (e.g., Chandler and Sweller 1991; Sweller et al.1998);
3. Team and group behaviours (e.g., Michaelsen and Sweet2008; Turner2014) and organisational theory (e.g., Argote et al.2000)
In the later iterations of the simulation we also focused on the development and assessment of communication skills and utilised research from the risk communication literature to guide our design process (e.g., Morgan et al. 2002; Todesco 2012; Tully 2007).
Motivation
An educational psychology concept relevant to our design is the theory ofmotivation. At its simplest level, motiv-ation is to strive for something. An individual’s motiva-tions in educational endeavours primarily stem from feelings of recognition, responsibility, personal growth, au-tonomy and overcoming challenges (Beard 1972). Situated learning experiences include authentic contexts, activities, multiple roles and perspectives, supportive collaborative construction of knowledge leading to motivating and ef-fective means of teaching complex tasks (Herrington and Oliver 1995). If the learning activity is realistic and the tasks are perceived as personally useful, each student will weigh and associate value (consciously or subconsciously) in participating as part of his or her long term academic and professional development (Eccles and Wigfield 2002; Eccles 2005). The design components that were most con-cerned with aspects of motivation were the perceived challenge and authenticity of the tasks, roles and social interactions.
Cognitive load
The theory of how an individual manages a set of tasks in their working memory is referred to as cognitive load theory (Chandler and Sweller 1991; Sweller 2003). Re-search shows that when students cope with learning tasks many intrinsic and extrinsic factors affect motiv-ation, perceptions and performance (Eccles and Wigfield 2002; Matsumoto and Sanders 1988). Characteristics of the task itself such as the level of complexity (van Merriënboer et al. 2006; Kirschner et al. 2009), perceived
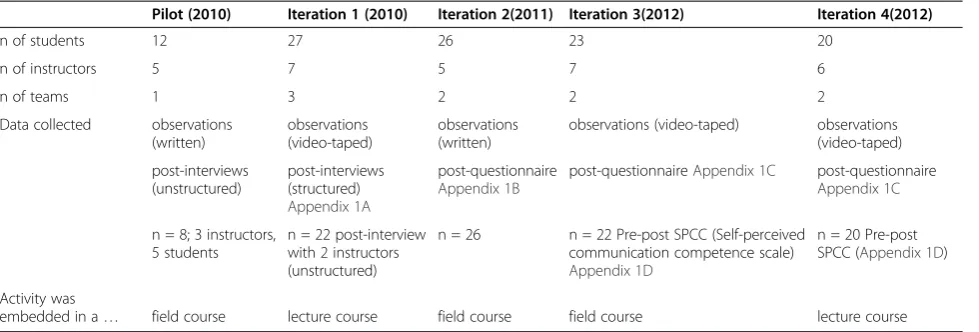
Table 3 Volcanic hazards simulation data collection summary
Pilot (2010) Iteration 1 (2010) Iteration 2(2011) Iteration 3(2012) Iteration 4(2012)
n of students 12 27 26 23 20
n of instructors 5 7 5 7 6
n of teams 1 3 2 2 2
Data collected observations (written)
observations (video-taped)
observations (written)
observations (video-taped) observations (video-taped)
post-interviews (unstructured)
post-interviews (structured)
Appendix 1A
post-questionnaire
Appendix 1B
post-questionnaireAppendix 1C post-questionnaire
Appendix 1C
n = 8; 3 instructors, 5 students
n = 22 post-interview with 2 instructors (unstructured)
n = 26 n = 22 Pre-post SPCC (Self-perceived communication competence scale)
Appendix 1D
n = 20 Pre-post SPCC (Appendix 1D)
Activity was
difficulty (Kuhl and Blankenship 1979; Slade and Rush 1991), length of the task (Peterson and Peterson, 1959) and task interconnectivity (van Merriënboer et al. 2006) all affect the cognitive load of a given learning activity. Authentic, complex learning tasks are often over-whelming for novice learners (i.e., students who are learning a new concept or skill; van Merriënboer and Sweller 2005), as they commonly require the learner to incorporate multiple tasks which are interconnected. The design components of the simulation that were most concerned with aspects of cognitive load were those developed to manage the pace of the simulation, and the preparation of students so that the tasks presented were not overwhelming.
Organisational behaviour
Another major influence in our design stemmed from management and organisational studies involving team-based learning and performance. As a complex simulation, the workings of the learning activity are heavily influenced by the behaviour of individuals within an interactive team environment. There are several key interdependent ele-ments that an effective team must have: 1) team members must be aware of and share task and value-based goals (Chou et al. 2008); 2) team members must be worthy of trust (trustworthiness) and show trust for other members (trustfulness) (Webber 2002; Chou et al. 2008); and 3) people need to feel satisfied by the other members work (Chou et al. 2008) which results in a joint potency or belief in the team (Campion et al. 1996). Negative team behav-iour arises when there is a substantial rift in any of the above elements. The design components concerned with team dynamics were preparing students for the teamwork skills needed (through preparation activities), structuring, and clarifying the tasks presented so that students could tackle the challenge in a manageable way.
Iterative design research–identifying and manipulating design variables
Design-based research (‘design experiment’ or ‘ develop-ment research’) is theoretically framed, empirical research of learning and teaching based on particular designs for instruction (Barab and Squire 2004; Sandoval and Bell 2004; Edelson 2002). Design-based research pro-vides a flexible, interconnected, complex line of inquiry that is required to understand the environment, input, social dynamics and outputs of the simulation (Brown
1992) and allows the participants’ behaviour (actions,
decisions) and their perceptions of these behaviours to be incorporated into the development of the learning activity (e.g., Barab and Squire 2004). We adopted this
approach, as the simulation’s design was new and its
effects were untested.
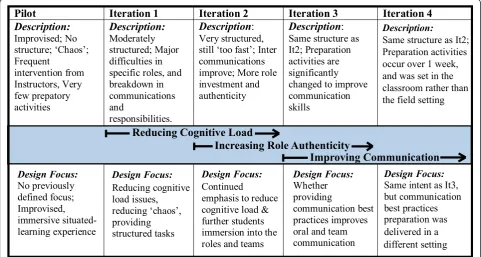
Like other design-based projects, the simulation aimed to achieve multiple goals and the evaluation research component of this project was aimed at enabling students to better achieve the intended learning goals (Table 1). Because of the complex nature of the simulation, each iterative design modification decision was a comprom-ise between the scenario authenticity and the learning goals of the simulation. Figure 2 shows the evolution of the design foci throughout the different iterations of the simulation.
Communication competence
Research shows that the use of methods such as role-playing, modeling, coaching, rehearsal, reinforcement and feedback, enable individuals to improve their communica-tion competence (Richmond et al. 2013). Feedback, mod-eling, and rehearsal are all integral to the simulation and it became increasingly clear that communication competence was vital to the success of the simulation. Our understand-ing of communication competence and communication apprehension was guided by the work of McCroskey (e.g., McCroskey et al. 1977; McCroskey 1982). McCroskey and McCroskey (1988) investigated communication compe-tence through self-reported evaluation of one’s ability to communicate (self-perceived communication competence). Communication draws on content knowledge and inter-personal skills to convey information appropriately. They developed a self-perceived communication competence scale (SPCC) to obtain information concerning how compe-tent people feel when communicating (McCroskey and McCroskey 1988). The instrument considers several dimen-sions of communication: communication contexts (public, meeting, group, and dyad (or pair)) and receivers of the communication (strangers, acquaintances, and friends). Previous research has shown that a person’sself-perceived communication competence is substantially correlated to
and a reliable measure of actualcommunication
compe-tence (McCroskey and McCroskey 1988).
Methods II. Evaluation of the volcanic hazards simulation
The many different (interacting) variables at play in the simulation required careful data collection and analysis. We opted for a mixed-methods approach, involving both qualitative and quantitative data and analysis, to generate a rich data set to minimise the effects of confounds and biases in any one data collection method.
Study participants
of their curricula. They were mixed cohorts of American study-abroad students (Pilot, Iteration 2, 3) and New
Zealand students (Iteration 1–4) who attended the
University of Canterbury. Students ranged in age, gen-der, nationality, race and geosciences background. All students were encouraged to participate, but were told explicitly that the study was confidential and that if they opted not to participate, they would not be nega-tively affected in any way. Instructors and facilitators of the simulation were study participants in the sense that they provided data through formal interviews as well as informal discussions with the research team. Informed consent was obtained from all participants in line with the University of Canterbury Human Ethics protocols.
Data collection
The data collection is summarised in Table 2. In order to ascertain if our design was effective, we collected and analysed student feedback (through interviews and ques-tionnaires) and behaviour (self-reported through feedback and questionnaires and observed by the researchers). This allowed us to characterise the successes or failure of our design which was determined through observed individual and team positive behaviours (sophisticated decision-making and effective communication and teamwork strategies) and self-reported indications of engagement, enjoyment and changed perceptions. All iterations
included a short demographic questionnaire which asked students basic questions about their nationality, level of study, gender, age, and geology background.
Observations
We collected approximately 37 hours of observation foot-age including 17 hours of simulation activities and 20 hours of pre-simulation activities such as lectures and group exercises. Data collection was overt (Jorgensen 1989): Observers were introduced to the students and their purpose for being present was explained. Almost all of the iterations were done in a multi-room setting and required multiple observers. Observation summary notes (explained in more detail, below) were taken in all iterations, with increments of approximately 2 minute
‘checks’. Written observations were relied upon for the Pilot and Iteration 2 (as the video files were damaged dur-ing the Feb 22, 2011 Christchurch earthquake).
Observations of the Pilot were aimed at reviewing stu-dent and instructor behaviour with regard to the core ele-ments of the simulation pedagogy. Several questions were set out that would help us characterise the learning experience: 1. What is the simulation trying to achieve? 2. What are the individual students’behaviours? 3. How are the students behaving as a team? 4. How are the instruc-tors behaving? 5. Are they supporting the learning goals
that were set out? 6. What elements support learning and what elements may be detrimental to learning?
Observations of the remaining iterations were more fo-cused on specific design variables: 1. How does the pace of the tasks and data streaming affect the success of the simulation? 2. Are students prepared for the tasks pre-sented to them? 3. Does the use of role-play positively affect the student’s learning experience and ensure a suc-cessful simulation? 4. Does the use and assignment of the roles and structure of the teams ensure a successful simula-tion? Are more/different roles needed? 5. How can the stu-dent’s teamwork and communication skills be characterised? For example: What elements of the simulation create learn-ing opportunities for teamwork and communication? 6. Do the instructors support learning in these new designs?
Interviews
Due to the exploratory nature of the Pilot, we used infor-mal, unstructured interviews immediately following the simulation to gather reflective experiences from both the instructors and students. The interviews were in a focus group format and some of the interviews were conducted with the instructors present with the students. The two in-terviews ranged from 10 to 25 minutes. There were sev-eral open questions posed to the participants: 1. What do you think went well? 2. What did not go so well? 3. What can we improve on in the future? and 4. What would you keep the same? Unscripted follow-up questions were used to probe valuable lines of inquiry.
In Iteration 1 we used semi-structured one-on-one in-terviews (see Appendix 1A). The interview questions were set out prior to the simulation. The topics in the interview were aimed at deriving a student’s character-isation of their experience (in their team, and assigned role). The interviews (n = 22) were conducted by two re-searchers (Dohaney and Hearne). All of the interviews were audio-recorded and transcribed later for analysis.
There were two feedback questionnaires designed for this study. The questionnaires (refer to Appendix 1B for Iteration 2 questionnaire (n = 26); and refer to Appendix 1C for Iteration 3 (n = 22) and 4 (n = 20)) were adminis-tered directly following the simulation activities. Students were given unlimited time to fill out the questionnaires. The questions probed specific aspects of the pedagogy. Our focus in Iteration 2 was to understand the effect of the pace, the nature of role-play and the team structures.
Our focus in the questionnaires for Iteration 3 and 4 was to gather final feedback and probe into the students’ per-ceptions of how they communicated within the simulation.
Communication assessment
We used McCroskey and McCroskey’s (1988) self-perceived communication competence instrument (12-item question-naire; Appendix 1D) to develop baseline efficacies of
students communication, and report whether there were changes to their competence after participating in the simu-lation. The simulation targeted and included examples of the different communication situations (public, meetings), aside from interpersonal communication (dyad) so we could investigate how successful each element was in our design.
Data analysis
Written observation summaries of each iteration were inde-pendently transcribed, collated, and analysed for specific lines of inquiry and themes. The primary goal was to docu-ment‘what happened’and assign a timeline to the student behaviours with accompanying perceived successes and fail-ures of individuals and the teams. These observations were then correlated to the interview and questionnaire data. The purpose of correlation is to match what we observed and how the students perceived those circumstances.
Analysis of the interviews focused on assessing overall student experiences and identifying quotations that were representative of the range and majority of perceptions and observed behaviour. Specifically, we aimed at charac-terising the design variables that influenced the overall success of the simulation and allowed students to achieve the primary learning goals.
In the Pilot, due to a low number of participants (n = 8), saturation (i.e., when data analysis reaches a point where no new themes or insights emerge; Bowen 2008; Corbin and Strauss 1990) was not achieved. However, based on experience with data from the successive iterations, we conclude that the feedback collected from the Pilot was likely a representative sample.
With a larger number of participants, Iteration 1 allowed us to explore the design and themes in more depth through interview data. Thematic and response saturation for these students was achieved through constant comparison of ori-ginal themes that emerged from the Pilot, to each subse-quent data set. In Iteration 1, analysis of the 22 interviews began by characterising and grouping the responses to each question posed; these were categorised based on the role of the student, their team and matched to their observed behaviour in the simulation. These results were later collated and compared to and combined with the post-questionnaire results from Iteration 2, 3, and 4). The subsequent iterations (2–4) themes were identified, sorted and further refined with questionnaires. Data saturation occurred for the specific themes (i.e., design variables), by probing specific qualities of the simulations design and the students’perceptions of their experiences.
efficacy (before and after the simulation) were explored. The small cohort numbers in Iterations 3 and 4 (n = 18 and 19, respectively) with differing treatments regarding communication meant that an effect size and t-test statis-tical analysis was not appropriate. Further study will allow us to capture communication-focused data from larger populations of students.
Results & discussion: evolution of the volcanic hazards simulation
In this section we thematically present our results and dis-cussion in a combined fashion. We do this for ease of reading as results and discussions from one iteration are relevant for other iterations. Excerpts indicate the iteration from which the data was derived and the role the re-spondent played. Note that excerpts are typical or majority responses.
Generally, student feedback on the simulation experi-ence illustrated that students valued its challenging na-ture and authenticity although their personal experience varied according to the roles they played and groups they worked with. One student recalled the benefits of the role-play itself:“I think it’s a really good simulation. I think you get put in a position to make super import-ant decisions and I think, with having all the different teams and having to communicate with them in other rooms. It really adds to the realistic aspects of it”. (Iteration 1, Group Controller).
Other students noted that they enjoyed taking on roles that were new to them, this allowed them to explore new topics and gain new perspectives:“…[this role] was dif-ferent and it opened my eyes to a difdif-ferent perspective” (Iteration 2, Ministry of Transport). Students reported an ability to see the bigger picture and how their role fit into it:“It was great for understanding how each small role is vital to the bigger picture understanding and manage-ment”(Iteration 2, Meteorologist).
From our observations and interviews, four key vari-ables were found to be crucial for the success of the simu-lation: 1. student pre-simulation preparation; 2. the pace of the simulation; 3. role assignment; and 4. effectiveness
of the students’ teamwork and communication skills
(Table 4). The following sections describe each of these variables, the theoretical underpinnings of the design, and the instructor and student data which supports improve-ment of the design to result in more successful simula-tions. A summary of the design research and supporting evidence is shown in Table 4.
Pre-simulation preparation Results
In Table 1A we identified several fundamental concepts and skills that students must bring with them into the simulation in order to effectively play their roles and
perform basic tasks included in the simulation. Because items 3–6 in Table 1A were not likely to be covered in previous geology courses, we anticipated this lack of knowledge and created preparatory activities (i.e., add-itional readings, lectures and exercises) for the Pilot to give students the necessary background. The main pre-paratory exercise was the Hazard Map Activity. Students worked on creating a detailed volcanic hazards map from the literature for the Tongariro Volcanic Complex. This activity was designed to give students the needed back-ground of the region, community, place names, landscape, and geologic history of the volcano. They were also re-quired to designate and explain hazard zones on their maps with relevance to (and introduction to) the New Zealand Volcanic Alert Levels (GeoNet 2014). In addition to the Hazards Map activity, students were given a short lecture with basic instructions on what to do during the simulation.
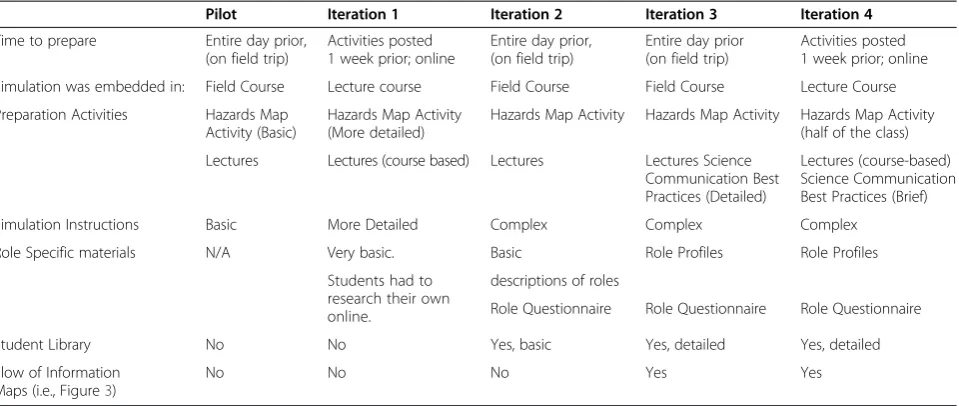
Feedback from instructors and students in the Pilot in-dicated that more‘background’was required to help stu-dents communicate better and perform the simulation tasks (e.g., Instructor quote, Table 4). As a result, the background lectures became more detailed. As the com-plexity of the role-play increased (Iterations 1–4), student feedback indicated the need for more preparation materials, in particular in relation to the roles and responsibilities:“I [would have liked] a better definition of the role expecta-tions beforehand, the simple descripexpecta-tions did not do much for me” (Iteration 1, Public Information Officer). This resulted in a set of additional preparation materials which accompany the simulation: the Student Library (contain-ing additional geology and emergency management back-ground readings) and Flow of Information Maps (see Figure 3), and Science Communication Best Practices
(see Section Improving Students’ Communication
Com-petence). Table 5 summarises the evolution of preparation activities in the simulation.
In Iteration 1, the students were assigned roles and were expected to research their job titles, organisation proto-cols, and media release writing using online resources (which we provided to them). As a result of providing preparation readings and instructive materials to the stu-dents, the preparation-related feedback from Iteration 1 improved from the Pilot. Examples of improvement in-cluded better quality and efficiency in the writing of media releases and general awareness of what the roles and teams were intended to do during the crisis.
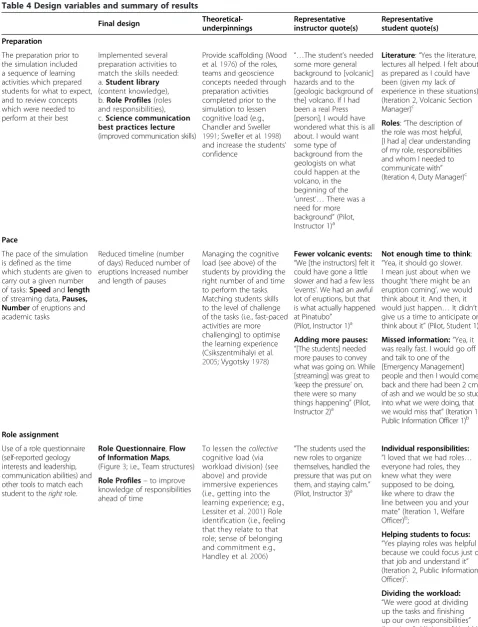
Table 4 Design variables and summary of results
Final design Theoretical-underpinnings Representativeinstructor quote(s) Representativestudent quote(s)
Preparation
The preparation prior to the simulation included a sequence of learning activities which prepared students for what to expect, and to review concepts which were needed to perform at their best
Implemented several preparation activities to match the skills needed: a.Student library
(content knowledge), b.Role Profiles(roles and responsibilities), c.Science communication best practices lecture
(improved communication skills)
Provide scaffolding (Wood et al.1976) of the roles, teams and geoscience concepts needed through preparation activities completed prior to the simulation to lessen cognitive load (e.g., Chandler and Sweller
1991; Sweller et al.1998) and increase the students’ confidence
“…The student’s needed some more general background to [volcanic] hazards and to the [geologic background of the] volcano. If I had been a real Press [person], I would have wondered what this is all about. I would want some type of background from the geologists on what could happen at the volcano, in the beginning of the
‘unrest’…There was a need for more background”(Pilot, Instructor 1)a
Literature:“Yes the literature, lectures all helped. I felt about as prepared as I could have been (given my lack of experience in these situations)” (Iteration 2, Volcanic Section Manager)c
Roles:“The description of the role was most helpful, [I had a] clear understanding of my role, responsibilities and whom I needed to communicate with” (Iteration 4, Duty Manager)c
Pace
The pace of the simulation is defined as the time which students are given to carry out a given number of tasks:Speedandlength
of streaming data,Pauses, Numberof eruptions and academic tasks
Reduced timeline (number of days) Reduced number of eruptions Increased number and length of pauses
Managing the cognitive load (see above) of the students by providing the right number of and time to perform the tasks. Matching students skills to the level of challenge of the tasks (i.e., fast-paced activities are more challenging) to optimise the learning experience (Csikszentmihalyi et al.
2005; Vygotsky1978)
Fewer volcanic events: “We [the instructors] felt it could have gone a little slower and had a few less
‘events’. We had an awful lot of eruptions, but that is what actually happened at Pinatubo”
(Pilot, Instructor 1)a
Not enough time to think:
“Yea, it should go slower. I mean just about when we thought‘there might be an eruption coming’, we would think about it. And then, it would just happen…It didn’t give us a time to anticipate or think about it”(Pilot, Student 1)b
Adding more pauses: “[The students] needed more pauses to convey what was going on. While [streaming] was great to
‘keep the pressure’on, there were so many things happening”(Pilot, Instructor 2)a
Missed information:“Yea, it was really fast. I would go off and talk to one of the [Emergency Management] people and then I would come back and there had been 2 cm of ash and we would be so stuck into what we were doing, that we would miss that”(Iteration 1, Public Information Officer 1)b
Role assignment
Use of a role questionnaire (self-reported geology interests and leadership, communication abilities) and other tools to match each student to therightrole.
Role Questionnaire,Flow of Information Maps, (Figure3; i.e., Team structures)
To lessen thecollective cognitive load (via workload division) (see above) and provide immersive experiences (i.e., getting into the learning experience; e.g., Lessiter et al.2001) Role identification (i.e., feeling that they relate to that role; sense of belonging and commitment e.g., Handley et al.2006)
“The students used the new roles to organize themselves, handled the pressure that was put on them, and staying calm.” (Pilot, Instructor 3)a
Individual responsibilities: “I loved that we had roles… everyone had roles, they knew what they were supposed to be doing, like where to draw the line between you and your mate”(Iteration 1, Welfare Officer)b;
Role Profiles–to improve knowledge of responsibilities ahead of time
Helping students to focus: “Yes playing roles was helpful because we could focus just on that job and understand it” (Iteration 2, Public Information Officer)c.
to which they report to, who they are responsible for, and the key competencies (i.e., skills) needed. One of the Iter-ation 4 students noted how the Role Profiles helped:“The description of the role was most helpful, [I had a] clear understanding of my role, responsibilities and whom I needed to communicate with”(Iteration 4, Duty Manager).
In order to improve preparedness and match the prepar-ation readings to the specific roles and responsibilities, we created a Student Library. Several students reported finding it helpful:“I think the literature was the most helpful because it provided us with the necessary background information for our roles” (Iteration 3, Department of Conservation). The other preparation activities (i.e., lectures and Hazards Map Activity) also helped students develop expectations for their roles and tasks:“I felt very prepared. All my readings and researching beforehand really helped as I then had a bet-ter understanding of the team dynamics and the science” (Iteration 3, Volcanology Section Manager).
In Iteration 2, the majority of students continued to exhibit specific and general lack of preparedness that af-fected their abilities to achieve the learning outcomes. For example, students were unaware of the importance and sensitivity of Alert Levels (i.e., the general conse-quences of raising and lowering Alert Levels) and some students could not perform the main tasks to which they were assigned (e.g., the Ash Specialist could not draw accurate ash maps and the Infrastructure Manager was not aware of the main transport conduits of the North Island of New Zealand). However, in Iterations 3 and 4,
by increasing the students’ prior knowledge through
preparation activities, we observed fewer examples of
cognitive overload. Students who did the preparatory ac-tivities reported feeling prepared in later iterations (e.g.,
“I felt very prepared. All my readings and researching
beforehand really helped as I then had a better
under-standing of the team dynamics and the science”
(Iter-ation 3, Volcanic Section Manager).
Discussion
In the early iterations of development, we observed that some students did not possess the content and skills-based knowledge needed for the simulation. Therefore, we in-ferred that preparation was a crucial aspect of the overall pedagogy, in supporting all of the learning goals. An effect-ive approach is to prepare students by scaffolding the discrete topics and skill sets prior to and during the simula-tion. Scaffolds include all devices or strategies that support
students’ learning (Rosenshine and Meister 1992; Wood
et al. 1976). The support enables a learner to reduce their cognitive loads and achieve their goals. Gradually, support can be reduced as students learn to cope with increased cognitive load (van Merriënboer et al. 2003). Preparation activities also served motivational purposes: to further im-prove a student’s self-efficacy (Schunk 1991) and to foster positive expectations before participating in the simulation.
Despite implementing the pre-simulation preparation ac-tivities, some of the students exhibited less geologic reason-ing and content knowledge. We observed that this poorer content knowledge inhibited sophisticated problem-solving and synthesis skills needed to support the team’s complex reasoning. In Iteration 4, this was evident when the team discussing possible outcomes of the volcanic unrest needed
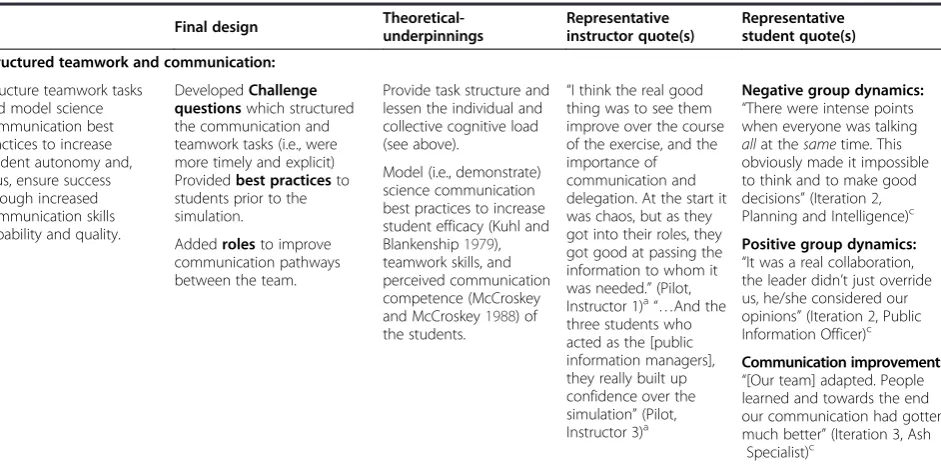
Table 4 Design variables and summary of results(Continued)
Final design Theoretical-underpinnings
Representative instructor quote(s)
Representative student quote(s)
Structured teamwork and communication:
Structure teamwork tasks and model science communication best practices to increase student autonomy and, thus, ensure success through increased communication skills capability and quality.
DevelopedChallenge questionswhich structured the communication and teamwork tasks (i.e., were more timely and explicit) Providedbest practicesto students prior to the simulation.
Provide task structure and lessen the individual and collective cognitive load (see above).
“I think the real good thing was to see them improve over the course of the exercise, and the importance of communication and delegation. At the start it was chaos, but as they got into their roles, they got good at passing the information to whom it was needed.”(Pilot, Instructor 1)a
“…And the three students who acted as the [public information managers], they really built up confidence over the simulation”(Pilot, Instructor 3)a
Negative group dynamics: “There were intense points when everyone was talking allat thesametime. This obviously made it impossible to think and to make good decisions”(Iteration 2, Planning and Intelligence)c
Addedrolesto improve communication pathways between the team.
Model (i.e., demonstrate) science communication best practices to increase student efficacy (Kuhl and Blankenship1979), teamwork skills, and perceived communication competence (McCroskey and McCroskey1988) of the students.
Positive group dynamics: “It was a real collaboration, the leader didn’t just override us, he/she considered our opinions”(Iteration 2, Public Information Officer)c
Communication improvement: “[Our team] adapted. People learned and towards the end our communication had gotten much better”(Iteration 3, Ash
Specialist)c
a
data derived from instructor interviews; b
from student interviews and focus groups; c
to look-up the definition of ‘Plinian’ (i.e., a classification term to describe a very large-scale eruption). The students’ lack of knowledge contributed to the team’s inability to cre-ate a working hypothesis of the volcanic activity and an in-structor was required to step in and help assist the group. In conclusion, the team’s combined reasoning skills are im-pacted by the level of preparation of some of the individual
students. This led us to more closely explore role assign-ment (Section Role Assignassign-ment).
The pace of the simulation Results
The Pilot was largely improvised with little structure (i.e., in roles, teams, tasks). The pace of the Pilot was
A.
B.
very quick, with a simulated day lasting about one mi-nute in actual time. The pace of the simulation was de-fined by the rate of the streaming data, the number and length of pauses from monitoring tasks, and the number of and spacing of events (e.g., volcanic eruptive events).
While it was our intention for the simulation to be fast-paced, we did not want it to be so fast as to inhibit students’ability to react to the scenarios.
There were many suggestions from students and instruc-tors on potential ways to decrease the pace and lessen the overwhelming nature of the experience. In the Pilot, the students interviewed said that the pace severely affected their decision-making and their abilities to react to the events occurring. During the Pilot, two ‘pauses’ were im-provised by the instructors allowing students to take more time to prepare and organise their thoughts and strategies in order to make comprehensive and measured decisions. For example, student-led working models of the volcano and evacuation plans require multiple datasets to be discussed, weighed, and scrutinised as a team and pre-sented to a critical audience during press conferences. These types of higher-level cognitive tasks require time and careful consideration, leading to well thought out decisions and actions. Never in any of the simulations observed, did a student or team make drastically wrong decisions.
Based on these observations and the feedback received we slowed the pace by reducing the number of events (from 30 to 26) and adding pauses (from 2 to 4) to allow students more time to make quality decisions and com-munications. However, even at a‘slower’pace, many other students continued to struggle to ‘follow-along’, causing them to miss important events. One student explained this:“Yea, it was really fast. I would go off and talk to one of the [Emergency Management] people and then I would
come back and there had been 2 cm of ash and we would be so stuck into what we were doing, that we would miss that” (Iteration 1, Public Information Officer 1). Other students suggested that the quality of their work was af-fected. For example:“It was so rushed, sometimes, that it
was like “OK, someone grab a pen and just write
some-thing” ”(Iteration 1, Public Information Officer 2). In Iteration 1, we observed and noticed from feedback that the students could use more time when an event (i.e., an eruption) occurred, but not in-between (i.e., during normal monitoring tasks) therefore we kept the streaming speed the same for all subsequent iterations. Based on re-sults from Iteration 1, we decreased the simulation run-ning time by 24 days, reduced the number of events (from 26 to 24) and increased the number (from 4 to 6) and dur-ation (from ~5-10 minutes to 10–20 minutes) of pauses.
Pauses were present after important events in order to allow students to perform tasks. The number and length of pauses were increased to allow students more time to complete a task. In Iteration 2, pauses became a respite
from the quick pace’ moments to reflect, respond and
‘enjoy’: “[The simulation] flew by. I was shocked, espe-cially after the eruptions started. The pauses were awe-some!” (Iteration 2, Field Geologist);“It was always nice
to pause when something exciting happened” (Iteration
2, Ash Specialist). However, several students indicated that they continued to describe issues keeping up with the simulation and its demands. Optimising the pace ul-timately rested with assessing how much time students needed to react to a given event. For example, one student noted:“The compressed time period was good, but, maybe more time was needed for processing each event. Maybe pause after every event?”(Iteration 2, Meteorologist).
In Iteration 1 and 2, several students noted that they per-formed ‘just fine’ under the circumstances: “It was good
Table 5 History of preparation activities for the volcanic hazards simulation
Pilot Iteration 1 Iteration 2 Iteration 3 Iteration 4
Time to prepare Entire day prior, (on field trip)
Activities posted 1 week prior; online
Entire day prior, (on field trip)
Entire day prior (on field trip)
Activities posted 1 week prior; online
Simulation was embedded in: Field Course Lecture course Field Course Field Course Lecture Course
Preparation Activities Hazards Map Activity (Basic)
Hazards Map Activity (More detailed)
Hazards Map Activity Hazards Map Activity Hazards Map Activity (half of the class)
Lectures Lectures (course based) Lectures Lectures Science Communication Best Practices (Detailed)
Lectures (course-based) Science Communication Best Practices (Brief)
Simulation Instructions Basic More Detailed Complex Complex Complex
Role Specific materials N/A Very basic. Basic Role Profiles Role Profiles
Students had to research their own online.
descriptions of roles
Role Questionnaire Role Questionnaire Role Questionnaire
Student Library No No Yes, basic Yes, detailed Yes, detailed
Flow of Information Maps (i.e., Figure3)
having a lot thrown at us”(Iteration 1, Welfare Officer) and
“I thought it was perfect for me, because I was kept
think-ing the whole time, but not uncomfortably overwhelmed”
(Iteration 2, Ministry of Economic Development). This in-dicates that some students’skills were matched to the tasks that they needed to carry out.
In the final design of the simulation (used in Iteration 3 and 4) we reduced the number of events (from 26 to
24) and increased the duration (to 15–30 minutes) of
pauses to provide more time for adequate reasoning. When asked specifically how the pace affected their learning and their abilities during the simulation, fewer students (7 of 27, compared to previous iterations) stated they felt they needed more time. We observed that the new pace used in Iteration 3 and 4 allowed the students (20 of 27) to enjoy the excitement of the simulation and cope with the number of tasks and respond accord-ingly. Many students noted ‘the excitement’: “It kept the adrenaline going and it was exciting” (Iteration 3,
Group Controller); “… the feeling of being thrown into
the thick of it, added to the overall experience” (Iteration 2, Ministry of Agriculture and Forestry).
Discussion
Authentic educational activities can be very powerful learning and motivational tools. We set out to design an exercise which was fast-paced and immersive, where stu-dents react and make decisions under pressure, in a manner similar to professionals during a volcanic crisis. In order to ascertain if the pace was optimal or detrimental to student learning, we explored how the pace affected their behaviours and perceptions.
Flow theory states that a task (or set of tasks) in which the level of challenge is matched to the individual’s skills and capabilities can lead to highly motivating, immersive experiences (Csikszentmihalyi et al. 2005). Cognitive load theory suggests that an individual’s working memory can store seven elements, but can manipulate only two to four elements at any given time (Kirschner et al. 2011; Sweller et al. 1998). When the processing capacity of a student’s working memory is exceeded, their cognitive system might become overloaded by the high number of interacting ele-ments needed to be processed (e.g., Paas et al. 2003). This manifests itself as incapacity to react to the situation ef-fectively (i.e., self-reported or observed qualities of being
‘overwhelmed’or‘stressed out’) resulting in poor perform-ance. By increasing the time that students were given to carry out the tasks, we decreased the cognitive load of the individual student and the collective cognitive load of the team. In conclusion, the final design included longer pauses and fewer volcanic events (24 in total) to pro-vide optimal time for reasoning, reactions and decision-making.
Role assignment
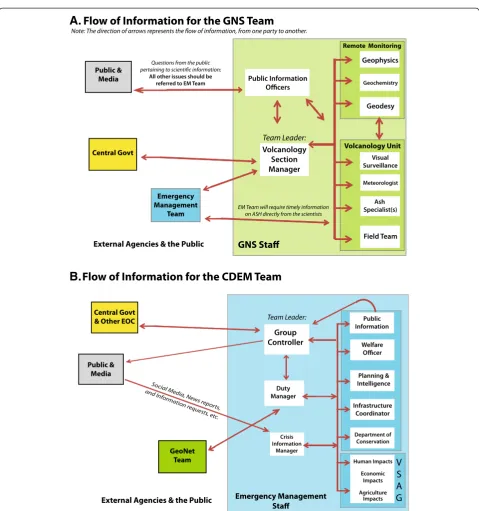
An integral aspect of the design was the authenticity of the roles and teams (i.e., real life science and emergency management protocols, structures, and responsibilities during volcanic crises; modelled after New Zealand roles and teams). These were fundamental to creating an au-thentic experience and were an explicit learning goal to introduce and reinforce how these disciplines interact during a crisis. The final team and role structures are shown in Figure 3A, and B. These team structures were included in the instructions in a Flow of Information Map, which illustrated the roles, teams, and communication pathways. A more detailed description of communication and team dynamics is given in Section Structuring Com-munication & Teamwork Tasks.
Results
In the Pilot, there were no pre-defined roles. We observed that in order to cope with the stress, the students self-organized into roles that included: the ‘Data’ people and the ‘Press’ people. Prior to students self-organizing, the group was visibly unorganized and inefficient. Students did not have defined tasks, responsibilities and therefore students did not lead or divide the workload to accom-plish the tasks. The simulation was in danger of getting off track and the instructors were required to intervene to help students delegate tasks and responsibilities. These observations were the primary motivation for introducing a structured role-play.
Role-play related feedback collected from the remaining iterations described how students valued the role and team structure of the exercise. This is highlighted by the following themes and representative excerpts.
1. Individual responsibilities:“I loved that we had roles…everyone had roles, they knew what they were supposed to be doing, like where to draw the line between you and your mate”(Iteration 1, Welfare Officer), anddividing the workload:“We were good at dividing up the tasks and finishing up our own responsibilities”(Iteration 2, Ministry of Health); 2. Role immersion:“it was good having different teams
and everyone having a different role so that you could really, like, get into one aspect”(Iteration 1, Volcano geophysicist); and
3. Helping students to focus and stay on task:“Yes playing roles was helpful because we could focus just on that job and understand it”(Iteration 2, Public Information Officer).
Manager), those responsible for more quantitative tasks (Ash Specialist), and for the communication links or liai-sons between the teams (Public Information Managers, In-frastructure Manager and the Duty Manager). In order to assign students to roles matched to their personality and skills, we designed and implemented a Role Assignment Questionnaire (Iteration 2; Appendix 2), which asked students about their background, interests and comfort with leadership and communication situations. The main criteria of interest in the Role Questionnaire were their self-reported abilities to lead, perform quantitative tasks, and communicate (i.e., qualities of the pivotal roles). In-structors used the questionnaire to help assign roles that challenged students appropriately, but ensured that the exercise ran smoothly, although they acknowledged that they did not always succeed.
Students in pivotal roles made major decisions and acted as the bridges for information to flow efficiently between the teams. These tasks are crucial working parts of the simulation. These roles were carefully assigned in Iteration 3 and 4 and resulted in observed and self-reported positive team dynamics (e.g., Iteration 4, “We all provided our individual ideas of events, contributing to all aspects” (Iteration 4, Infrastructure Manager)). The team leaders had many responsibilities. One team leader recalled all the tasks that he/she needed to per-form:“[I had to] make final decisions, to hold meetings and synthesize the various datasets, to keep the team or-ganized and running smoothly, to communicate with the media and the public officials”(Iteration 2, Volcanic Sec-tion Manager). We observed that the students assigned to pivotal roles became overwhelmed during the simula-tions and we concluded that there were too many tasks for students in some roles to carry out simultaneously. A Duty Manager role was implemented in Iterations 3 and 4, to help manage and delegate tasks (Ministry of Civil Defence and Emergency Management 2002). This new role manages the staff and controls the infor-mation going to the Group Controller (the Emergency Management team leader). They share the responsibilities previously assigned to the Group Controller, thereby decreasing the overall stress of this position. The instruc-tors involved in Iterations 3 and 4 noticed a significant change in the effectiveness of communication in the Emergency Management team following the introduction of this role.
One element of the role-play that we did not anticipate would have a negative impact was the level to which
stu-dents became immersed in their roles in the simulation.
The drawback to role immersion is that some students be-came introspective and ‘put their blinders on’: “It helped me learn more about my specific role, but I did not know what the others did” (Iteration 2, Volcano Geophysicist) and“I did well at focusing on my specific role, but I didn’t
do well at thinking about other people’s roles”(Iteration 4, Department of Conservation).
The data collected for this study does suggest that many students noted the phenomena of role immersion (i.e., get-ting into the learning experience; e.g., Lessiter et al. 2001) and role identification (i.e., feeling that they relate to that role or sense of belonging and commitment e.g., Handley et al. 2006). For example: “… it was easy to slip into the role for the game” (Iteration 3, Department of Conserva-tion);“People got really into their roles”(Iteration 2, Public Information Officer); [My role] just seemed to fit naturally with me and I sort of eased my way in and‘got stuck right in’, as the activity increased” (Iteration 2, Visual Surveil-lance). One of the students in Iteration 2 explained why this experience could be negative:“I think sometimes that if you get really into your role, you think “Oh yea, like
everything depends on me and my role”, rather than
looking about at what everyone else is doing, the effects of their roles and what they are monitoring” (Iteration 1, Gas Geochemist). Whilst wishing to retain the positive as-pects of role immersion, there were efforts in the later it-erations to emphasize the team structure and best practices of teamwork.
Discussion
Students from every iteration reported that having the op-portunity to play a professional geologist or emergency manager for the afternoon was a positive aspect of the ac-tivity. We showed here that assigning students to roles tai-lored to their interests and capabilities (using the Role Questionnaire), resulted in students being more likely to identify with the role and to operate more successfully. Self-actualization (c.f., Maslow 1943; Maslow 1970) is a powerful motivator therefore playing the role of a poten-tial future career should produce a highly motivating ex-perience. Additionally, overcoming challenges encourages a sense of self-efficacy and autonomy in the students, who may choose to continue to take on increasing challenges in the future (Kuhl and Blankenship 1979).
Student feedback indicated that the students immersed themselves into these roles by researching them prior to and‘getting into it’during the simulation. The roles were progressively better defined (with customized readings, skill sets, and responsibilities) with each iteration. Role as-signment was therefore also successful in team-wide issues such as reducing conflict, balancing team work loads, and improving the communication within and between the teams. These will be discussed below.
Structuring communication & teamwork tasks Results
platform upon which students can discover the quality, ef-ficiency, urgency, and importance of these skills. In the Pilot, the instructors recognized the need for
communica-tion and teamwork skills: “Seeing the chain of command
appearing and taking charge of what needed doing and seeing [the students] effectively disseminate the informa-tion. I think as soon as they realized that teamwork and
communication was important, it worked a lot better”
(Pilot, Instructor 2).
In Iteration 1–4, the students expressed times when the team communicated effectively and times when commu-nication within and between teams was not effective. When asked about teamwork students frequently men-tioned the team and leaders abilities to compile everyone’s thoughts and to listen to one another. Students also noted that good teamwork required supporting and being
sup-ported by the team leader: “We listened to the [Group]
Controller and went with his/her calls”(Iteration 2, Public Information Officer); “We had a definitive leader in our team”(Iteration 2, Gas Geochemist);“It was a real collab-oration, the leader didn’t just override us, he/she
consid-ered our opinions” (Iteration 2, Public Information
Officer).
Other students disagreed saying that they frequently talked over one another and exhibited poor listening skills. This led to an increased difficulty to make
deci-sions: “There were intense points when everyone was
talking allat thesame time. This obviously made it im-possible to think and to make good decisions”(Iteration 2, Planning and Intelligence,italics are for emphasis).
A primary source of stress was the amount of informa-tion that needed to be processed by leader roles. This oc-curred in both teams, across the iterations. For example:
“There were six people yelling [information] to [the team leader] and he/she would write it down, but I don’t think there was enough time for him/her to react to what was happening” (Iteration 3, Field Geologist). Effective com-munication pathways or information‘infrastructure’(Celik and Corbacioglu 2010) is vital for a team to work effi-ciently. We aimed to engineer more effective communica-tion pathways (through specific roles, increased awareness of team structure and preparation activities) resulting in more straightforward information transfer and thus suc-cessful decision-making and mitigation of the impending disaster. By scaffolding (i.e., providing guidance, support and advice) the students communication skills prior to (delivery of best practices) and during the simulation (through instructor interventions) more quality communi-cations were observed in later iterations. The best prac-tices presented to students focused specifically on being terse and contextual, but‘packaging’only the relevant in-formation into a communiqué was a large challenge reported by many students. Only through meaningful practice (during the simulation) were the students
observed to achieve this learning outcome (“I relayed
only the ‘need-to-know’information” (Iteration 3, Vol-cano geophysicist)). Providing strong team and role structure (through role assignment and pre-simulation preparation) improved communication pathways and
communication efficiency, allowing members to
think about the quality of the communications.
By providing more nodes (or in our case more students and more roles) we observed that the student’s efficiency increased and therefore improved the flow of information, and reduced‘bottlenecks’. This prevented major oral mis-communications, although a lack of efficiency during
times of stress persisted: “[The Emergency Management]
team didn’t get stuff from the scientists fast enough” (Iter-ation 3, Infrastructure), when inform(Iter-ation was not passed along quickly enough.
However, negative group dynamics continued for some of the teams in later iterations (3, 4) and this was mostly due to strong or overbearing personalities of individual stu-dents. The team leaders were chosen for their self-reported abilities of teamwork, leadership and confidence with public speaking, but some of the leader students, however, exhib-ited domineering behaviour. For example:“I wasn’t able to [speak at the press conferences] because of my‘Boss’, who wanted to be in the spotlight the entire time” (Iteration 3, Volcano geophysicist). Other issues arose during team dis-cussions:“Initially, I struggled slightly in discussion
involve-ment as there were several more dominant team members”
(Iteration 4, Infrastructure).
Communication efficiency improved throughout the simulation. In each iteration, we observed students grad-ually acquiring familiarity with the correct protocols and a level of comfort with this structure. The students reported frustration with the inefficiency of their communications. Information‘bottlenecks’promoted inefficiency:“The com-munication between us and the other geologists was hard because we had to communicate through [the team leader]. And [the team leader] was too busy with everything some-times to relay it” (Iteration 1, Field Geologist). Building awareness of the importance and inherent difficulties of information transmission was one of our major learning goals (Table 1, goal 5) and was reported by the students in all simulation iterations.
The simulation consists of interdependent tasks (where team members relied on one another to complete a task or outcome; Wageman 2000) which requires a collabora-tive approach (Rousseau et al. 2006; Wageman 1995)). We aimed to establish clear, transparent boundaries between roles, which allowed students to focus on their tasks and make complex tasks into discrete, manageable tasks.