P R I M A R Y R E S E A R C H
Open Access
Gene selection and cancer type classification
of diffuse large-B-cell lymphoma using a
bivariate mixture model for two-species data
Yuhua Su
1*, Dahlia Nielsen
2, Lei Zhu
3, Kristy Richards
4, Steven Suter
5, Matthew Breen
6,
Alison Motsinger-Reif
7and Jason Osborne
7Abstract
A bivariate mixture model utilizing information across two species was proposed to solve the fundamental problem of identifying differentially expressed genes in microarray experiments. The model utility was illustrated using a dog and human lymphoma data set prepared by a group of scientists in the College of Veterinary Medicine at North Carolina State University. A small number of genes were identified as being differentially expressed in both species and the human genes in this cluster serve as a good predictor for classifying diffuse large-B-cell lymphoma (DLBCL) patients into two subgroups, the germinal center B-cell-like diffuse large B-cell lymphoma and the activated B-cell-like diffuse large B-cell lymphoma. The number of human genes that were observed to be significantly differentially expressed (21) from the two-species analysis was very small compared to the number of human genes (190) identified with only one-species analysis (human data). The genes may be clinically relevant/important, as this small set achieved low misclassification rates of DLBCL subtypes. Additionally, the two subgroups defined by this cluster of human genes had significantly different survival functions, indicating that the stratification based on gene-expression profiling using the proposed mixture model provided improved insight into the clinical differences between the two cancer subtypes.
Keywords: Mixture models, Gene expression, Homology, Lymphoma
Introduction
Diffuse large-B-cell lymphoma (DLBCL), the most com-mon type of non-Hodgkin lymphoma in adults, accounts for 30% to 40% of newly diagnosed lymphomas and has an annual incidence in America of more than 25,000 cases. Combination chemotherapy has transformed DLBCL from a fatal disease into one that is often curable, but only approximately 50% of all patients are cured [1,2]. This suggests that DLBCL actually comprises several subgroups that differ in responsiveness to chemother-apy. The attempts to define subgroups of DLBCL have often failed due to diagnostic discrepancies. Clinically, the International Prognostic Index (IPI) [3] has been devel-oped for use in the design of future therapeutic trials in patients with aggressive non-Hodgkin lymphoma and in
*Correspondence: [email protected]
1Dr. Su’s Statistics, Department of Human Nutrition, Food, and Animal Sciences, University of Hawaii at Manoa, Honolulu, HI 96822, USA Full list of author information is available at the end of the article
the selection of appropriate therapeutic approaches for individual patients. However, IPI has not been used suc-cessfully to predict outcomes in DLBCLs so that patients can be stratified correctly for therapeutic trials. This may be attributed to the fact that the clinical factors of IPI (age, tumor stage, serum lactate dehydrogenase concentration, performance status, and number of extranodal disease sites) neither provide molecular insight into the hetero-geneity of DLBCL nor identify specific therapeutic targets [4,5].
Recent developments in microarray technology allow researchers to accurately and precisely measure gene expression patterns in lymphomas which provides the opportunity to revolutionize the way these tumors are grouped and treated. In other words, studying gene expression profiles in lymphomas may provide the oppor-tunity to identify pathways on which the tumor depends and to target the pathways for the development of new drugs. Indeed, gene-expression profiling studies have distinguished three molecular subtypes of DLBCL:
germinal-center cell-like (GCB) DLBCL, activated B-cell-like (ABC) DLBCL, and primary mediastinal B-cell lymphoma (PMBL) [2,5-8].
The first attempt at examining gene expression profil-ing to identify distinct B-cell malignancies was made by Alizadeh et al. [9]. A hierarchical clustering algorithm [10] was used to group genes on the basis of similarity of their expression over all subjects. Subjects were also grouped based on the similarities in gene expression using the same clustering method. Two distinct subgroups of DLBCL were found based on the gene expression analysis: GCB DLBCL and ABC DLBCL. Alizadeh et al. [9] discov-ered that almost all genes that defined GCB DLBCL were highly expressed in normal germinal center B cells and, by contrast, most genes that defined ABC DLBCL were not expressed in normal germinal center B cells. In addition, there was a substantial and significant difference in the average five-year survival rate between patients with GCB DLBCL and ABC DLBCL.
Inspired by the work of Alizadeh [9], Rosenwald et al. [5] found that most of the genes with expression patterns that correlated with survival of the DLBCL subgroups fell within four gene-expression signatures.A gene-expression signature is a group of genes expressed in a specific cell lineage or stage of differentiation or during a particular biologic response andhence genes within the same gene-expression signature are probably associated with similar biologic aspects of tumor[5]. The authors in [5] then devel-oped a molecular predictor consisting of 17 genes for the likelihood of survival after chemotherapy according to gene expression profiles of lymphomas. Shipp et al. [4] adopted the weighted-voting algorithm [11] to develop an outcome predictor with 13 genes and were able to classify two categories of DLBCL patients with very different five-year overall survival rates. Note that there is no overlap among the genes in the models derived in [4] and [5].
Wright et al. [8] formulated a DLBCL subgroup pre-dictor based on Bayes’ rule, applied this method to the DLBCL gene expression data in [5], and constructed a 27-gene DLBCL subgroup predictor. Next, a new predic-tor including 14 genes among the previous predicpredic-tor was constructed and applied to another set of gene expression data from DLBCLs [4]. Wright et al. [8] also demonstrated that the proposed algorithm can define cancer subgroups based on gene expression differences regardless of the DNA microarray platforms and could be used clinically to provide diagnostic information as the resulting survival rates were significantly different for the identified GCB and ABC DLBCL subgroups.
A panel of 36 genes whose expression predicts survival in DLBCL was identified by Lossos et al. [1] through lit-erature review. They [1] selected 6 out of the 36 genes by ranking them on the basis of their predictive power for DLBCL survival obtained by univariate analysis. A 6-gene
multivariate Cox proportional-hazards regression model for prediction of survival in DLBCL was constructed and applied to the data from [4] and [5]. Lossos et al. [1] con-cluded that the measurement of the expression of the six genes was sufficient to predict overall survival in DLBCL after stratifying patients into different risk groups based on their IPI score.
More recently, Blenk et al. [12] analyzed an enlarged data set (original data were generated by [5]) to confirm that there are clear expression differences between ABC and GCB DLBCL. To detect differentially expressed genes, they [12] used limma in [13] and further determined 50 best separating genes for class discovery. An optimal classifier with only 18 genes for distinguishing DLBCL subgroups was conducted. In addition, an optimal molec-ular survival predictor with only six genes was obtained. However, there was no overlap among the genes used in the classifier and the survival predictor established in [12]. Models introduced in [1,4,5,8,9,12] can be used to dis-tinguish the subgroups in DLBCL and identify rational targets for research into treatment intervention. More-over, the predictor identified by each study involved only a small number of genes and thus the needed DNA microarrays may be easily developed for clinical predic-tion. Nonetheless, genes seldom overlap in these models. Blenk et al. [12] showed that 6 of the 18 genes used in the optimal classifier were found again after analyzing another data set from [4]. However, none of these genes were identified in a subsequent investigation of survival [12].
Due to technical differences, the composition of the microarrays used, and the different algorithms used for constructing predictive models, it remains unclear which method and which model best captures the molecular and clinical heterogeneity of diffuse large-B-cell lymphoma. Therefore, the goal in this research was to give an example of how bivariate data can be used for clinical research.
Methods
Let Xaij and Xhil denote gene expression measurements
from the ith orthologous gene pair [14] for the jth ani-mal and thelthhuman. The following independent linear models describe the association between gene expression and treatment (cancer type):
Xaij = β0ai+β1aiTaj+eaij, (1) Xhil = β0hi+β1hiThl+ehil, (2)
where Taj and Thl are {0, 1} treatment indicators, and eaij andehil are independentN(0,σa2) andN(0,σh2) ran-dom variables. Theσa2 andσh2 are variances foreaij and ehil, respectively. A given gene can be classified as
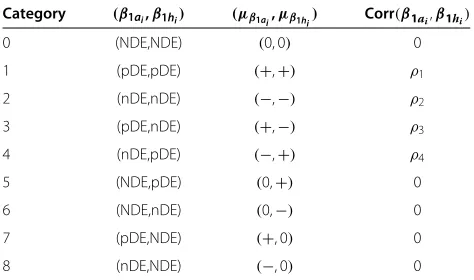
showing positive treatment effects), or negatively dif-ferentially expressed (nDE, showing negative treatment effects). Furthermore, we assume dependency between differentially expressed orthologs. Therefore, for a human and animal gene pair, there are nine possibilities for cate-gorizing this pair of genes, illustrated in Table 1.
The following two-species nine-component bivariate normal mixture model in [15,16] is proposed to simul-taneously model the vectors of the estimated treatment effects(βˆ1ai,βˆ1hi)Tobtained from Equations 1 and 2:
ˆ
β1ai
ˆ β1hi
∼π0N 00
,
σa20 0
0 σh20
+π1N μa1 μh1
,
σa21 ρ1σa1σh1 ρ1σa1σh1 σh21
+π2N μa2 μh2
,
σa22 ρ2σa2σh2 ρ2σa2σh2 σh22
+π3N μμa3
h3
,
σa23 ρ3σa3σh3 ρ3σa3σh3 σh23
+π4N μμa4
h4
,
σa24 ρ4σa4σh4 ρ4σa4σh4 σh24
+π5N 0 μh5
,
σa25 0
0 σh25
+π6N μ0
h6
,
σa26 0
0 σh26
+π7N μ0a7
,
σa27 0
0 σh27
+π8N μa8 0
,
σa28 0
0 σh28 , (3)
whereπk ,k = 0,. . ., 8 denote the mixing weights (the probability that an observation belongs to thekth compo-nent). Note that8k=0πk = 1 andπk ≥ 0 .(μak,μhk)T
and(σak2,σhk2)Tare the vectors of the means and variances, respectively, for each species in each mixture component.
ρk denotes the correlation between orthologs under the kth category. To accommodate the possible patterns of
Table 1 Possible categories of(β1ai,β1hi)T
Category (β1ai,β1hi) (μβ1ai,μβ1hi) Corr(β1ai,β1hi)
0 (NDE,NDE) (0, 0) 0
1 (pDE,pDE) (+,+) ρ1
2 (nDE,nDE) (−,−) ρ2
3 (pDE,nDE) (+,−) ρ3
4 (nDE,pDE) (−,+) ρ4
5 (NDE,pDE) (0,+) 0
6 (NDE,nDE) (0,−) 0
7 (pDE,NDE) (+, 0) 0
8 (nDE,NDE) (−, 0) 0
the gene expression for animal and human due to treat-ment intervention (different cancer types), the following constraints are imposed:μa1 ≥ 0,μh1 ≥ 0,μa2 ≤ 0, μh2 ≤0,μa3 ≥0,μh3 ≤ 0,μa4 ≤ 0,μh4≥ 0,μh5 ≥0, μh6≤ 0,μa7 ≥0, andμa8≤0;ρ0 =0,ρ5 =0,ρ6= 0, ρ7=0, andρ8=0.
Gene membership is determined according to the maximum posterior probability that an observation
(βˆ1ai,βˆ1hi)T comes from the kth component of the mixture.
A parametric bootstrap method in [17,18] to estimate the standard errors for the estimated parameters is pro-vided. Bootstrapping is the practice of estimating proper-ties of an estimator by measuring those properproper-ties when sampling from an approximating distribution. The basis of the bootstrap methodology is simple. In the paramet-ric bootstrap setting, considerFto be a member of some prescribed parametric family and obtainFn by estimat-ing the family parameters, in this case,(πk,μak,μhk,k)T, k = 0,. . ., 8 , from the data. In each iteration, by generating an iid random sequence, called a ‘resample’ from the distributionFn, new estimates of the param-eters are obtained and the sampling properties (such as the mean, standard deviation, bias, and shape) can be evaluated.
The procedure of the parametric bootstrap resampling method to obtain the estimated standard errors of the esti-mated parameters for the nine-component mixture model is described as follows:
1. Fnis formed by substituting the estimates of
(μak,μhk)Tandkinto the 9-component mixture model (3).
2. The numbers of genes in category 0 through category 8(n0,n1,. . .,n8)are drawn from a multinomial distribution with parametersn andp.n is the number of trials for each multinomial random variable. In this study, it is equal to the number of orthologs in two-species data.pis the vector of event probabilities for each trial. In this study,pis the vector of the mixing weights estimated from the data. The new mixing weights are then calculated for the bootstrap resampling and plugged into the
nine-component mixture model (Equation 3) to form
Fn.
3. Bootstrap samples(βˆ1∗a i,βˆ
∗ 1hi)
Tof sizen are drawn
fromFnformed above.
4. For each bootstrap resampling, obtain the numerically approximated maximum likelihood estimates for the parameters in the nine-component mixture using the expectation-maximization (EM) algorithm.
empirical standard deviation of a series of bootstrap replications ofθˆaccordingly.θˆis the estimator ofθ, the parameter of interest. Since the standard error of the mean (s/√n, sample standard deviation divided by the squared root of the size of the sample) is the estimate of the true standard deviation of the sample mean (σ/√n, standard deviation for the population divided by the squared root of the size of the sample), essentially, the standard deviation of the bootstrap estimator obtained here is an estimation of the standard error of the mean for the parameter of interest. The bootstrap standard errorSEBofθˆis calculated as follows:
SE(θ )ˆ B=
1
B−1 B
b=1
(θˆb∗− ¯ˆθ∗)2,
whereθˆb∗is the estimator ofθ calculated from thebth bootstrap resample(b=1,. . .,B),θ¯ˆ∗=Bb=1θˆb∗/B; B is the total number of resamples (each of size n) collected from the empirical estimate ofF.
Data sources
In order to improve treatments for non-Hodgkin lym-phoma in human and canine patients, researchers from North Carolina State University’s College of Veterinary Medicine and the University of North Carolina at Chapel Hill Lineberger Comprehensive Cancer Center conducted research to study tissue samples from human and canine non-Hodgkin lymphoma patients, with the hope of cre-ating a genomic profile of non-Hodgkin lymphoma that would give oncologists and veterinarians greater insight into the disease’s biology and obtain the information that could lead to a clinical benefit for both species. The study protocol was approved by the Institutional Animal Care and Use Committee of North Carolina State University.
The team recruited dogs diagnosed with lymphoma to collect tissue samples for study. The dog data were measured at the probe set level on Affymetrix Canine Genome 2.0 array (Canine 2, Affymetrix Inc., Santa Clara, CA, USA), with a total number of probe sets equal to 43,035. Forty-eight dogs with one of the following diag-nostic results were recruited: B-cell lymphoma (27 dogs), T-cell lymphoma (10 dogs), B-cell acute lymphoblastic leukemia (1 dog), T-cell acute lymphoblastic leukemia (4 dogs), and normal (6 dogs). Among the 27 dogs with B-cell lymphoma, 14 of them were diagnosed histopatho-logically with DLBCL. The 14 DLBCL patients could be further divided into two subgroups: 5 ABC DLBCL patients and 9 GCB DLBCL patients. For the purpose
of this research, only data for the 14 dogs with DLB-CLs were used. The dog microarray gene expression data were LOESS normalized by JMP Genomics 4.0 (Cary, NC, USA).
Corresponding data for human patients with lymphoma were extracted from the Gene Expression Omnibus (GEO) database [19]. Data for 460 lymphoma patients were retrieved from two series with GEO accession num-ber: GSE10846 [7] and GSE11318 [6]. The human data were measured at the probe set level on Affymetrix Human Genome U133 2.0 array (HG-U133 Plus 2), with a total number of probe sets equal to 54,675. The human microarray gene expression data were also LOESS nor-malized by JMP Genomics 4.0. Based on the gene expres-sion, two distinct subgroups were identified after principle component analysis. This implied that there may be a strong batch effect among the samples. Hence, only sam-ples from one of these two subgroups were included in the data analysis. This resulted in 219 human subjects consisting of 31 PMBL, 78 ABC DLBCLs, 80 GCB DLB-CLs, and 29 unclassified DLBCLs (distinguishing between subgroups of DLBCL is through gene-expression profiling [6,7]). To make the animal and human data comparable, only data for ABC and GCB DLBCLs with correspond-ing survival information were used. This resulted in a final dataset with 77 ABC DLBCL patients and 79 GCB DLBCL patients.
After averaging probe sets across a gene to obtain a gene-level transcript value, the orthologous information from HomoloGene release 64 at website ftp://ftp.ncbi.nih. gov/pub/HomoloGene/build64/ was applied to acquire the mappings between dog and human. This led to a total of 6,566 pairs of dog and human orthologs.
Data analysis
We recall that the objective of the data analysis was to identify rational targets (genes) for treatment interven-tion simultaneously for both dog and human lymphoma patients with the hope of giving researchers greater insight into the disease’s biology. Furthermore, it was also of inter-est to verify if the targeted genes can serve as a good predictor to clinically distinguish subgroups of DLBCL in humans. Because the samples in humans that were used to estimate the distribution of the bivariate mixture model were also used to build the classification func-tion, there was a possibility of over-fitting, resulting in a model that would indicate an over-optimistic separation between the subgroups than would be found in inde-pendent data. To avoid the biased classification result, a leave-one-out-cross-validation (LOOCV) procedure [20] was introduced as the following steps:
expressionβˆ1ai,i=1,. . ., 6, 566. Omit one
observation from the 156 human observations and obtain the estimated coefficients of cancer type effect
ˆ β1hi.
2. Use all(βˆ1ai,βˆ1hi)Tto construct the nine-component bivariate normal mixture model. Identify gene membership accordingly.
3. Use genes classified into categories (1, 2, 3, and 4) (differentially expressed in both species) to develop a classification rule based on the remaining 155 human observations. Develop another classification rule based on genes classified into categories (1, 2, 3, 4, 5, and 6) (differentially expressed in human).
4. For the purpose of comparison, identify differentially expressed human genes by performing a single species analysis for human only. Choose genes based on thep values of the t statistics after adjusting for multiple comparison by controlling the false discovery rate (FDR) [21] at levels 0.01 and 0.00001. 5. Classify the holdout human observation using the
classification rules constructed in steps 3 and 4. 6. Repeat steps 1, 2, 3, 4 and 5 until every one of the
human observations is classified.
The classification rule was established through theM -dimensional centroid obtained from the k-means [22] clustering process applied to the training set.Mwas the number of genes retained for performing cancer type clas-sification. k was equal to 2 as there were two types of cancer. SAS PROC FASTCLUS [23] was used to carry out thek-means clustering.
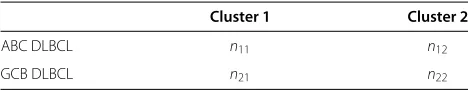
Sincek-means does the clustering, and not the classi-fication, the class of each cluster has to be determined for the classification rule before it can be used to classify future observations. Table 2 demonstrates the results of thek-means clustering.
Clusters were designated so that the minimum misclas-sification rate was achieved. Therefore,
⎧ ⎪ ⎪ ⎪ ⎪ ⎪ ⎪ ⎪ ⎪ ⎪ ⎪ ⎨ ⎪ ⎪ ⎪ ⎪ ⎪ ⎪ ⎪ ⎪ ⎪ ⎪ ⎩
if n12+n21<n22+n11
⇒cluster 1 = “ABC DLBCL” and cluster 2 = “GCB DLBCL”, if n12+n21>n22+n11
⇒cluster 1 = “GCB DLBCL” and cluster 2 = “ABC DLBCL”, if n12+n21=n11+n22
⇒randomly assign cluster labels.
Table 2 Thek-means clustering results
Cluster 1 Cluster 2
ABC DLBCL n11 n12
GCB DLBCL n21 n22
The classification rule established at the lth LOOCV procedure was then
⎧ ⎪ ⎪ ⎨ ⎪ ⎪ ⎩
ifMl
m=1(xhml−μ centroid
l,1m )2<
Ml
m=1(xhml−μ centroid
l,2m )2 ⇒classify thelth human subject into cluster 1, else⇒classify thelthhuman subject into cluster 2.
Ml was the total number of genes retained at the lth LOOCV procedure for cancer type classification. l = 1,. . ., 156 , as there were 156 human DLBCL patients. xhml was the m
th gene expression for the lth hold-out
human subject. For thelth LOOCV procedure,μcentroidl,1m
andμcentroidl,2m were themthcentroid means (m=1,. . .,Ml) calculated from thek-means (k=2) algorithm for cluster 1 and cluster 2, respectively.
Results
Parameter estimation
The maximum likelihood estimates of the parameters in the nine-component bivariate normal mixture model computed using the EM algorithm [24] are given in Table 3. The estimated mixture weight for category 0 wasπˆ0 = 0.823 indicating approximately 5,404(6, 566×
0.823) pairs of uninteresting dog and human orthologs.
(μa,μh)T denotes the mean vector of each mixture com-ponent. Most of the estimated mean vectors were slightly larger in categories 1 through 4 than those in categories 5 through 8. It appeared that the magnitude of the estimated difference of expression in genes related to lymphoma in both species tended to be larger than in genes where differential expression was exhibited in only one species.
Gene selection and cancer type classification
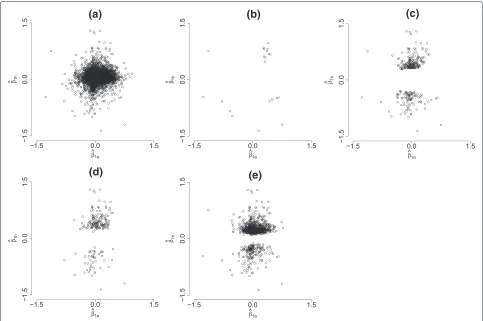
For the 156 LOOCV instances, the proposed mixture model determined 21 (14 genes appearing in the intersec-tion of all hold-outs) human genes in categories (1, 2, 3, and 4) and 279 (185 genes appearing in the intersection of all hold-outs) human genes in categories (1, 2, 3, 4, 5, and 6). While analyzing the human data alone and controlling the FDR at levels 0.01 and 0.00001, 935 (706 genes appear-ing in the intersection of all hold-outs) and 190 (139 genes appearing in the intersection of all hold-outs) genes were identified as differentially expressed, respectively. Figure 1 shows the scatter plots of(βˆ1a,βˆ1h)Tfor all orthologs and the 21 pairs of orthologs in categories (1, 2, 3, and 4); i.e., the genes in this group showed evidence of distinguish-ing the two types of cancer for both species. Clearly, most of the pairs scattered around the(0, 0)origin, indicating that these genes (for both species) did not have poten-tial for serving as markers that could distinguish the two subgroups of DLBCL.
Table 3 Summary of parameter estimates for the bivariate mixture model averaged over the 156 LOOCV outcomes
Parameter
Category πk μak μhk σak2 ρkσakσhk σhk2
0 0.823(0.077) NE NE 0.013(0.001) NE 0.012(0.001)
1 0.001(0.005) 0.341(0.081) 0.022(0.130) 0.004(0.010) 0.001(0.017) 0.022(0.060)
2 0.001(0.001) -0.602(0.243) -0.831(0.193) 0.199(0.082) -0.128(0.048) 0.089(0.036)
3 0.001(0.004) 0.495(0.195) -0.564(0.244) 0.042(0.078) -0.042(0.041) 0.119(0.074)
4 0.000(0.003) -1.131(0.422) 0.758(0.305) 0.000(0.028) 0.000(0.015) 0.000(0.050)
5 0.020(0.008) NE 0.492(0.121) 0.020(0.021) NE 0.058(0.049)
6 0.011(0.004) NE -0.517(0.136) 0.034(0.093) NE 0.040(0.044)
7 0.130(0.077) 0.331(0.038) NE 0.018(0.009) NE 0.025(0.001)
8 0.012(0.008) -0.478(0.339) NE 0.011(0.051) NE 0.042(0.054)
Numbers in parentheses are the bootstrap standard errors;B=5, 000(the number of bootstrap replications);NEnot estimated.
based either on two-species analysis (the nine-component bivariate mixture model) or on single-species (human only) analysis, the next step in the LOOCV procedure was to classify the hold-out human subject according to a classification rule established using the same set of genes. Table 4 summarizes the classification results over the 156 LOOCV instances under the four different gene selection
criteria. It was interesting to see that using human genes from categories (1, 2, 3, and 4), categories (1, 2, 3, 4, 5, and 6) (two-species analysis), and the genes selected by controlling FDR at 0.00001 (single-species analysis) gave a very similar number of misclassifications, 17, 16, and 19, respectively. Nonetheless, choosing FDR = 0.01, the gene list was largely expanded. The enlarged gene
(a)
(b)
(c)
(d)
(e)
Table 4 Misclassification tables using different criteria
Categories (1, 2, 3, and 4) Categories (1, 2, 3, 4, 5, and 6) FDR = 0.00001 FDR = 0.01
Model prediction/subgroup ABC GCB ABC GCB ABC GCB ABC GCB
ABC DLBCL 72 5 64 13 58 19 0 77
GCB DLBCL 12 67 3 76 0 79 2 77
list resulted in a very poor classification result: 79 sub-jects were misclassified, among whom the entire group of ABC DLBCLs were misclassified as GCB DLBCLs. Misclassification rates were 0.109, 0.103, 0.122, and 0.506, accordingly. It was reasonable to conclude that the clas-sification results based on two-species (dog and human) data, in general, may outperform those based on only single-species (human) data.
Prognostic DLBCL sub-categories defined by gene expression profiles
Does the taxonomy of DLBCL derived from gene expres-sion patterns define clinically distinct subgroups of patients? To confirm that these two DLBCL subgroups defined by gene expression (the 21 genes in categories (1, 2, 3, and 4)) were both biologically and clinically dis-tinct so that the mixture model approach could form the basis of a robust diagnostic test that may prove useful in assessing the results of therapeutic trials in DLBCL, over-all survival and subgroup survival based on two types of gene-expression profiling, in [6] and [7] and the proposed mixture model approach, were plotted.
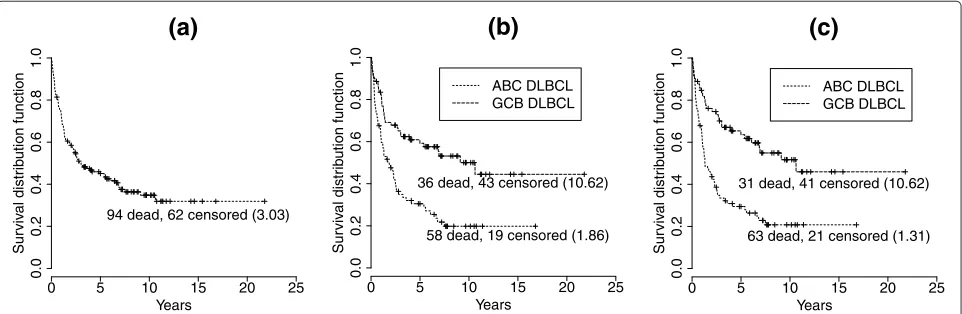
Figure 2 shows the nonparametric Kaplan-Meier sur-vival probability estimates [25] for patients with DLBCL under two situations, unstratified and stratified, by gene-expression profiling. Treating the DLBCL patients regard-less of the biological difference between the subgroups gave a 5-year survival rate of 45%. The 5-year survival
rates after stratifying the patients according to the gene-expression profiling performed in [6] and [7] were 31% for ABC DLBCL and 59% for GCB DLBCL as compared with the rates of 29% for ABC DLBCL and 64% for GCB DLBCL if patients were stratified by the gene-expression profiling results based on the proposed nine-component mixture model. Under both types of stratification, ABC and GCB DLBCL were associated with statistically signifi-cant differences in overall survival (p<0.0001). A log-rank test [26] was used to test the hypothesis of equal survival functions. The molecular dissection of DLBCL by gene-expression profiling using the proposed nine-component mixture model apparently identified different features of these patients that influence their survival.
As determined by gene-expression profiling performed in [6] and [7], among the 156 patients, there were 77 ABC DLBCLs and 79 GCB DLBCLs. Conversely, the stratifi-cation stated by the gene-expression profiling using the proposed nine-component mixture model gave a result of 84 ABC DLBCLs and 72 GCB DLBCLs. More specif-ically, five of the ABC DLBCLs had been classified as GCB DLBCLs, and 12 of the GCB DLBCLs had been categorized as ABC DLBCLs. However, the difference between the median survival time (years) of the subgroups stratified by gene-expression profiling performed in [6] and [7] was smaller than that of the subgroups stratified by gene expression profiling using the proposed nine-component mixture model (8.76 vs. 9.31). This may imply
0 5 10 15 20 25
0.0
0.2
0.4
0.6
0.8
1.0
(a)
Years
Sur
viv
al distr
ib
ution function
94 dead, 62 censored (3.03)
0 5 10 15 20 25
0.0
0.2
0.4
0.6
0.8
1.0
(b)
Years
Sur
viv
al distr
ib
ution function
ABC DLBCL GCB DLBCL
58 dead, 19 censored (1.86) 36 dead, 43 censored (10.62)
0 5 10 15 20 25
0.0
0.2
0.4
0.6
0.8
1.0
(c)
Years
Sur
viv
al distr
ib
ution function
ABC DLBCL GCB DLBCL
63 dead, 21 censored (1.31) 31 dead, 41 censored (10.62)
that the stratification based on the gene expression pro-filing using the proposed nine-component mixture model provided better insight for the clinical difference between ABC and GCB DLBCL. These results suggested that the microarray-based outcome predictor not only reflected the clinical difference between the two DLBCL subgroups, but also provided a possible strategy of investigation for further individualization of patient treatment.
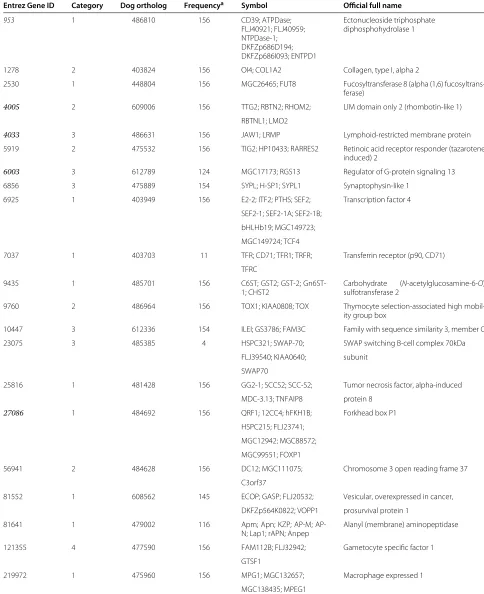
Justification of the 21 selected human genes
To validate the relevance between specific genes and phe-notypes, a careful search of the literature was undertaken using Entrez Gene [27]. Some of these 21 genes (the genes in Table 5 with Entrez ID highlighted in italics) were iden-tified by this search as potentially associated with the development of DLBCL. A brief summary of the relation-ship between these candidate genes and the development of DLBCL is given as follows:
1. CD39 [Entrez Gene:953] is a B lymphocyte activation marker and has powerful functions in the immune system [28].
2. The expression pattern ofJAW1 [Entrez Gene:4033], a lymphoid-restricted protein, suggested that this protein may have a role in the developmentally regulated trafficking of the antigen receptors in B cells and may influence lymphoid development [29]. Tedoldi et al. [30] pointed out that high levels ofJaw1 mRNA were found in germinal center B-cells and in diffuse large B-cell lymphomas of germinal center subtype.
3. The importance ofLMO2 [Entrez Gene:4005], though its function in germinal center cells is unknown, as a candidate marker involved in the development of DLBCL has been discussed in several papers. Natkunam et al. [31] studiedLMO2 at the protein level and confirmed thatLMO2 is expressed specifically in germinal center B cells, which is fully in keeping with gene-expression profiling studies that showed high levels ofLMO2 mRNA in germinal center B cells. They in [31] also observed that among DLBCLs,LMO2 tended to be expressed in cases assigned by phenotyping to the GCB categories and can therefore be added to the panel of markers that pathologists may use to subcategorize lymphomas. Morton et al. [32] claimed thatLMO2 is one of the candidate genes involved in lymphocyte development and is highly expressed in germinal center
lymphocytes. Durnick et al. [33] studied the relationship betweenLMO2 expression and
t(14;18)/IGH-BCL2, a specific marker of lymphomas of germinal center origin and has been specifically associated with the GCB subgroup of DLBCL as determined by gene expression profiling but not in
the ABC cases. There was a statistically significant association betweenIGH-BCL2 fusion and LMO2 protein expression and henceLMO2 was suggested as a potential marker for the GCB phenotype. A similar conclusion has also been reached by [1]. 4. Germinal center B lymphocytes prominently express
at least two regulators of G-protein signaling (RGS) proteins,RGS1 and RGS13 [Entrez Gene:6003]. RGS is a family of proteins acting to limit and modulate heterotrimeric G-protein signaling. Han et al. [34] discovered that RGS1 and RGS13 act together to regulate chemokine receptor signaling in human germinal center B lymphocytes. The results provide some insight toward finding methods to reduce or eliminate an organism’s negative reaction to a treatment stimulus.
5. The importance of the transcription factorFOXP1 [Entrez Gene:27086] as marker for the activated B-cell-like signature has been well-established [5,9]. Banham et al. [35] investigated the prognostic importance of FOXP1 protein expression in DLBCL and found that the overall empirical survival curves for the two subgroups based on the expression of FOXP1 are significantly different. Goatly et al. [36] made an attempt to discover the underlying molecular mechanism ofFOXP1 expression in lymphoma development by investigating theFOXP1 translocation, copy number change, and protein expression in mucosa-associated lymphoid tissue lymphoma and DLBCL. Korac and Dominis [37] explored the association betweenFOXP1, BCL2, and BCL6 gene expression in diffuse large B-cell
Table 5 Summary of the gene-specific information (retrieved from Entrez Gene, an NCBI’s database for gene-specific information)
Entrez Gene ID Category Dog ortholog Frequencya Symbol Official full name
953 1 486810 156 CD39; ATPDase; Ectonucleoside triphosphate
FLJ40921; FLJ40959; diphosphohydrolase 1 NTPDase-1;
DKFZp686D194; DKFZp686I093; ENTPD1
1278 2 403824 156 OI4; COL1A2 Collagen, type I, alpha 2
2530 1 448804 156 MGC26465; FUT8 Fucosyltransferase 8 (alpha (1,6)
fucosyltrans-ferase)
4005 2 609006 156 TTG2; RBTN2; RHOM2; LIM domain only 2 (rhombotin-like 1)
RBTNL1; LMO2
4033 3 486631 156 JAW1; LRMP Lymphoid-restricted membrane protein
5919 2 475532 156 TIG2; HP10433; RARRES2 Retinoic acid receptor responder (tazarotene induced) 2
6003 3 612789 124 MGC17173; RGS13 Regulator of G-protein signaling 13
6856 3 475889 154 SYPL; H-SP1; SYPL1 Synaptophysin-like 1
6925 1 403949 156 E2-2; ITF2; PTHS; SEF2; Transcription factor 4
SEF2-1; SEF2-1A; SEF2-1B;
bHLHb19; MGC149723;
MGC149724; TCF4
7037 1 403703 11 TFR; CD71; TFR1; TRFR; Transferrin receptor (p90, CD71)
TFRC
9435 1 485701 156 C6ST; GST2; GST-2;
Gn6ST-1; CHST2
Carbohydrate (N-acetylglucosamine-6-O) sulfotransferase 2
9760 2 486964 156 TOX1; KIAA0808; TOX Thymocyte selection-associated high
mobil-ity group box
10447 3 612336 154 ILEI; GS3786; FAM3C Family with sequence similarity 3, member C
23075 3 485385 4 HSPC321; SWAP-70; SWAP switching B-cell complex 70kDa
FLJ39540; KIAA0640; subunit
SWAP70
25816 1 481428 156 GG2-1; SCCS2; SCC-S2; Tumor necrosis factor, alpha-induced
MDC-3.13; TNFAIP8 protein 8
27086 1 484692 156 QRF1; 12CC4; hFKH1B; Forkhead box P1
HSPC215; FLJ23741;
MGC12942; MGC88572;
MGC99551; FOXP1
56941 2 484628 156 DC12; MGC111075; Chromosome 3 open reading frame 37
C3orf37
81552 1 608562 145 ECOP; GASP; FLJ20532; Vesicular, overexpressed in cancer,
DKFZp564K0822; VOPP1 prosurvival protein 1
81641 1 479002 116 Apm; Apn; KZP; M;
AP-N; Lap1; rAPAP-N; Anpep
Alanyl (membrane) aminopeptidase
121355 4 477590 156 FAM112B; FLJ32942; Gametocyte specific factor 1
GTSF1
219972 1 475960 156 MPG1; MGC132657; Macrophage expressed 1
MGC138435; MPEG1
curves to predict survival for DLBCL patients [39]. All these results suggested that FOXP1 expression may be important in DLBCL pathogenesis.
Among the 21 selected genes, five (from categories 1, 2, and 3) have been carefully examined to explore their association with the development of lymphoma. From the mixture model assumption, genes in the same cate-gory should react to the stimulus (drug treatment, cancer type, etc.) in a similar manner. Hence, the implications of these 21 genes (some of them may not have been stud-ied scrupulously) in lymphoma may provide timely and important insight on guiding future investigations of their roles in both B-cell biology and lymphoma development.
Conclusions
Since the development of high throughput gene expres-sion technology, the important and difficult task of searching for genes that exhibit differences across species (cancer types or treatment groups in drug trials) has been the focus of much research. Simultaneously analyzing gene expression across two species takes into account the biological similarity between different organisms while identifying genes that could be potential prognostic mark-ers and increase the power to detect differences. Identifi-cation of the relevant genes and a better understanding of the associated molecular pathways may open new possi-bilities in cancer diagnosis and treatment. Furthermore, it may become a practical assay for newly diagnosed patients to optimize their clinical management.
In this case study, the application of the proposed nine-component mixture model successfully reduced the quantities of variables (genes) needed to be investigated for the study of two types of DLBCL in humans. The dimension of variables decreased from 6,566 to 21, a clus-ter of genes that were identified as being differentially expressed in both species. On the other hand, an anal-ysis of data from one species that selected genes using a specified FDR led to a much longer list of differen-tially expressed human genes (935 genes with FDR = 0.01 and 190 with FDR = 0.00001). Furthermore, the misclas-sification rate for human cancer type clasmisclas-sification using clustering with gene expression from these 21 genes iden-tified by the bivariate mixture model was remarkably low. The survivorship of the patients stratified according to this clustering was very different across the two types of cancer, indicating that the stratification based on gene-expression profiling using the proposed nine-component mixture model provided better insight for the clinical differences between the two types of cancer.
While validating the relevance of the identified human genes through NCBI’s database, literature, if any, for the corresponding dog orthologs were also searched. Far less research about DLBCL has been conducted for canines.
As the model assumption is based on the biological mechanism behind humans and animals, the promising DLBCL classification results based on the human genes may be extended to dogs. Furthermore, currently, direct experiments on humans are not practical. This research provides the possibility for scientists to conduct observa-tional or experimental research on modeling organisms as the first step to understand phenotypes, and then extend the findings to humans for further investigation.
Abbreviations
DLBCL, diffuse large-B-cell lymphoma; GCB DLBCL, germinal-center B-cell-like diffuse large-B-cell lymphoma; ABC DLBCL, activated B-cell-like diffuse large-B-cell lymphoma.
Competing interests
The authors declare that they have no competing interests.
Authors’ contributions
All authors read and approved the final manuscript.
Acknowledgements
The authors thank Dr. Steven Suter, professor of clinical sciences and Dr. Matthew Breen from the College of Veterinary Medicine, North Carolina State University for the access to the dog lymphoma expression data.
Author details
1Dr. Su’s Statistics, Department of Human Nutrition, Food, and Animal Sciences, University of Hawaii at Manoa, Honolulu, HI 96822, USA. 2Bioinformatics Research Center, North Carolina State University, Raleigh, NC 27695, USA.3Biomarker and Predictive Analytics, GlaxoSmithKline, 5 Moore Drive, Research Triangle Park, NC 27709, USA.4Department of Genetic, University of North Carolina, Chapel Hill, NC 27599, USA.5Department of Clinical Sciences, Center for Comparative Medicine & Translational Research, North Carolina State University, Raleigh, NC 27695, USA.6Department of Molecular Biomedical Sciences, College of Veterinary Medicine, North Carolina State University, Raleigh, NC 27695, USA.7Department of Statistics, North Carolina State University, Raleigh, NC 27695, USA.
Received: 9 December 2011 Accepted: 14 November 2012 Published: 5 January 2013
References
1. Lossos I, Czerwinski DK, Alizadeh AA, Wechser MA, Tibshirani R, Botstein D, Levy R:Prediction of survival in diffuse large-B-cell lymphoma based on the expression of six genes.N Engl J Med2004,350:1828–1837. 2. Lenz G, Staudt L:Aggressive lymphomas.N Engl J Med2010,
362:1417–1429.
3. The International Non-Hodgkin’s Lymphoma Prognostic Factors Project:
A predictive model for aggressive non-Hodgkin’s lymphoma.N Engl J Med1993,329:987–992.
4. Shipp MA, Ross KN, Tamayo P, Weng AP, Kutok JL, Aguiar RC, Gaasenbeek M, Angelo M, Reich M, Pinkus GS, Ray TS, Koval MA, Last KW, Norton A, Lister TA, Mesirov J, Neuberg DS, Lander ES, Aster JC, Golub TR:Diffuse large B-cell lymphoma outcome prediction by gene-expression profiling and supervised machine learning.Nat Med2002,8:68–74. 5. Rosenwald A, Wright G, Chan WC, Connors JM, Campo E, Fisher RI,
Gascoyne RD, Muller-Hermelink HK, Smeland EB, Giltnane JM, Hurt EM, Zhao H, Averett L, Yang L, Wilson WH, Jaffe ES, Simon R, Klausner RD, Powell J, Duffey PL, Longo DL, Greiner TC, Weisenburger DD, Sanger WG, Dave BJ, Lynch JC, Vose J, Armitage JO, Montserrat E, Lpez-Guillermo A, et al.:The use of molecular profiling to predict survival after
chemotherapy for diffuse large-B-cell lymphoma.N Engl J Med,
346:1937–1947.
subtypes of diffuse large B-cell lymphoma arise by distinct genetic pathways.Proc Nat Acad Sci USA2008,105:13520–13525.
7. Lenz G, Wright G, Dave SS, Xiao W, Powell J, Zhao H, Xu W, Tan B, Goldschmidt N, Iqbal J, Vose J, Bast M, Fu K, Weisenburger DD, Greiner TC, Armitage JO, Kyle A, May L, Gascoyne RD, Connors JM, Troen G, Holte H, Kvaloy S, Dierickx D, Verhoef G, Delabie J, Smeland EB, Jares P, Martinez A, Lopez-Guillermo A, et al.:Stromal gene signatures in large-B-cell lymphomas.N Engl J Med2008,359:2314–2323.
8. Wright G, Tan B, Rosenwald A, Hurt EH, Wiestner A, Staudt LM:A gene expression-based method to diagnose clinically distinct subgroups of diffuse large B-cell lymphoma.Proc Nat Acad Sci USA2003,
100:9991–9996.
9. Alizadeh AA, Eisen MB, Davis RE, Ma C, Lossos IS, Rosenwald A, Boldrick JC, Sabet H, Tran T, Yu X, Powell JI, Yang L, Marti GE, Moore T, Hudson JJr, Lu L, Lewis DB, Tibshirani R, Sherlock G, Chan WC, Greiner TC, Weisenburger DD, Armitage JO, Warnke R, Levy R, Wilson W, Grever MR, Byrd JC, Botstein D, Brown PO, Staudt LM, et al.:Distinct types of diffuse large B-cell lymphoma identified by gene expression profiling.Nature2000,
403:503–511.
10. Eisen M, Spellman PT, Brown PO, Botstein D:Cluster analysis and display of genome-wide expression patterns.Proc Nat Acad Sci USA
1998,95:14863–14868.
11. Golub T, Slonim DK, Tamayo P, Huard C, Gaasenbeek M, Mesirov JP, Coller H, Loh ML, Downing JR, Caligiuri MA, Bloomfield CD, Lander ES:Molecular classification of cancer: class discovery and class prediction by gene expression monitoring.Science1999,286:531–537.
12. Blenk S, Engelmann J, Weniger M, Schultz J, Dittrich M, Rosenwald A, Mller-Hermelink HK, Mller T, Dandekar T:Germinal center B cell-like (GCB) and activated B cell-like (ABC) type diffuse large B cell lymphoma (DLBCL): analysis of molecular predictors, signatures, cell cycle state and patient survival.Cancer Inform2007,3:399–420. 13. Smyth G:Linear models and empirical Bayes methods for assessing
differential expression in microarray experiments.Stat Appl Genet Mol Biol2004,3:3.
14. Sonnhammer E, Koonin E:Orthology, paralogy and proposed classification for paralog subtypes.TIG2002,18:619–620. 15. McLachlan G, Basford K:Mixture models: inference and applications to
clustering. New York: Marcel Dekker; 1988.
16. McLachlan G, Peel D:Finite mixture models. New York: Wiley; 2000. 17. Efron B:Bootstrap methods: another look at the jackknife.Ann Stat
1979,7:1–26.
18. Efron B:Better bootstrap confidence intervals.J Am Stat Assoc1987,
82:171–185.
19. Barrett T, Troup DB, Wilhite SE, Ledoux P, Rudnev D, Evangelista C, Kim IF, Soboleva A, Tomashevsky M, Marshall KA, Phillippy KH, Sherman PM, Muertter RN, Edgar R:NCBI GEO: archive for high-throughput functional genomic data.Nucl Acids Res2009,37:D885—D890. 20. Lachenbruch P, Mickey M:Estimation of error rates in discriminant
analysis.Technometrics1968,10:1–11.
21. Benjamini Y, Hochberg Y:Controlling the false discovery rate: a practical and powerful approach to multiple testing.J Roy Statist Soc Ser B1995,57:289–300.
22. MacQueen J:Some methods for classification and analysis of multivariate observations.InProceedings of Fifth Berkeley Symposium on Math Statistics and Probability. Statistics. Berkeley: 1965 June 21-July 18, Statistical Laboratory of the University of California; 19651:281–297 . 23. SAS:SAS onlineDoc® 9.1.3.(2002-2008) Available at http://support.sas.
com/onlinedoc/913.
24. Dempster A, Laird N, Rubin D:Maximum likelihood from incomplete data via the EM algorithm.J Roy Statist Soc Ser B1977,39:1–38. 25. Kaplan E, Meier P:Nonparametric estimation from incomplete
observations.J Am Stat Assoc1958,53:457–481.
26. Mantel N:Evaluation of survival data and two new rank order statistics arising in its consideration.Cancer Chemother Rep1966,
50:163–170.
27. Maglott D, Ostell J, Pruitt KD, Tatusova T:Entrez Gene: gene-centered information at NCBI.Nucl Acids Res2007,35:D26—D31.
28. Spanevello R, Mazzanti CM, Schmatz R, Thom G, Bagatini M, Correa M, Rosa C, Stefanello N, Bell LP, Moretto MB, Oliveira L, Morsch VM, Schetinger MR:
The activity and expression of NTPDase is altered in lymphocytes of multiple sclerosis patients.Clin Chim Acta2009,411:210–214.
29. Behrens T, Kearns GM, Rivard JJ, Bernstein HD, Yewdell JW, Staudt LM:
Carboxyl-terminal targeting and novel post-translational processing of JAW1, a lymphoid protein of the endoplasmic reticulum.J Biol Chem1996,271:23528–23534.
30. Tedoldi S, Paterson JC, Cordell J, Tan SY, Jones M, Manek S, Dei Tos, A P, Roberton H, Masir N, Natkunam Y, Pileri SA, Facchetti F, Hansmann ML, Mason DY, Marafioti T:Jaw1/LRMP, a germinal centre-associated marker for the immunohistological study of B-cell lymphomas.J Pathol2006,209:454–463.
31. Natkunam Y, Zhao S, Mason DY, Chen J, Taidi B, Jones M, Hammer AS, Hamilton Dutoit, S, Lossos IS, Levy R:The oncoprotein LMO2 is expressed in normal germinal-center B cells and in human B-cell lymphomas.Blood2007,109:1636–1642.
32. Morton LM, Purdue MP, Zheng T, Wang SS, Armstrong B, Zhang Y, Menashe I, Chatterjee N, Davis S, Lan Q, Vajdic CM, Severson RK, Holford TR, Kricker A, Cerhan JR, Leaderer B, Grulich A, Yeager M, Cozen W, Hoar Zahm, S, Chanock SJ, Rothman N, Hartge P:Risk of non-Hodgkin lymphoma associated with germline variation in genes that regulate the cell cycle, apoptosis, and lymphocyte development. Cancer Epidemiol Biomarkers Prev2009,18:1259–1270.
33. Durnick D, Law ME, Maurer MJ, Natkunam Y, Levy R, Lossos IS, Kurtin PJ, McPhail ED:Expression of LMO2 is associated with t(14;18)/IGH-BCL2 fusion but not BCL6 translocations in diffuse large B-cell lymphoma. Am J Clin Path2010,134:278–281.
34. Han J, Huang NN, Kim DU, Kehrl JH:RGS1 and RGS13 mRNA silencing in a human B lymphoma line enhances responsiveness to chemoattractants and impairs desensitization.J Leukoc Biol2006,
79:1357–1367.
35. Banham A, Connors JM, Brown PJ, Cordell JL, Ott G, Sreenivasan G, Farinha P, Horsman DE, Gascoyne RD:Expression of the FOXP1 transcription factor is strongly associated with inferior survival in patients with diffuse large B-cell lymphoma.Clin Cancer Res2005,11:1065–1072. 36. Goatly A, Bacon CM, Nakamura S, Ye H, Kim I, Brown PJ,
Ruskon-Fourmestraux A, Cervera P, Streubel B, Banham AH, Du MQ:
FOXP1 abnormalities in lymphoma: translocation breakpoint mapping reveals insights into deregulated transcriptional control. Mod Pathol2008,21:902–911.
37. Korac P, Dominis, M:Prognostic markers and gene abnormalities in subgroups of diffuse large B-cell lymphoma: single center experience.Clin Sci2008,49:618–624.
38. Nyman H, Jerkeman M, Karjalainen-Lindsberg ML, Banham AH, Lepp¨a S:
Prognostic impact of activated B-cell focused classification in diffuse large B-cell lymphoma patients treated with R-CHOP.Mod Pathol2009,22:1094–1101.
39. Tzankov A, Zlobec I, Went P, Robl H, Hoeller S, Dirnhofer S:Prognostic immunophenotypic biomarker studies in diffuse large B cell lymphoma with special emphasis on rational determination of cut-off scores.Leuk Lymphoma2010,21:902–911.
doi:10.1186/1479-7364-7-2