R E S E A R C H
Open Access
Isoform level expression profiles provide better
cancer signatures than gene level expression
profiles
ZhongFa Zhang
1, Sharmistha Pal
1, Yingtao Bi
1, Julia Tchou
2and Ramana V Davuluri
1*Abstract
Background:The majority of mammalian genes generate multiple transcript variants and protein isoforms through alternative transcription and/or alternative splicing, and the dynamic changes at the transcript/isoform level between non-oncogenic and cancer cells remain largely unexplored. We hypothesized that isoform level
expression profiles would be better than gene level expression profiles at discriminating between non-oncogenic and cancer cellsgene level.
Methods:We analyzed 160 Affymetrix exon-array datasets, comprising cell lines of non-oncogenic or oncogenic tissue origins. We obtained the transcript-level and gene level expression estimates, and used unsupervised and supervised clustering algorithms to study the profile similarity between the samples at both gene and isoform levels.
Results:Hierarchical clustering, based on isoform level expressions, effectively grouped the non-oncogenic and oncogenic cell lines with a virtually perfect homogeneity-grouping rate (97.5%), regardless of the tissue origin of the cell lines. However, gene levelthis rate was much lower, being 75% at best based on the gene level
expressions. Statistical analyses of the difference between cancer and non-oncogenic samples identified the existence of numerous genes with differentially expressed isoforms, which otherwise were not significant at the gene level. We also found that canonical pathways of protein ubiquitination, purine metabolism, and breast-cancer regulation by stathmin1 were significantly enriched among genes thatshow differential expression at isoform level but not at gene level.
Conclusions:In summary, cancer cell lines, regardless of their tissue of origin, can be effectively discriminated from non-cancer cell lines at isoform level, but not at gene level. This study suggests the existence of an isoform signature, rather than a gene signature, which could be used to distinguish cancer cells from normal cells.
Background
The past decade has witnessed unprecedented develop-ments in high-throughput technologies, and their appli-cation has led to the molecular classifiappli-cation of many cancers [1]. Molecular profiling of gene expression, using microarrays, has shown that heterogeneity in outcome and survival of patients with cancer can be explained, in part, by genomic variation within the primary tumor. These technologies have helped identify many genetic and epigenetic modifications involved in the initiation
and progression of various cancers, but their precise molecular mechanisms remain unclear. Furthermore, novel drugs have been developed to target some of the molecular pathways underlying the carcinogenic pro-cesses and maintenance of cancer phenotypes [2,3] yet, these drugs have provided limited survival benefits to only a small subset of patients with cancer, and only a small number of practically useful biomarkers are pre-sently available. Improved molecular classification of can-cers is essential to identify highly sensitive and specific biomarkers and therapeutic targets that reflect the mole-cular mechanisms functionally involved in tumor type-specific survival, drug resistance, tumor relapse, and patient outcome [4].
* Correspondence: [email protected]
1
Center for Systems and Computational Biology, Molecular and Cellular Oncogenesis Program, The Wistar Institute, Philadelphia, PA 19104, USA Full list of author information is available at the end of the article
One of the reasons for the limited success in the quest for genomic-based, personalized medicine is the assump-tion of a‘one gene®one protein®one functional
path-way’ paradigm in most of the studies investigating
molecular classification or therapeutic targets for cancer [5]. Recently, by making use of chromatin immunoprecipi-tation sequencing (ChIP-seq) and mRNA sequencing (mRNA-seq) approaches, we and others have discovered widespread use of alternative promoters and alternative splicing in mammalian genes in various tissues, develop-mental stages, and cell lines [6-9]. In fact, numerous genes displaying complex gene regulation via use of alternative promoters and alternative splicing, have been known for some time, and recent evidence suggests that almost all multi-exon human genes have more than one mRNA isoform. During alternative splicing, the coding and non-coding regions of a single gene are rearranged to generate several messenger RNA transcripts, yielding distinct pro-tein isoforms with differing biological functions. Notably, there is growing evidence linking aberrant use of alterna-tive mRNA isoforms with cancer formation; several
onco-genes and tumor-suppressor onco-genes (for example,LEF1,
TP63, TP73, HNF4A, RASSF1, andBCL2L1) are already known to have multiple promoters and alternative splice forms [10-16]. Moreover, it is known that the aberrant use of one isoform over another in some of these genes is directly linked to cancer cell growth [17]. Although the prevalence of alternative splicing in cancer genomes has been discussed in the literature [18-20], and it has been shown that use of splice forms provides better classifica-tion of normal and cancerous prostate tissue, it is not clear whether the use of genome-wide isoform level gene-expression profiles can provide a better global discrimina-tive signature for cancer and normal cells.
Microarray expression profiling remains a powerful tool for identifying different subtypes of cancers. However, almost all microarray-based studies reported to date have measured the expression of the gene at gene level in a given locus, although a few exceptions in recent years have used exon arrays to measure differences at the exon and/or at transcript variant level. The recent application of exon arrays [21] and the advent of massive parallel sequencing is allowing whole cancer genomes and tran-scriptomes to be sequenced with extraordinary speed and accuracy, providing insight into the bewildering complex-ity of isoform level expression of gene transcripts [7]. The Encyclopedia of DNA Elements (ENCODE) consortium, a collective effort to facilitate and accelerate the annotation of functional elements in the human genome, is generating genome-wide expression data in various human cell lines through the use of exon microarrays [20]. Among the available data are gene-expression datasets, generated by the ENCODE consortium using an Affymetrix platform (GeneChip Human Exon 1.0 ST Array), across various cell
lines that can be classified as either oncogenic (tumor/ cancer) or non-oncogenic (normal). The arrays interrogate transcripts across their entire length, which can detect splicing differences between various types of samples [22-24]. Exons within a gene are represented on the microarray by multiple probe sets. The exon expression can thus be obtained by summarizing all the probe sets for this exon on the microarray. Once the exon-level expres-sions are obtained, the individual transcript expression of the gene and the total expression of the gene itself then can be inferred from the calculated exon expression, based on assumptions that the isoform structures and number of isoforms of the gene are known beforehand.
With genome-wide isoform level and gene level expres-sion profiles in hand, it is natural to ask how the isoform level expression profiles of different oncogenic and non-oncogenic samples will cluster together, and whether iso-form level expression profiles can lead to more accurate discriminators between oncogenic and non-oncogenic samples compared with gene level expression profiles. If the answer is yes, it is important to know which genes and pathways contribute to the improvement of discrimination at isoform level compared with gene level.
In the present study we analyzed Affymetrix exon-array data-sets collected from the public domain, primarily the ENCODE project from the National Center for Biotech-nology Information (NCBI) Gene Expression Omnibus (GEO) database, which comprises 160 datasets from var-ious cell lines of either non-oncogenic or oncogenic tissue origin. These data-sets were used to test the hypothesis that isoform level expression analysis provides abetter dis-criminator between non-oncogenic and oncogenic cell types than gene level expression analysis.
Methods
Summary of exon-array datasets
the second matched non-oncogenic and oncogenic pair. The complete classification and labeling information of cell lines used in this study are summarized in the sup-plementary information (see Additional file 1: Table S1).
Estimation of isoform level and gene level expression values from exon-array data
The isoform level (transcript-level) and gene level expres-sion estimates were obtained by the Multi-Mapping Baye-sian Gene eXpression (MMBGX) algorithm for Affymetrix whole-transcript arrays [28], based on the Ensembl data-base (version 56) [29], which contains a total of 114,930 different transcript annotations that correspond to 35,612 different gene models. We set the burn-in iteration at 8,192 and real iteration at 16,384 for both gene and iso-form levels. All other parameters were set to their default values in the stand-alone algorithm. The algorithm gave a stable estimation of both gene level and isoform level expressions. For example, two independent runs on the same sample provided almost identical expression levels even with different seeds for the algorithm (correlation coefficient > 0.999, data not shown), whereas runs on dif-ferent samples gave comparable results, but with much lower correlation (correlation coefficient of about 0.97). Expression estimates across all the samples were then nor-malized using the locally weighted scatterplot smoothing (loess) algorithm [30,31], also incorporated in the package.
Clustering and pathway analyses
We used the general hierarchical cluster algorithm to clus-ter the samples, using Euclidean distance as a measure-ment for dissimilarities [32]. We also applied consensus hierarchical clustering to assess the stability of the cluster-ing results by multiple runs of the clustercluster-ing algorithm on resampled data [32,33], and calculated consensus index as reported previously [33]. Briefly, the consensus index is defined for each pair of samples, that is, the consensus index of sample pair (i, j) records the number of times that samples i and j are assigned to the same cluster, divided by the total number of times both samples are selected. To find the differential genes between two conditions, we
used thelimmamethod [34,35]. An isoform or gene was
selected if both its fold change was greater than a cut-off value of 2, and the false discovery rate (FDR)-adjustedP value was smaller than a cut-off value of 0.01 for all com-parisons between the two conditions. Ingenuity Pathway Analysis (IPA) [36] was used to associate the identified gene sets with biological functions, canonical pathways, and networks. To identify pathway differences arising from gene sets identified at either isoform or gene level, we used the counting method on thePvalues of pathways from the IPA analysis; thePvalues were used as an indica-tor of association strength between the gene sets and path-ways. For the three pairwise oncogenic/non-oncogenic
comparisons (all oncogenic cell lines versus non-oncogenic cell lines, melanocyte versus melanoma, HMEC versus MCF7), a pathway was selected and reported if it was significantly associated with the gene sets identified at isoform-level in all three pairs of comparisons, but was not significantly associated with the gene sets identified at gene-level in all three pairs of comparisons, orvice versa. The significance level was set atP< 0.05 for all compari-sons. All calculations were performed using Bioconductor (version 2.8 or above; Open Source software for bioinfor-matics, http://www.bioconductor.org) and R platform (version 2.10; The R Project for Statistical Computing, http://www.r-project.org) [37].
Ethics approval
The study protocol was approved by the institutional review board, and all data collection and analyses adhered to the protocols approved by the institutional review board. Informed consent was obtained from all participants.
Clinical characteristics of study cohort
Women with primary operable breast cancer undergoing breast surgery at the Hospital of the University of Penn-sylvania were asked to participate in our tissue-banking protocol. The study cohort included four women diag-nosed with breast cancer between 2010 and 2011. Clini-cal characteristics, including age at diagnosis, ethnicity, histology, tumor size, tumor grade, and number of involved (positive) axilla nodes are provided (see Addi-tional file 2: Table S2A).
Sample collection
After completion of surgery, the breast cancer within the surgical specimen was examined by surgical patholo-gists. Upon completion of gross examination and inking of the tumor specimen, fresh tumor tissue was taken from the center of the tumor without interfering with margin assessment as determined by the pathologists. A small portion of the tumor tissue and a small portion of normal adjacent breast tissue were collected, then immediately immersed in liquid nitrogen and stored at -80°C. RNA was isolated using this snap-frozen tumor tissue.
RNA isolation and reverse transcriptase-quantitative PCR experiment
For breast-cancer and normal breast tissues, up to 50 mg of frozen tissue was transferred to 1 ml of TRI reagent, then the tissue was immediately homogenized and RNA extraction protocol was followed. Briefly, 0.5μg of total
RNA was reverse-transcribed in a 20 μl reaction with
SuperscriptII reverse transcriptase (Invitrogen Inc.) in accordance with the manufacturer’s instructions. RT-qPCR was performed using a master mix (Power SYBR Green; Applied Biosystems Inc., Foster City, CA, USA) and fold expression was calculated using the 2-ΔΔCTmethod. RT-qPCR results were normalized based on the expression ofGAPDHforTPM4andTBPfor the other transcripts. The measured isoforms and the primers used for the iso-form-specific PCR are presented (see Additional file 2: Table S2B).
Results
Clustering of samples using isoform level expression estimates provided more homogeneous grouping than gene level expression estimates of oncogenic and non-oncogenic cell lines gene level
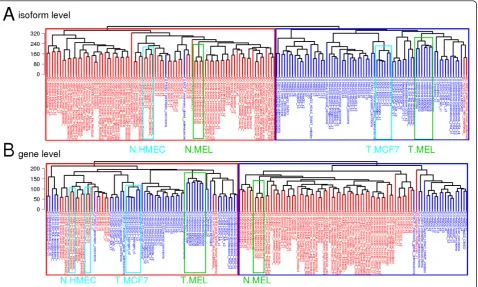
Initial processing of the exon-array datasets generated expression estimates for a total of 114,930 different transcripts and 35,612 different genes in 160 different datasets or samples. To test our hypothesis that the iso-form level expression profiles are better than the gene level expression profiles at discriminating non-oncogenic and cancer cellsgene level, we performed unsupervised clustering of 160 samples. Hierarchical clustering was performed by selecting the transcripts/genes showing the most variable expression, as determined by coeffi-cient of variation for the estimated isoform-/gene level expression values across all samples. The dendrograms showed more homogeneous clustering of samples for isoform level expression analysis (Figure 1A) than for gene level expression analysis (Figure 1B). Similar clus-tering results were obtained by selecting different sets of the isoforms/genes with the greatest variation (see Addi-tional file 3: Figures S1 and S2).
We expected the clustering of samples to result in a first-level grouping of different tissues, followed by a sec-ond-level grouping of cancer and non-oncogenic cell lines within each tissue type. Unexpectedly, however, we found almost uniform grouping of cancer and non-oncogenic cell lines into two large clusters, with an overall cluster purity of 97.5% at isoform level (Figure 1A). Further, the samples belonging to same cell/tissue type within each cancer/non-oncogenic group were clustered together, con-firming the discriminatory power of isoform level gene-expression profiles. For example, the paired non-onco-genic melanocyte and cancerous melanoma samples, and the matched pairs of MCF7 (breast-cancer cell line) and the HMEC samples (non-oncogenic origin) were separated correctly into either non-oncogenic or cancer groups, with
one exception from MCF7 samples (Figure 1A). Overall, only four samples, two each from non-oncogenic and cancer cell lines, were clustered into the wrong group. The cancer cell lines that were clustered into the non-oncogenic group were one MCF7/mammary gland adeno-carcinoma (GEO accession number GSM472936) and one pancreatic carcinoma cell line (GEO GSM472939), and the non-oncogenic samples that were assigned to the cancer group were one adult non-oncogenic human epi-dermal keratinocyte (NHEK) sample (GEO GSM472937) and one non-oncogenic umbilical vein endothelial cell (HUVEC) sample (GEO GSM472935).
Although the clustering at gene-level showed some power of discrimination between non-oncogenic and cancer cell lines, the overall grouping was significantly less efficient than the clustering at isoform-level. The gene level cluster purity was 75%, with 20 samples from the non-oncogenic and cancer cell lines clustered into the wrong group (Figure 1B). The better separation of non-oncogenic and cancer cell lines at isoform-level (97.5% cluster purity) compared with gene -(75% cluster purity) implies that gene-expression profiles in cancer cells are more specifically altered at isoform-level for numerous genes, which could not be detected using gene level analysis.
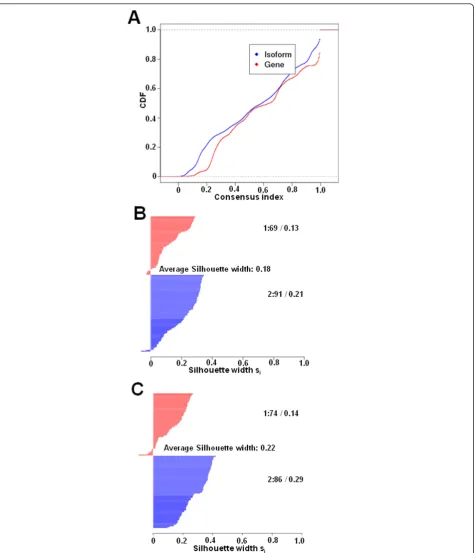
We also appliedconsensus hierarchical clustering to compare the stability of the isoform-based approach to the gene-based approach [33,38]. The empirical cumulative distribution function (CDF) plot of the consensus index (Figure 2A) indicated that isoform-based clustering gives more stable results than gene-based clustering. We further plotted the silhouette width for isoform-based and gene-based clustering (Figure 2B and 2C, respectively) [39]. The larger silhouette width of one sample indicates higher similarity to its own group than to any other group mem-ber. The average silhouette width for isoform-based clus-tering was 0.22, which was larger than the gene-based width of 0.18, indicating that the clustering based on iso-forms is more homogenous than that based on genes.
We next focused our analysis on two specific cancers, breast cancer, and melanoma, for which we had matched oncogenic and non-oncogenic cell lines, in addition to the comparison of all oncogenic versus all non-oncogenic cell lines.
Transcript variants of numerous genes were differentially expressed between non-oncogenic and cancer cell lines
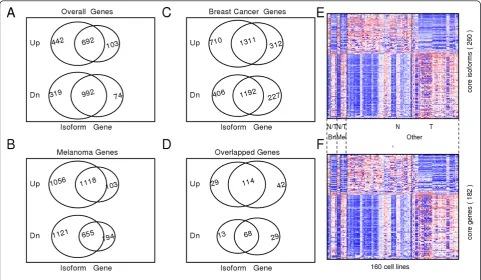
After performing the three comparisons independently, we overlapped the identified gene sets to identify those genes or gene isoforms that were consistently upregu-lated or downreguupregu-lated in cancer compared with non-oncogenic cell lines (see Additional file 7, Table S6). We denoted the genes that were found to be significantly dif-ferent between non-oncogenic and cancer groups in all the three comparisons as the core set of genes/gene iso-forms (Figure 3D). Interestingly, we found numerous genes that were significantly differentially expressed at isoform level but not at gene level. A gene was declared as differentially expressed at isoform level if at least one of its isoforms showed significant differential expression between non-oncogenic and cancer groups. For example, 29 and 13 genes were found to be significantly upregu-lated and downreguupregu-lated, respectively, at isoform level but not at gene-level in all three pairwise comparisons (Figure 3D). Overall, we found a total of 260 different transcript variants or gene isoforms (Figure 3E) of 182 unique genes (Figure 3F) that had significant gene-expression differences at either isoform or gene level.
In each pair of comparisons, of the total genes identified to be significant at isoform level, at least 30% (range from 30% to 55%) were found to be significant only at isoform level. In other words, more than one isoforms of these genes displayed differential expression between non-oncogenic and cancer samples, but the gene-level expres-sion differences were cancelled out by the combined effect of various isoforms of the same gene. These genes dis-played alternate splicing between non-oncogenic and can-cer cell lines. This observation strongly supports previous reports such as that by David and Manley [18]. For
exam-ple, theMITF(micro-ophthalmia transcription factor)
gene uses at least nine different promoters and first exons to generate a remarkably diverse set of mRNAs and pro-tein isoforms that differ at the N-terminus. The gene plat-form we used (Affymetrix GeneChip Human Exon 1.0 ST Array) has probe sets corresponding to 16 different tran-script variants of this gene, based on Ensembl gene
anno-tations. The alternative promoters ofMITFreflect the
tissue specificity of its isoforms, which are selectively expressed in melanocytes, macrophages, osteoclasts, heart
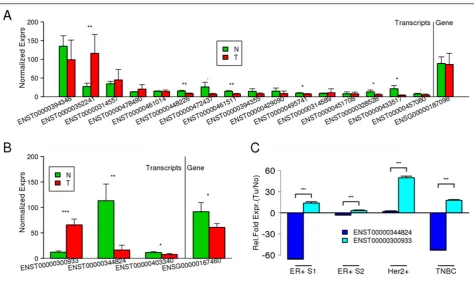
muscle, or retinal pigmented epithelium.MITF, generally believed to play a primary role in melanocyte stem-cell proliferation and expression of a set of pigment-related genes [40], has been shown to be amplified in a small per-centage (10 to 20%) of melanomas, and seems to confer a poor prognosis when overexpressed [41]. In the compara-tive analysis between non-oncogenic melanocytes and melanoma cell lines (Figure 3C), no differential expression
ofMITFwas found by the gene level analysis. However,
theMITFisoform ENST00000352241 was found to be
sig-nificantly overexpressed in melanoma compared with mel-anocytes (FC = 3.4), whereas the transcript variants ENST00000433517 (FC = -5.6) and ENST00000472437 (FC = -3.4) were underexpressed in melanoma (Figure 4A). Similarly, theTPM4gene was seen to have weak differen-tial expression in MCF7 compared with HMEC cell lines
samples. However, although one of theTPM4isoforms
(ENST0000030933) was found to be strongly overex-pressed (FC = 5.47), another isoform (ENST00000344824) was found to be significantly underexpressed in MCF7 samples (FC = -7.75) (Figure 4B). These two isoforms thus
cancelled each other out, resulting in the overall gene expression not being significantly different between the
non-oncogenic and oncogenic cell lines.TPM4has been
reported to be differentially expressed in breast cancer [42]. Our analysis suggests that whereas gene level expression estimates ofTPM4andMITFcontribute little to the discri-mination of cancer cell lines from non-oncogenic cells, expression estimates specific to one or more isoforms of these genes have a better discriminating power. Interest-ingly, we found a total of 294 isoforms, corresponding to 110 genes in melanoma (see Additional file 6: Table S5), and 75 transcript isoforms, corresponding to 16 genes in breast cancer (see Additional file 5: Table S4), that showed opposing expression patterns at isoform level.
Experimental validation of differentially expressed transcript variants in breastcancer cell lines and samples
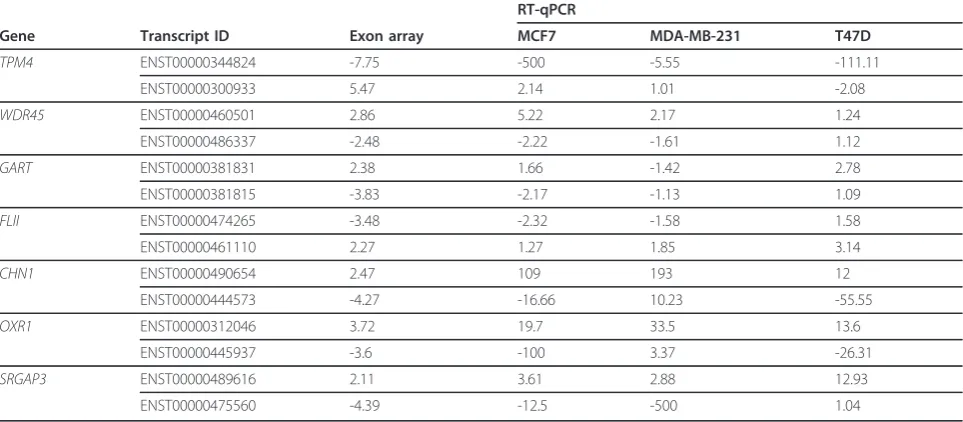
To validate the existence of the opposing expression patterns of isoforms for various genes, we measured iso-form expression by RT-qPCR for two opposing isoiso-forms of seven genes in three breastcancer cell lines relative to
the non-oncogenic HMEC cell line (Tables 1). The expression pattern of isoforms obtained from exon-array and RT-qPCR experiments were similar for all seven genes in MCF7 cell lines. However, in the case of MDA-MB-231 and T47D cell lines isoforms of four and two of the seven genes, respectively had an expression pattern similar to that seen in the exon-array data for MCF7. To further validate opposing transcript expres-sion in patient samples between non-oncogenic and can-cer tissues, we selected theTPM4gene in breast cancer as an example. The opposing expression patterns of the
TPM4isoforms were confirmed in the estrogen
receptor-positive and triple-negative breast cancer sample. Although the Her2+ sample did not show the opposing pattern of expression, one isoform had the significantly highest fold change of all the samples (Figure 4C). In all samples, the simple Student t-test results between the averaged fold expressions of the two isoforms were all sig-nificant (P< 0.001). These results strongly support our
hypothesis that isoforms of multi-transcript genes can have opposing roles in cancer.
Supervised analysis identified an isoform set able to separate the tumor lines from normal lines in an almost perfect pattern
We performed IPA (version 6.0; Ingenuity®Systems, Red-wood City, CA, USA) [36] to find significant molecular functional categories enriched in the differentially expressed gene sets, and transformed the target genes into a set of relevant networks by using literature-based records that are maintained in the IPA Base. We first performed this analysis using the core gene set of 182 genes that were consistently up-regulated or downregulated in cancer cell lines (Figure 3F). The analyses found 10 molecular and cellular functions that were significantly enriched in the core gene set (see Additional file 8: Table S7). Interest-ingly, the top five molecular and cellular functions
identi-fied by IPA were ‘Role of BRCA1 in DNA damage
response’,‘Mitotic roles of Polo-like kinase’,‘Hereditary breast cancer signaling’,‘Role of CHK proteins in cell cycle checkpoint control’, and‘Cell cycle: G2/M DNA
damage checkpoint regulation’, which are frequently
deregulated in cancer initiation and progression. There-fore, we considered that the core genes involved in these pathways might also be useful to effectively separate can-cer from non-oncogenic samples. To test this hypothesis, we repeated the clustering analysis, using the core genes and their isoforms that belonged to the five most signifi-cant pathways (Figure 5). The clustering analysis per-formed by filtering out the isoforms for which there was relatively little variation in expression estimates across all the samples produced an almost identical result (18 iso-forms, corresponding to 14 unique genes, Figure 5A) to that obtained by using all the gene isoforms (Figure 1A). However, at gene level, the clustering based on these 14 genes produced a comparable result, but with relatively lower cluster purity (92.5%, or 12 of 160 cell lines were grouped in the wrong cluster) than at isoform level (97.5% or 4 of 160 were grouped in the wrong cluster) (Figure 5B).
These 14 genes are WNT5B, CCND2, SERPINB7,
GPR176, INHBA, EFNB1, PTRF, CDH11, ZBTB16, GJA1, COL5A2, NID1, PRDM1, and TCF4. Except for
CCND2 and GPR176, all other genes in our database
have more than one isoform. Four genes (SERPINB7,
INHBA, GJA1, andNID1) have two isoforms that have significantly different expression between the cancer and non-oncogenic groups. Interestingly, 12 of these 14 genes belong to the same gene network, involved in hematological system development and function, tissue morphology, and cellular development. According to the
Ingenuity Pathway Knowledge Base, the network con-sists of a total of 27 different genes, which suggests that almost 50% of the genes belonging to this network are dysregulated either at the gene or isoform level between non-oncogenic and cancer cells (Figure 5C). Moreover, most of these genes have already been implicated both in tumorigenesis and in several developmental processes [43-48]. For example, it was shown that the phosphoryla-tion-dependent interaction between c-Jun and TCF4 regu-lates intestinal tumorigenesis by integrating c-Jun kinase (JNK) and adenomatous polyposis coli (APC)/b-catenin, two distinct pathways activated by Wnt signaling [49]. Multiple alternatively spliced transcript variants that may encode different protein isoforms of these genes (for
example,TCF4, WNT5B) have been described. Therefore,
it would be interesting to evaluate the components of this gene network in different cancers at isoform level.
Gene level and isoform level analyses identified interesting pathways associated with cancer
To test whether the genes that are differentially expressed at isoform level but not at gene level could reveal interesting pathways associated with cancer, we focused the pathway-enrichment analysis on two differ-ent gene sets: 1) genes that are significant at isoform level only and 2) genes that are significant at gene level only Figure 3A-C; genes without overlaps in the middle). We performed this analysis separately for each of the three comparisons (all cancer versus all non-oncogenic; HMEC versus MCF7; and melanocytes versus melanoma cell- lines) between the non-oncogenic and cancer pairs. This analysis led to the identification of three canonical Table 1 Isoform expression in breast-cancer cell lines as measured by reverse transcriptase -quantitative PCR (RT-qPCR).
RT-qPCR
Gene Transcript ID Exon array MCF7 MDA-MB-231 T47D
TPM4 ENST00000344824 -7.75 -500 -5.55 -111.11
ENST00000300933 5.47 2.14 1.01 -2.08
WDR45 ENST00000460501 2.86 5.22 2.17 1.24
ENST00000486337 -2.48 -2.22 -1.61 1.12
GART ENST00000381831 2.38 1.66 -1.42 2.78
ENST00000381815 -3.83 -2.17 -1.13 1.09
FLII ENST00000474265 -3.48 -2.32 -1.58 1.58
ENST00000461110 2.27 1.27 1.85 3.14
CHN1 ENST00000490654 2.47 109 193 12
ENST00000444573 -4.27 -16.66 10.23 -55.55
OXR1 ENST00000312046 3.72 19.7 33.5 13.6
ENST00000445937 -3.6 -100 3.37 -26.31
SRGAP3 ENST00000489616 2.11 3.61 2.88 12.93
ENST00000475560 -4.39 -12.5 -500 1.04
pathways (protein ubiquitination, purine metabolism, and breast-cancer regulation by stathmin1) that were significantly enriched in isoform level gene sets, but not in gene level gene sets (Figure 6).
Discussion
Human cancer is a complex disease. It is known that most of the genes in mammalian genomes generate different transcript variants and protein isoforms, which often func-tion in a cell/tissue type-specific and developmental stage-specific manner in non-oncogenic cells. Cancer results from the sequential acquisition of a number of genetic and epigenetic alterations, and these mutations may alter the expression of specific isoforms but not the others of a gene. Despite this growing knowledge, most biomarker and drug-discovery studies still evaluate expression differ-ences and study gene regulatory mechanisms at gene level rather than at isoform level. In this study, we have shown that oncogenic cell lines could be more accurately discri-minated from non-oncogenic cell lines, regardless of their cells of origin, by gene-expression profiling at isoform level compared with gene level. In spite of the differences
in tissues of origin, the cell lines were broadly clustered into two groups, non-oncogenic and oncogenic, by iso-form level gene-expression profiles. We noted that numer-ous genes showed differential expression at isoform level but not at gene level. For some of these genes, the differ-ential expression of alternative transcripts occurred in the opposite direction; while some of the isoforms of the same gene were upregulated, others were downregulated, result-ing in them cancellresult-ing each other out and producresult-ing insig-nificant expression differences at gene level between cancer and non-oncogenic groups. Our findings are in agreement with a previous study on prostate cancer that investigated the expression of 1532 splice forms for 364 prostate cancer-related genes, using data from a custo-mized exon junction array [20]. The authors found that many genes were differentially expressed at splice-form level but not at gene level and this increase in the number of differentially expressed variables at splice-form level contributed to a 92% accuracy for a 128 splice-form-based classifier for normal and cancerous prostate tissue, whereas the accuracy was 87% using a classifier based on 32 genes. That study profiled 1532 mRNA splice forms
from 364 potential prostate cancer-related genes, whereas in the current study, we used genome-wide exon-array data that identified the expression of 114,930 transcripts/ isoforms corresponding to 35,612 different genes, includ-ing all known non-codinclud-ing genes in the Ensembl database. In addition, our study focused on discriminating onco-genic and non-oncoonco-genic cells in general, irrespective of their tissue of origin. Using genome-wide isoform level versus gene-level expression information, we found that oncogenic and non-oncogenic cells could be segregated using isoform level information with 97.5% accuracy ver-sus 75% accuracy for gene level information, and even a smaller signature of 18 isoforms was effective in separating the two groups, with equal accuracy. These subtle differ-ences at isoform level in discriminating non-oncogenic and oncogenic cell lines reflect the fact that gene level expression measurements, whose estimates are generally the summation of all the isoform level expression esti-mates of individual genes, are less accurate in characteriz-ing cancer and non-oncogenic cells.
The pathway-enrichment analysis of genes that are differentially expressed in cancer cell lines at isoform level but not at gene level produced three interesting pathways that have been implicated in various cancers. It is well known that protein phosphorylation and pro-tein ubiquitination regulate most aspects of cell life, and defects in these control mechanisms cause cancer and many other diseases [50]. Similarly, abnormalities in
purine metabolism and over-expression ofStathmin 1
(STMN1) are characteristic features of many human tumors [51,52]. The key genes of these pathways (for
example,STMN1, PNP, RPS27AandUBA52) transcribe
different transcript variants, some of which encode dif-ferent protein isoforms. It is therefore necessary to eval-uate the gene-expression differences and to study gene regulatory mechanisms at isoform level rather than at gene level between non-oncogenic and disease condi-tions, such as cancer. Recent advances in cancer geno-mics have shown that gene-expression signatures are useful for biomarker identification and drug discovery [53]. In this regard, the present study highlights the importance of studying gene-expression signatures at isoform level rather than at gene level, and makes a strong case for isoform level gene/protein-expression profiling methods for improved cancer biomarker and therapeutic discovery.
Conclusions
In conclusion, we have identified a common, isoform level signature that can be used to discriminate effec-tively between cancer and non-cancer cell lines. We found numerous genes for which the differential expres-sion of alternative transcripts occurred in opposing directions, with some of the isoforms of the same gene being upregulated while others were downregulated, resulting in insignificant expression differences at gene level between cancer and non-oncogenic groups. This is supported by our experimental validation of opposing
expression patterns for TPM4gene isoforms in
non-oncogenic and non-oncogenic tissue samples from breast cancer patients. The present study highlights the impor-tance of studying gene-expression signatures at isoform level rather than at gene level in characterizing the can-cer transcriptome.
Additional material
Additional file 1: Supplementary Table S1. Summary of cell lines samples and the exon-array datasets used in this study. Excel document.
Additional file 2: Supplementary methods and Table S2 A and B. Table S2A Clinical characteristics of samples from patients with breast cancer used in this study. Table S2B Primer sequence used for real-time quantitative reverse transcriptase (qRT)-PCR to measure isoform expression. Word document.
Additional file 3: Supplementary Figure S1 and S2. Dendrograms representing hierarchical clustering of 160 (73 oncogenic and 87 non-oncogenic) datasets from cell lines using expression estimates of (Figure
S1) transcripts and (FigureS2) genes at different cut-off points for coefficient of variation (CV). Powerpoint document.
Additional file 4: Supplementary Table S3. List of genes and isoforms differentially expressed between the oncogenic and non-oncogenic cell lines groups (Figure 3A). Excel document.
Additional file 5: Supplementary Table S4. List of genes and isoforms differentially expressed between non-oncogenic HMEC and MCF7 breast-cancer cell lines (Figure 3C). Excel document.
Additional file 6: Supplementary Table S5. List of genes and isoforms differentially expressed between the melanocyte and melanoma cell lines (Figure 3B). Excel document.
Additional file 7: Supplementary Table S6. List of overlapped genes and isoforms consistently upregulated or dow regulated across all three pairs of comparisons (Figure 3D). Excel document.
Additional file 8: Supplementary Table S7. Pathways associated with the top gene networks identified by IPA analysis of core genes. Word document.
Authors’contributions
ZZ designed the computational methods and performed the statistical analyses. SP designed the experimental methods and performed the RT-qPCR experiments. YB performed statistical analyses. JT participated in the design of the study, and provided non-oncogenic breast and oncogenic breast tissue samples. RD and JT formulated and directed the design of the study. ZZ, SP, and RD wrote and edited the manuscript. All authors read and approved the final manuscript.
Competing interests
The authors declare that they have no competing interests.
Acknowledgements
This work was supported by American Cancer Society Research Scholar Grant (number RSG-07-097-01) to RD. RD holds a Philadelphia Healthcare Trust Endowed Chair Position; research in his laboratory is partially supported by the Philadelphia Healthcare Trust. The use of resources in the Bioinformatics Shared Facility of Wistar Institute Cancer Center (grant number P30 CA010815) is gratefully acknowledged. We thank Dr Zhiyan Fu for his reading of the manuscript.
Author details
1Center for Systems and Computational Biology, Molecular and Cellular
Oncogenesis Program, The Wistar Institute, Philadelphia, PA 19104, USA.
2Department of Surgery, Abramson Cancer Center, University of Pennsylvania
School of Medicine, Philadelphia, PA 19104, USA.
Received: 15 January 2013 Revised: 26 March 2013 Accepted: 17 April 2013 Published: 17 April 2013
References
1. Heard E, Tishkoff S, Todd JA, Vidal M, Wagner GP, Wang J, Weigel D, Young R:Ten years of genetics and genomics: what have we achieved and where are we heading?.Nat Rev Genet2010,11:723-733.
2. Boran AD, Iyengar R:Systems approaches to polypharmacology and drug discovery.Curr Opin Drug Discov Devel2010,13:297-309.
3. Janga SC, Tzakos A:Structure and organization of drug-target networks: insights from genomic approaches for drug discovery.Mol Biosyst2009,
5:1536-1548.
4. Swanton C, Caldas C:Molecular classification of solid tumours: towards pathway-driven therapeutics.Br J Cancer2009,100:1517-1522. 5. Feero WG, Guttmacher AE, Collins FS:Genomic medicine–an updated
primer.The New England journal of medicine2010,362:2001-2011. 6. Gupta R, Wikramasinghe P, Bhattacharyya A, Perez FA, Pal S, Davuluri RV:
Annotation of gene promoters by integrative data-mining of ChIP-seq Pol-II enrichment data.BMC Bioinformatics2010,11(Suppl 1):S65. 7. Wang ET, Sandberg R, Luo S, Khrebtukova I, Zhang L, Mayr C, Kingsmore SF,
Schroth GP, Burge CB:Alternative isoform regulation in human tissue transcriptomes.Nature2008,456:470-476.
8. Singer GA, Wu J, Yan P, Plass C, Huang TH, Davuluri RV:Genome-wide analysis of alternative promoters of human genes using a custom promoter tiling array.BMC Genomics2008,9:349.
9. Barrera LO, Li Z, Smith AD, Arden KC, Cavenee WK, Zhang MQ, Green RD, Ren B:Genome-wide mapping and analysis of active promoters in mouse embryonic stem cells and adult organs.Genome Res2008,
18:46-59.
10. Hovanes K, Li TW, Munguia JE, Truong T, Milovanovic T, Lawrence Marsh J, Holcombe RF, Waterman ML:Beta-catenin-sensitive isoforms of lymphoid enhancer factor-1 are selectively expressed in colon cancer.Nat Genet 2001,28:53-57.
11. Nekulova M, Holcakova J, Coates P, Vojtesek B:The role of p63 in cancer, stem cells and cancer stem cells.Cell Mol Biol Lett2011,16:296-327. 12. Tomasini R, Tsuchihara K, Wilhelm M, Fujitani M, Rufini A, Cheung CC,
Khan F, Itie-Youten A, Wakeham A, Tsao MS,et al:TAp73 knockout shows genomic instability with infertility and tumor suppressor functions.Genes Dev2008,22:2677-2691.
13. Wilhelm MT, Rufini A, Wetzel MK, Tsuchihara K, Inoue S, Tomasini R, Itie-Youten A, Wakeham A, Arsenian-Henriksson M, Melino G,et al: Isoform-specific p73 knockout mice reveal a novel role for delta Np73 in the DNA damage response pathway.Genes Dev2010,24:549-560. 14. Eeckhoute J, Moerman E, Bouckenooghe T, Lukoviak B, Pattou F,
Formstecher P, Kerr-Conte J, Vandewalle B, Laine B:Hepatocyte nuclear factor 4 alpha isoforms originated from the P1 promoter are expressed in human pancreatic beta-cells and exhibit stronger transcriptional potentials than P2 promoter-driven isoforms.Endocrinology2003,
144:1686-1694.
15. Richter AM, Pfeifer GP, Dammann RH:The RASSF proteins in cancer; from epigenetic silencing to functional characterization.Biochim Biophys Acta 2009,1796:114-128.
16. Akgul C, Moulding DA, Edwards SW:Alternative splicing of Bcl-2-related genes: functional consequences and potential therapeutic applications.
Cell Mol Life Sci2004,61:2189-2199.
17. Rajan P, Elliott DJ, Robson CN, Leung HY:Alternative splicing and biological heterogeneity in prostate cancer.Nat Rev Urol2009,6:454-460. 18. David CJ, Manley JL:Alternative pre-mRNA splicing regulation in cancer:
pathways and programs unhinged.Genes Dev2010,24:2343-2364. 19. Ghigna C, Valacca C, Biamonti G:Alternative splicing and tumor
progression.Curr Genomics2008,9:556-570.
20. Zhang C, Li HR, Fan JB, Wang-Rodriguez J, Downs T, Fu XD, Zhang MQ:
Profiling alternatively spliced mRNA isoforms for prostate cancer classification.BMC Bioinformatics2006,7:202.
21. Moller-Levet CS, Betts GN, Harris AL, Homer JJ, West CM, Miller CJ:Exon array analysis of head and neck cancers identifies a hypoxia related splice variant of LAMA3 associated with a poor prognosis.PLoS Comput Biol2009,5:e1000571.
22. Clark TA:Discovery of tissue-specific exons using comprehensive human exon microarrays.Genome Biol2007,8:R64.
23. Gardina PJ:Alternative splicing and differential gene expression in colon cancer detected by a whole genome exon array.BMC Genomics2006,
7:325.
24. Kwan T, Benovoy D, Dias C, Gurd S, Provencher C, Beaulieu P, Hudson TJ, Sladek R, Majewski J:Genome-wide analysis of transcript isoform variation in humans.Nat Genet2008,40:225-231.
25. McDaniell R, Lee BK, Song L, Liu Z, Boyle AP, Erdos MR, Scott LJ, Morken MA, Kucera KS, Battenhouse A,et al:Heritable individual-specific and allele-specific chromatin signatures in humans.Science2010,
26. Hansen RS, Thomas S, Sandstrom R, Canfield TK, Thurman RE, Weaver M, Dorschner MO, Gartler SM, Stamatoyannopoulos JA:Sequencing newly replicated DNA reveals widespread plasticity in human replication timing.Proc Natl Acad Sci USA2010,107:139-144.
27. Berger MF, Levin JZ, Vijayendran K, Sivachenko A, Adiconis X, Maguire J, Johnson LA, Robinson J, Verhaak RG, Sougnez C,et al:Integrative analysis of the melanoma transcriptome.Genome Res2010,20:413-427.
28. Turro E, Lewin A, Rose A, Dallman MJ, Richardson S:MMBGX: a method for estimating expression at the isoform level and detecting differential splicing using whole-transcript Affymetrix arrays.Nucleic Acids Res2010,
38:e4.
29. Yates T, Okoniewski MJ, Miller CJ:X:Map: annotation and visualization of genome structure for Affymetrix exon array analysis.Nucleic Acids Res 2008,36:D780-786.
30. Cleveland WS, Grosse E, Shyu WM:Local regression modelsWadsworth & Brooks/Cole; 1992.
31. Cleveland WS:Robust Locally Weighted Regression and Smoothing Scatterplots.Journal of the American Statistical Association1979,74:829-836. 32. Gordon ADSE:ClassificationLondon: Chapman and Hall/CRC; 1999. 33. Monti S, Tamayo P, Mesirov J, Golub T:Consensus clustering: A
resampling-based method for class discovery and visualization of gene expression microarray data.Mach Learn2003,52:91-118.
34. Smyth GK, Yang YH, Speed T:Statistical issues in cDNA microarray data analysis.Methods Mol Biol2003,224:111-136.
35. Smyth GK:Linear models and empirical bayes methods for assessing differential expression in microarray experiments.Stat Appl Genet Mol Biol 2004,3, Article3.
36. [http://www.ingenuity.com/].
37. R Development Core Team:R: A Language and Environment for Statistical Computing, R Foundation for Statistical Computing.Book R: A Language and Environment for Statistical Computing, R Foundation for Statistical Computing2010, (Editor ed.^eds.). City.
38. Wilkerson MD, Hayes DN:ConsensusClusterPlus: a class discovery tool with confidence assessments and item tracking.Bioinformatics2010,
26:1572-1573.
39. Rousseeuw PJ:Silhouettes - a Graphical Aid to the Interpretation and Validation of Cluster-Analysis.J Comput Appl Math1987,20:53-65. 40. Ugurel S, Houben R, Schrama D, Voigt H, Zapatka M, Schadendorf D,
Brocker EB, Becker JC:Microphthalmia-associated transcription factor gene amplification in metastatic melanoma is a prognostic marker for patient survival, but not a predictive marker for chemosensitivity and chemotherapy response.Clin Cancer Res2007,13:6344-6350. 41. Zheng B, Jeong JH, Asara JM, Yuan YY, Granter SR, Chin L, Cantley LC:
Oncogenic B-RAF negatively regulates the tumor suppressor LKB1 to promote melanoma cell proliferation.Mol Cell2009,33:237-247. 42. Brown JH, Senthil Kumar VS, O’Neall-Hennessey E, Reshetnikova L,
Robinson H, Nguyen-McCarty M, Szent-Gyorgyi AG, Cohen C:Visualizing key hinges and a potential major source of compliance in the lever arm of myosin.Proc Natl Acad Sci USA2010.
43. Pscherer A, Dorflinger U, Kirfel J, Gawlas K, Ruschoff J, Buettner R, Schule R:
The helix-loop-helix transcription factor SEF-2 regulates the activity of a novel initiator element in the promoter of the human somatostatin receptor II gene.EMBO J1996,15:6680-6690.
44. Hata S, Emi Y, Iyanagi T, Osumi T:cDNA cloning of a putative G protein-coupled receptor from brain.Biochim Biophys Acta1995,1261:121-125. 45. Luska G, Huchzermeyer H, Seifert E, Stender HS:[The radiological diagnosis
of non-calculous biliary duct obstruction (author’s transl)].Rofo1977,
126:117-122.
46. Gavin BJ, McMahon JA, McMahon AP:Expression of multiple novel Wnt-1/ int-1-related genes during fetal and adult mouse development.Genes Dev1990,4:2319-2332.
47. Kriegl L, Horst D, Reiche JA, Engel J, Kirchner T, Jung A:LEF-1 and TCF4 expression correlate inversely with survival in colorectal cancer.J Transl Med2010,8:123.
48. Sareddy GR, Panigrahi M, Challa S, Mahadevan A, Babu PP:Activation of Wnt/beta-catenin/Tcf signaling pathway in human astrocytomas.
Neurochem Int2009,55:307-317.
49. Nateri AS, Spencer-Dene B, Behrens A:Interaction of phosphorylated c-Jun with TCF4 regulates intestinal cancer development.Nature2005,
437:281-285.
50. Pollack IF, Hamilton RL, Burger PC, Brat DJ, Rosenblum MK, Murdoch GH, Nikiforova MN, Holmes EJ, Zhou T, Cohen KJ, Jakacki RI:Akt activation is a common event in pediatric malignant gliomas and a potential adverse prognostic marker: a report from the Children’s Oncology Group.
J Neurooncol2010,99:155-163.
51. Levine AJ, Puzio-Kuter AM:The control of the metabolic switch in cancers by oncogenes and tumor suppressor genes.Science2010,330:1340-1344. 52. Rana S, Maples PB, Senzer N, Nemunaitis J:Stathmin 1: a novel
therapeutic target for anticancer activity.Expert Rev Anticancer Ther2008,
8:1461-1470.
53. Tan DS, Thomas GV, Garrett MD, Banerji U, de Bono JS, Kaye SB,
Workman P:Biomarker-driven early clinical trials in oncology: a paradigm shift in drug development.Cancer J2009,15:406-420.
doi:10.1186/gm437
Cite this article as:Zhanget al.:Isoform level expression profiles provide better cancer signatures than gene level expression profiles. Genome Medicine20135:33.
Submit your next manuscript to BioMed Central and take full advantage of:
• Convenient online submission
• Thorough peer review
• No space constraints or color figure charges
• Immediate publication on acceptance
• Inclusion in PubMed, CAS, Scopus and Google Scholar
• Research which is freely available for redistribution