Sonam et al. World Journal of Pharmaceutical and Medical Research
DENTAL RADIOGRAPHY IN FORENSIC ODONTOLOGY
Dr. Sonam Khurana*1, Dhruv Khurana2, Dr. Nivedita C.K.V.S.3 and Dr. Nivedita Gautam4
1
MDS, Oral Medicine and Radiology. 2
PhD Student, Center for Neuroeconomics Studies, Claremont Graduate University, Claremont, CA, USA. 3
Lecturer, Oral Medicine and Radiology Department, Goa Dental College and Hospital, Goa, India. 4
MPH Student, School of Community and Global health, Claremont Graduate University, CA.
Article Received on 11/05/2017 Article Revised on 01/06/2017 Article Accepted on 21/06/2017
INTRODUCTION
The Forensic Odontology or forensic dentistry was defined by Keiser-Neilson as “The branch of forensic medicine which deals with the proper handling, examination and presentation of dental evidence in the best interest of justice.[1] Saunders[2] in 1837 first published a study on 1000 children to define the importance of dentition in age estimation. „The sequence of events that human dentition follows to complete development is one of the methods of dental age estimation.[4,5,6] In Forensic Odontology, radiology plays a vital role in age estimation. The radiology was first used in forensic cases in 1986 to detect the bullet in the head of the victim.[3] The different imaging modalities used in forensic odontology which help to detect development sequences of dentition are intraoral periapical radiographs, panoramic radiographs, lateral oblique radiographs, digital imaging and advanced imaging technologies.[4,7,8]
The triad for dental age estimation can be listed as:[4,9] 1. The subject for age estimation
2. Appropriately chosen dental development survey
3. Legal consideration
The various features help to estimate the age with the help of radiographs as follows:
Jaw bones pre-natally;[4,5,11]
Appearance of tooth germs;[4,5,11]
Earliest detectable trace of mineralization or
beginning of mineralization;[4,5,11]
Early mineralization in various deciduous teeth
during intrauterine life;[4,5,11]
Degree of crown completion;[4,5,12]
Eruption of the crown into the oral cavity;[4,5,11,12]
Degree of root completion of erupted or unerupted teeth;[4,5,11,16]
Degree of resorption of deciduous teeth;[5,11]
Measurement of open apices in teeth;[13,14]
Volume of pulp chamber and root canals/formation
of physiological secondary dentine;[5,15-17]
Tooth-to-pulp ratio;[12,15]
Third molar development and topography;[4,5,11,15,17] and
Digitization of the available radiographs for analysis of images to obtain the dental information.[7]
The current article explains about the different methods used to estimate age with the help of radiographs.
REVIEW OF LITERATURE Nolla’s method (1960):[19]
Nolla evaluated the mineralization of permanent dentition in eleven stages. The method can be used to assess the development of each tooth of the maxillary and mandibular arch. The radiograph is then compared with Nolla‟s chart to assign scores for individual tooth for both maxillary (right or left quadrant) and mandibular (right or left quadrant) teeth. If the tooth shows a stage between any two stages a score of 0.5 is added. After every tooth is assigned a reading a total is made of maxillary and mandibular
ISSN 2455-3301 WJPMR
AND MEDICAL RESEARCH
www.wjpmr.com
*Corresponding Author: Dr. Sonam Khurana
MDS, Oral Medicine and Radiology.
ABSTRACT
Teeth are the most indestructible part of the human body and are resistant to almost all environmental conditions like fire, desiccation, and decomposition. Hence teeth are the reliable source of forensic investigation. The developmental stages of teeth are the key source for forensic odontologist to estimate the age. The methods of age estimation are comparatively easier and developmental stages can be easily seen on radiographs followed by its comparison with standard stages described by different authors. The present article summarizes different methods of age estimation and their reliability to estimate the age.
teeth. The total is compared to the Nolla‟s age norms given separately for boys and girls. The advantages of this method are that it can be applied to an individual with or without the third molar, and girls & boys are dealt separately.
Table 1: Age norms for upper and lower teeth including third molars by nolla’s method.
Boys Girls
Age
(years) Maxillary Mandibular Maxillary Mandibular
7 54.2 49.5 49.5 45.5
8 59.5 57.0 55.1 51.8
9 66.7 62.0 59.7 57.3
10 67.5 66.6 63.5 61.8
11 70.0 68.3 66.7 65.6
12 72.6 73.2 69.8 69.3
13 74.7 75.4 72.3 72.2
14 75.9 76.5 74.3 74.4
15 76.7 77.1 75.9 75.9
16 77.5 78.0 77.3 77.7
17 78.0 78.7 77.6 78.0
Moorrees, Fanning and Hunt (1963)[20] Method: In this method, the dental development was studied in the 14 stages of mineralization for lower canine, first and second premolar and for first, second and third molars.
Moorrees, Fanning and Hunt method used
Orthopantomographs for their study. The earliest age in the survey was six months and the data also included the development of the mandibular third molar. Notably, female development was ahead of the male and the root formation stages showed variation compared with crown formation stages.
Fourteen stages of tooth formation are: 1. Initial cusp formation (Ci)
2. Coalescence of cusps (Cco)
3. Cusp outline complete (Coc)
4. Crown half complete (Cr1/2)
5. Crown three-quarter complete (Cr3/4)
6. Crown complete (Crc)
7. Initial root formation (Ri) 8. Initial cleft formation (Cli)
9. Root length quarter (R1/4)
10. Root length half (R1/2)
11. Root length three-quarters (R3/4)
12. Root length complete (Rc)
13. Apex half closed (A1/2)
14. Apical closure complete (Ac)
In their results, they stated that initial crown formation of lower first premolar occurred at 1.8 years, at 3 years for the lower second premolar and at 3.5 years for the permanent second molar. Crown formation was just completed for lower second premolar and lower second molar at 6 - 6.5 years. By 12 years of age all teeth except third molar attain full root length. The time required for complete crown formation for lower second molar was
2.8 years and 3.1 - 3.4 years for lower first and second premolar. Root formation time was 4.8 years for lower second molar and for both lower premolars was 4.6 – 4.9 years in females and 5.3 – 5.4 years in males.
Demirjian, H. Goldstein and J.M. Tanner (1973)[21] developed a new method for estimating dental maturity by reference to the radiological appearances of the seven teeth on the left side of the mandible (Teeth # 31, 32, 33, 34, 35, 36, 37). Orthopantomographs of 1446 boys and 1482 girls aged between two to twenty years of French Canadian populations were used.
Each tooth was rated according to the eight developmental stages, A to H starting from the first appearance of the calcified points to the closure of the apex. Once all teeth were staged, each tooth was assigned a “self-weighted score” based on its staging designation and gender of the individual. The seven self-weighted scores from each tooth were then summed to give a dental maturity score, which could be converted directly into the dental age by cross-referencing in the gender-specific tables. Four examiners rated the radiographs whose results were then compared and discrepancies were discussed. Disagreement between examiners occurred in no more than 10% of subjects.
The analysis of the individuals‟ ratings was done as described in the table below (Table # 2 for boys and # 3 for girls).The analysis gives a set of scores, one for each stage of each tooth. The score from all seven teeth are then added together for a particular individual set, to give a maturity score for that individual. This maturity score may be converted directly into dental age either by reading off on the horizontal scale of the centile curves or by using the table (Table # 4 for boys and # 5 for girls).
The maturity scores can be applied universally but regression equation was derived to be used along with maturity scores for different ethnic groups.
In females, the regression formula is:
Age = (0.0000615 x S3) – (0.0106 x S2) + (0.6997 x S) – 9.3178.
Where, S= Maturity Score.
In males, the regression formula is:
Age = (0.000055 x S3) – (0.0095 x S2) + (0.6479 x S) - 8.4583.
Where, S= Maturity Score.
Fig. 1: Tooth calcification stages according to the method described by Demirjian’s.
Table 2: Demirjian’s Self-weighted scores for Seven Left Mandibular teeth (Boys).
Tooth Stages
O A B C D E F G H
M2 0.0 2.1 3.5 5.9 10.1 12.5 13.2 13.6 15.4
M1 0.0 8.0 9.6 12.3 17.0 19.3
PM2 0.0 1.7 3.1 5.4 9.7 12.0 12.8 13.2 14.4
PM1 0.0 3.4 7.0 11.0 12.3 12.7 13.5
C 0.0 3.5 7.9 10.0 11.0 11.9
I2 0.0 3.2 5.2 7.8 11.7 13.7
I1 0.0 1.9 4.1 8.2 11.8
Table 3: Demirjian’s self-weighted scores for seven left mandibular teeth (girls).
Tooth Stages
O A B C D E F G H
M2 0.0 2.7 3.9 6.9 11.1 13.5 14.2 14.5 15.6
M1 0.0 4.5 6.2 9.0 14.0 16.2
PM2 0.0 1.8 3.4 6.5 10.6 12.7 13.5 13.8 14.6
PM1 0.0 3.7 7.5 11.8 13.1 13.4 14.1
C 0.0 3.8 7.3 10.3 11.6 12.4
I2 0.0 3.2 5.6 8.0 12.2 14.2
I1 0.0 2.4 5.1 9.3 12.9
Table 4: Conversion of maturity score into dental age (seven teeth) for boys.
Score Age Score Age Score Age Score Age Score Age 12.4 3.0 33.6 6.0 83.6 9.0 94.0 12.0 97.6 15.0 12.9 3.1 34.7 6.1 84.3 9.1 94.2 12.1 97.7 15.1 13.5 3.2 35.8 6.2 85.0 9.2 94.4 12.2 97.8 15.2 14.0 3.3 36.9 6.3 85.6 9.3 94.5 12.3 97.8 15.3 14.5 3.4 38.0 6.4 86.2 9.4 94.6 12.4 97.9 15.4 15.0 3.5 39.2 6.5 86.7 9.5 94.8 12.5 98.0 15.5 15.6 3.6 40.6 6.6 87.2 9.6 95.0 12.6 98.1 15.6 16.2 3.7 42.0 6.7 87.7 9.7 95.1 12.7 98.2 15.7 17.0 3.8 43.6 6.8 88.2 9.8 95.2 12.8 98.2 15.8 17.6 3.9 45.1 6.9 88.6 9.9 95.4 12.9 98.3 15.9 18.2 4.0 46.7 7.0 89.0 10.0 95.6 13.0 98.4 16.0 18.9 4.1 48.3 7.1 89.3 10.1 95.7 13.1
19.7 4.2 50.0 7.2 89.7 10.2 95.8 13.2 20.4 4.3 52.0 7.3 90.0 10.3 95.9 13.3 21.0 4.4 54.3 7.4 90.3 10.4 96.0 13.4 21.7 4.5 56.8 7.5 90.6 10.5 96.1 13.5 22.4 4.6 59.6 7.6 91.0 10.6 96.2 13.6 23.1 4.7 62.5 7.7 91.3 10.7 96.3 13.7 23.8 4.8 66.0 7.8 91.6 10.8 96.4 13.8 24.6 4.9 69.0 7.9 91.8 10.9 96.5 13.9 25.4 5.0 71.6 8.0 92.0 11.0 96.6 14.0 26.2 5.1 73.5 8.1 92.2 11.1 96.7 14.1 27.0 5.2 75.1 8.2 92.5 11.2 96.8 14.2 27.8 5.3 76.4 8.3 92.7 11.3 96.9 14.3 28.6 5.4 77.7 8.4 92.9 11.4 97.0 14.4 29.5 5.5 79.0 8.5 93.1 11.5 97.1 14.5 30.3 5.6 80.2 8.6 93.3 11.6 97.2 14.6 31.1 5.7 81.2 8.7 93.5 11.7 97.3 14.7 31.8 5.8 82.8 8.9 93.9 11.9 97.5 14.9 32.6 5.9 82.0 8.8 93.7 11.8 97.4 14.8
Table 5: Conversion of maturity score into dental age (seven teeth) for girls.
Score Age Score Age Score Age Score Age Score Age 13.7 3.0 38.0 6.0 87.2 9.0 96.3 12.0 99.2 15.0 14.4 3,1 39.1 6.1 87.8 9.1 96.4 12.1 99.3 15.1 15.1 3.2 40.2 6.2 88.3 9.2 96.5 12.2 99.4 15.2 15.8 3.3 41.3 6.3 88.8 9.3 96.6 12.3 99.4 15.3 16.6 3.4 42.5 6.4 89.3 9.4 96.7 12.4 99.5 15.4 17.3 3.5 43.9 6.5 89.8 9.5 96.8 12.5 99.6 15.5 18.0 3.6 45.2 6.6 90.2 9.6 96.9 12.6 99.6 15.6 18.8 3.7 46.7 6.7 90.7 9.7 97.0 12.7 99.7 15.7 19.5 3.8 48.0 6.8 91.1 9.8 97.1 12.8 99.8 15.8 20.3 3.9 49.5 6.9 91.4 9.9 97.2 12.9 99.9 15.9 21.0 4.0 51.0 7.0 91.8 10.0 97.3 13.0 100.0 16.0 21.8 4.1 52.9 7.1 92.1 10.1 97.4 13.1
28.9 5.0 78.8 8.0 94.5 11.0 98.3 14.0 29.7 5.1 80.2 8.1 94.7 11.1 98.4 14.1 30.5 5.2 81.2 8.2 94.9 11.2 98.5 14.2 31.3 5.3 82.2 8.3 95.1 11.3 98.6 14.3 32.1 5.4 83.1 8.4 95.3 11.4 98.7 14.4 33.0 5.5 84.0 8.5 95.4 11.5 98.8 14.5 34.0 5.6 84.8 8.6 95.6 11.6 98.9 14.6 35.0 5.7 85.3 8.7 95.8 11.7 99.0 14.7 36.0 5.8 86.1 8.8 96.0 11.8 99.1 14.8 37.0 5.9 86.7 8.9 96.2 11.9 99.1 14.9
The centile curves were plotted exponentially. This signifies that as the maturity score on Y-axis increases the age of the person also increases on the X- axis. The centile curves were not symmetrical at either end. The centile lines have visible space between each other. The centile lines also showed symmetrical distribution upto seven and half years of age in both genders.
This study was based entirely on French Canadian population. The dental maturity score for given chronological age may well be greater or less for other populations, according to whether they are dentally more or less advanced during growth. The author says it seems reasonable to assume however that the pattern of development of teeth will not vary very much in different populations. The author therefore recommends that this maturity system can be used as valid measuring tool universally.
D. L. Anderson, G. W. Thompson, F. Popovich (1976)[22] used mineralization stages of all teeth including third molars of all four quadrants. It was scored by using the method of Moorrees, Fanningand Hunt(1963)[24] using lateral cephalographs from the age of three to eighteen in one hundred and twenty-one boys and one hundred and eleven girls of Anglo-Saxon origin. When there was one stage change from one record to the next, it was calculated that the change had taken place halfway between the first and second records. The midpoint between the chronological ages of the first and second records was taken as the age of the first appearance of that particular tooth stage. When there was a two-stage change between records, the interval increment was taken as one third of the difference between the first and second records. In this way it was possible to derive a chronological age for the first appearance of two different stages for any tooth. The same method was used when there were several stage changes between records. The mean age and standard deviation for each available stage of mineralization of each of the sixteen teeth was determined for each sex.
Teeth with similar ages of mineralization in order from youngest age to oldest were first molars, mandibular incisors, maxillary incisors, canines and premolars, second molars and third molars for the male subjects. The order of mineralization for female subjects was incisors and first molars, canines and first premolars, second premolars, second molars and third molars.
In their study, the authors concluded that male subjects were advanced at all stages of all six teeth except for the later stages of formation of the third molars. Other than the third molar, the sex difference in age increased with the successive stages of mineralization. The mandibular canine showed the greatest difference. The difference was progressively less for each tooth farther away from the canines. Variability was greater among the males than females for the incisors and canines at all stages.
The gender differences in variability of age were greatest for the first premolars. The male and female subjects were similar in variability of age for the first molar stages from seven to twelve, but variability was greater among males at stages thirteen and fourteen. The male and female subjects were similar for the second molars, but variability of age of the third molars' stages tended to be greater among the females.
When gender is unknown, the stages of the canines would be the least accurate for age determination because the sex differential in age is greatest for these teeth. More accurate age estimation can be achieved by choosing teeth that show the least variability in age. The mandibular central incisor and first molar showed the least variance.
Balwant Rai and S.C. Anand (2006)[23] conducted a study to determine the accuracy of five methods of dental
age estimation. The study included panoramic
radiographs of seventy-five healthy individuals (forty boys and thirty-five girls) aged between five to fourteen years. The panoramic radiographs were assessed to determine the developing stages of teeth according to
Nolla (1960), Haaviko (1970), Demirjian (1973), Williams (2001)and Cameriere(2006) methods. Dental age for each method was compared with chronological age for each subject. The significance of the difference between chronological and dental age was tested using Student‟s t-test (SPSS 7.0).
Table 6: Mean accuracy of estimated dental age (in years) for each method for children aged 5-14 years.
Sr
No. Methods Sex N Mean S.E. S.D. 1 Nolla (1960) M 40 0.29 ±0.07 ±0.44
F 35 0.27 ±0.08 ±0.40
2 Haavikko (1970) M 40 0.13 ±0.04 ±0.25
F 35 0.12 ±0.03 ±0.15
3 Demirjian(1973) M 40 0.18 ±0.07 ±0.45
F 35 0.15 ±0.09 ±0.44
4 Williams (2001) M 40 0.25 ±0.03 ±0.18
F 25 0.24 ±0.04 ±0.20
5 Cameriere(2006) M 40 0.20 ±0.05 ±0.31
F 35 0.18 ±0.04 ±0.20
dental age for both males and females was significant and showed p<0.01. Accuracy using William‟s method was better for males. William‟s method was found out to be most accurate followed by Haavikko (1970) method which yielded a mean estimation of 0.13 years with standard deviation ± 0.25 for male subjects. The mean accuracy for females was 0.12 year and standard deviation of ± 0.15 for female subjects. The accuracy between male and female was significantly different with p<0.01 followed by Cameriere (2006) method which yielded a mean estimation of 0.20 with standard deviation ±0.31 for male subjects. The mean accuracy for female subjects was 0.18 years with standard deviation of ±0.20.The accuracy between male and female subjects were significantly different with p<0.01.
Nolla (1960) yielded a mean estimation of 0.29 with standard deviation ± 0.44 for male subjects. The mean accuracy for female subjects was 0.27 years with standard deviation of ± 0.40. Nolla‟s method showed significant difference from chronological age with p<0.01. Demirjian (1973) method yielded a mean estimation of 0.18 with standard deviation ± 0.45 for male subjects. The mean accuracy for female subjects was 0.15 years with standard deviation of ± 0.44.this method showed no significant difference between male and female subjects. The results of student‟s t-test showed William‟s method was the most accurate, followed by Haavikko, Cameriere, Nolla and lastly Demirjian.
Abou El-Yazeed, Abou Zeid, Tawfik W. (2008)[24] studied three hundred and seventy- eight Egyptian subjects (one hundred and eighty-six were boys and one hundred and ninety-two were girls) to estimate dental maturation norms of permanent dentition. The samples were divided into nine groups.
1) First group : - Six years to less than Seven years 2) Second group: - Seven years to less than Eight years 3) Third group : - Eight years to less than Nine years 4) Forth group : - Nine years to less than Ten years 5) Fifth group : - Ten years to less than Eleven years 6) Sixth group :- Eleven years to less than Twelve years 7) Seventh group:- Twelve years to less than Thirteen years.
8) Eight group:-Thirteen years to less than Fourteen years
9) Ninth group:- Fourteen years to less than Fifteen years
The dental calcification was rated according to Nolla's
(1960)technique in which eleven stages of calcification (1 to 10) were described for each tooth. In order to obtain an appraisal of the development of a particular tooth, the radiograph was matched as closely as possible with the comparative figure. When the radiograph reading lay between two grades, this appraisal was indicated as the value of 0.5. When the radiograph showed a reading that was slightly greater than the illustrated grade, but not as much as halfway between that stage and the next, the value 0.2 was added. When the development was slightly less than the grade indicated, the value of 0.7 was added. After assigning the grade to each tooth, data for all teeth were summarized to gain the average level of the tooth's development at each age for boys and girls separately both for maxillary and mandibular arches. Statistical analysis and interpretation were done using SPSS program version 11 of UCLA (University of California at Los Angeles).
The central and lateral incisors showed significant differences for girls while for boys the significance was shown only in group Ι and IV. The canines also showed significant difference throughout most age groups for both sexes however it started earlier in females. As regards the premolars, the first premolars showed no significance in all age groups for both sexes, while the second premolars showed sporadic significance in different age / sex groups. The first molar showed a significant difference only in the first group in both sexes and second group of females. Significant difference for the second molar appears only in first group in females and in third group in males. The third molar showed significant difference in third and fourth groups in females and only in the third group in males.
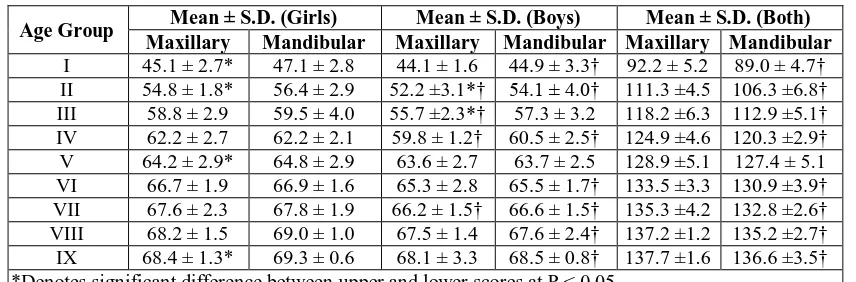
The means and standard deviations of the sum of developmental scores for all maxillary and mandibular teeth (excluding the third molars) and their combined total scores were calculated (Table # 7 & 8).
Table 7: Nolla’s scores for maxillary and mandibular teeth of egyptian boys and girls (excluding third molars).
Age Group Mean ± S.D. (Girls) Mean ± S.D. (Boys) Mean ± S.D. (Both) Maxillary Mandibular Maxillary Mandibular Maxillary Mandibular
I 45.1 ± 2.7* 47.1 ± 2.8 44.1 ± 1.6 44.9 ± 3.3† 92.2 ± 5.2 89.0 ± 4.7†
II 54.8 ± 1.8* 56.4 ± 2.9 52.2 ±3.1*† 54.1 ± 4.0† 111.3 ±4.5 106.3 ±6.8†
III 58.8 ± 2.9 59.5 ± 4.0 55.7 ±2.3*† 57.3 ± 3.2 118.2 ±6.3 112.9 ±5.1†
IV 62.2 ± 2.7 62.2 ± 2.1 59.8 ± 1.2† 60.5 ± 2.5† 124.9 ±4.6 120.3 ±2.9†
V 64.2 ± 2.9* 64.8 ± 2.9 63.6 ± 2.7 63.7 ± 2.5 128.9 ±5.1 127.4 ± 5.1
VI 66.7 ± 1.9 66.9 ± 1.6 65.3 ± 2.8 65.5 ± 1.7† 133.5 ±3.3 130.9 ±3.9†
VII 67.6 ± 2.3 67.8 ± 1.9 66.2 ± 1.5† 66.6 ± 1.5† 135.3 ±4.2 132.8 ±2.6†
VIII 68.2 ± 1.5 69.0 ± 1.0 67.5 ± 1.4 67.6 ± 2.4† 137.2 ±1.2 135.2 ±2.7†
IX 68.4 ± 1.3* 69.3 ± 0.6 68.1 ± 3.3 68.5 ± 0.8† 137.7 ±1.6 136.6 ±3.5†
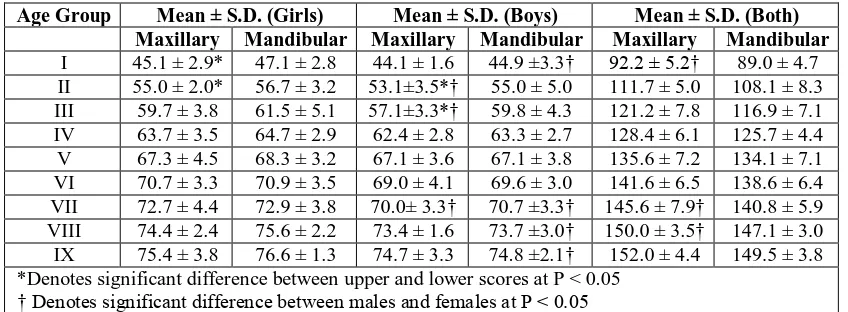
Table 8: Nolla’s scores for maxillary and mandibular teeth of egyptian boys and girls (including third molars).
Age Group Mean ± S.D. (Girls) Mean ± S.D. (Boys) Mean ± S.D. (Both) Maxillary Mandibular Maxillary Mandibular Maxillary Mandibular
I 45.1 ± 2.9* 47.1 ± 2.8 44.1 ± 1.6 44.9 ±3.3† 92.2 ± 5.2† 89.0 ± 4.7
II 55.0 ± 2.0* 56.7 ± 3.2 53.1±3.5*† 55.0 ± 5.0 111.7 ± 5.0 108.1 ± 8.3
III 59.7 ± 3.8 61.5 ± 5.1 57.1±3.3*† 59.8 ± 4.3 121.2 ± 7.8 116.9 ± 7.1
IV 63.7 ± 3.5 64.7 ± 2.9 62.4 ± 2.8 63.3 ± 2.7 128.4 ± 6.1 125.7 ± 4.4
V 67.3 ± 4.5 68.3 ± 3.2 67.1 ± 3.6 67.1 ± 3.8 135.6 ± 7.2 134.1 ± 7.1
VI 70.7 ± 3.3 70.9 ± 3.5 69.0 ± 4.1 69.6 ± 3.0 141.6 ± 6.5 138.6 ± 6.4
VII 72.7 ± 4.4 72.9 ± 3.8 70.0± 3.3† 70.7 ±3.3† 145.6 ± 7.9† 140.8 ± 5.9
VIII 74.4 ± 2.4 75.6 ± 2.2 73.4 ± 1.6 73.7 ±3.0† 150.0 ± 3.5† 147.1 ± 3.0
IX 75.4 ± 3.8 76.6 ± 1.3 74.7 ± 3.3 74.8 ±2.1† 152.0 ± 4.4 149.5 ± 3.8
*Denotes significant difference between upper and lower scores at P < 0.05 † Denotes significant difference between males and females at P < 0.05
This study clearly shows the advancement in development of lower teeth over upper ones individually and collectively.
Rajan S.Y, Nandita Mathur, Prabhuraj B. Kambalyal, Vikas Punia (2010)[25]studied the developmental stages of mandibular third molar for age estimation. Their study included one hundred and eighty subjects in the age group of eight to twenty-five years. The study population was divided into six groups with a difference of three years i.e.
Group I : - Eight to ten years Group II : - Eleven to thirteen years Group III : - Fourteen to sixteen years Group IV : - Seventeen to nineteen years Group V : - Twenty to twenty-two years Group VI : - Twenty-three to twenty-five years.
Different stages of the tooth development were assigned with grades and then converted into maturity score as described by Demirjian‟s method. The mean of the maturity score for that particular stage of tooth development was calculated and designated as Dental Age for that respective stage of the tooth development (Table # 9). The study observations were evaluated statistically using student „T‟ test.
Table 9: Comparison of chronological stage of third molars development with actual age (in years).
Stages
Minimum age (In Years)
Maximum age (In Years)
Mean (Dental age)
O 8.1 13.1 10.6
A 9.1 12.5 10.8
B 11.5 15.1 13.3
C 11.2 15.4 13.3
D 12.1 15.8 13.9
E 14.2 16.7 15.4
F 15.4 19.7 17.5
G 19.1 22.7 21.2
H 19.1 25.6 22.3
Table 10: The mean of c.a. corresponding to the different stages of third molar development.
Stages Average C.A. in Years (Males)
Average C.A. in Years (Females)
O 10.2 11.0
A 10.0 10.8
B 12.0 13.0
C 12.8 12.5
D 15.0 14.3
E 16.1 15.6
F 17.5 17.1
G 19.0 20.9
H 22.3 22.0
C.A. :- Chronological Age
The study observations were evaluated statistically using student „T‟ test. The first objective of the study was to evaluate the reliability of chronology of stages of the tooth development in predicting the age of study population. The outcome revealed that, the stages of the tooth development are statistically significant.
The second objective of the study was to statistically evaluate the significance of the dental age in male and female participants of the study. The outcome reveals that the chronological stages of third molar development are statistically significant in all groups of the study population except groups B and C. but the combined result of these two groups yielded highly significant results for a Dental age of 12.5 years.
DISCUSSION
The radiological methods are the most convenient among all the methods used for age estimation. It doesn‟t require tooth extraction and preparation like biochemical and histological methods. The radiological methods are fast and non-invasive whereas histological methods are time consuming. Different age estimations methods are used and they give us information about the sequence of development and the estimate of time period at which these events occur. As stated by Ciapparelli L.,[4] the calcification of teeth varies from individual to individual and population to population. Due to the variability of developmental status of dentition in each individual, the reliability of any method depends upon its careful selection. The method should be chosen wisely and needed to be accommodated by the regional population.
REFERENCES
1. Keiser-Nielsen S. Person Identification by Means of
the Teeth. Bristol: John Wright & Sons, 1980; 54-72.
2. Saunders E. „The Teeth A Test of Age‟ considered with the reference to the factory children, addressed to the members of both Houses of Parliament. London: Renshaw, 1837.
3. Eckert WG, Garland N. The history of the forensic applications in radiology. Am J Forensic Med Pathol., 1984; 5: 53–56.
4. Ciapparelli L. The chronology of dental
development and age assessment. In: Clark DH, editor. Practical forensic odontology. Oxford: Wright Butterworth-Heinemann Ltd., 1992; 22–42. 5. Masthan KMK. Age and sex. Textbook of forensic
odontology. New Delhi: Jaypee Brothers Medical Publishers (P) Ltd., 2009; 59–65.
6. Ranganathan K, Rooban T, Lakshmminarayan V.
Forensic odontology: a review. J Forensic Odontol, 2008; 1: 4–12.
7. Carvalho SPM, Alves daSilva RH, Lopes-Júnior C, Peres AS. Use of images for human identification in forensic dentistry. Radiol Bras., 2009; 42: 1–12. 8. Singaraju S, Sharda P. Age estimation using
pulp-tooth area ratio: A digital image analysis. J Forensic Dent Sci., 2009; 1: 37–41.
9. Karjodkar FR. Role of dental radiology in forensic odontology, Text book of dental and maxillofacial radiology, (2nd edn) New Delhi: Jaypee Brothers Medical Publishers (P) Ltd., 2009; 929–963.
10. A. S. Panchbhai. Dental radiographic indicators, a
key to age estimation. Dentomaxillofacial
Radiology, 2011; 40: 199–212.
11. Whittakar DK, McDonald DG. Age determination
from teeth. A color atlas of forensic dentistry. England: Wolfe Medical Publications Ltd., 1989; 58–66.
12. Cameriere R, Ferrante L, Belcastro M, Bonfiaglioli B, Rastelli E, Cingolani M. Age estimation by pulp/tooth ratio in canines by periapical X-rays. J Forensic Sci., 2007; 52: 166–170.
13. Cameriere R, Ferrante L, Cingoloni M. Age
estimation in children by measurement of open apices in teeth. Int J Legal Med., 2006; 120: 49–52. 14. Rai B, Anand SC. Age estimation in children from
dental radiograph: A regression equation. Int J Biol Anthropol, 2008; 1: 1–5.
15. Vandevoort FM, Bergamans L, Cleyenbreugel JV,
Bielen DJ, Lambrechts P, Wevers M. Age calculation using X-ray microfocus computed tomographical scanning of teeth: A pilot study. J Forensic Sci., 2004; 49: 787–790.
16. Kvaal S, Kolltvit KM, Thompson IO, Solheim T. Age estimation of adults from dental radiographs. Forensic Sci Inter., 1995; 74: 175–185.
17. Drusini AG. The coronal pulp cavity index: A
forensic tool for age determination in human adults. Cuad Med Forensic, 2008; 53–54: 235–249.
18. Olze A, Bilang D, Schmidt S, Wnecke KD, Geserick
G, Schmeling A. Validation of common
classification systems for assessing the
mineralization of third molars. Int J Legal Med., 2005; 119: 1–8.
19. Nolla CM. The development of permanent teeth. J Dent Child, 1960; 27: 254–266.
20. Moorrees CFA, Fanning EA, Hunt EE Age variation
of formation stages for ten permanent teeth. Journal of Dental Research, 1963; 42(6): 1490-1502. 21. Arto Demirjian, Goldstein H and Tanner J.M. A
new system of dental age assessment. Human
Biology, 1973; 45(2): 211-227.
22. D. L. Anderson, G. W. Thompson, and F. Popovich.
Age of Attainment of Mineralization Stages of the Permanent Dentition. Journal of Forensic Science, 1976; 21(1): 191-200.
23. Balwant Rai and S.C. Anand. Tooth Developments:
Accuracy of Age Estimation of Radiographic Methods. World Journal of Medical Sciences, 2006; 1(2): 130-132.
24. Abou El-Yazeed, M., Abou Zeid, W., Tawfik, W. Dental Maturation Assessment by Nolla's Technique on a Group of Egyptian Children. Australian Journal of Basic and Applied Sciences, 2008; 2(4): 1418-1424.
25. Rajan S.Y, Nandita Mathur, Prabhuraj B.