Open Access
Research
J
-MYN: a new algorithm for estimating Ka and Ks with
consideration of variable substitution rates
Da-Peng Wang
†1,2, Hao-Lei Wan
†1,2, Song Zhang
†1,2,3and Jun Yu*
1,3Address: 1CAS Key Laboratory of Genome Sciences and Information, Beijing Institute of Genomics, Chinese Academy of Sciences, Beijing 100029,
PR China, 2Graduate University of Chinese Academy of Sciences, Beijing 100039, PR China and 3Institute of Computing Technology, Chinese
Academy of Sciences, Beijing 100080, PR China
Email: Da-Peng Wang - [email protected]; Hao-Lei Wan - [email protected]; Song Zhang - [email protected]; Jun Yu* - [email protected]
* Corresponding author †Equal contributors
Abstract
Background: Over the past two decades, there have been several approximate methods that adopt different mutation models and used for estimating nonsynonymous and synonymous substitution rates (Ka and Ks) based on protein-coding sequences across species or even different evolutionary lineages. Among them, MYN method (a Modified version of Yang-Nielsen method) considers three major dynamic features of evolving DNA sequences–bias in transition/transversion rate, nucleotide frequency, and unequal transitional substitution but leaves out another important feature: unequal substitution rates among different sites or nucleotide positions.
Results: We incorporated a new feature for analyzing evolving DNA sequences–unequal substitution rates among different sites–into MYN method, and proposed a modified version, namely J(gamma)-MYN, based on an assumption that the evolutionary rate at each site follows a mode of J-distribution. We applied J-MYN to analyze the key estimator of selective pressure Z (Ka/Ks) and other relevant parameters in comparison to two other related methods, YN and MYN, and found that neglecting the variation of substitution rates among different sites may lead to biased estimations of Z. Our new method appears to have minimal deviations when relevant parameters vary within normal ranges defined by empirical data.
Conclusion: Our results indicate that unequal substitution rates among different sites have variable influences on Z under different evolutionary rates while both transition/transversion rate ratio and unequal nucleotide frequencies affect Ka and Ks thus selective pressure Z.
Reviewers: This paper was reviewed by Kateryna Makova, David A. Liberles (nominated by David H Ardell), Zhaolei Zhang (nominated by Mark Gerstein), and Shamil Sunyaev.
Background
Comparative sequence analysis is a powerful tool for biol-ogists to study evolutionary relationship among animals and plants across diverse taxonomic lineages [1-3]. Pair-wise sequence comparison is perhaps the simplest
com-parative analysis for phylogeny for two reasons [4]. First, calculating pair-wise distances is the initial step for dis-tance-matrix methods of phylogeny reconstruction. Sec-ond, Markov-process models of nucleotide substitution used in distance calculations lay a foundation for
likeli-Published: 16 June 2009
Biology Direct 2009, 4:20 doi:10.1186/1745-6150-4-20
Received: 13 June 2009 Accepted: 16 June 2009
This article is available from: http://www.biology-direct.com/content/4/1/20
© 2009 Wang et al; licensee BioMed Central Ltd.
hood and Bayesian analyses. One of the sophisticated methods is to estimate nonsynonymous and synonymous substitution rates for interrogating sequence dynamics and constructing phylogenetic trees. Since Ka and Ks rep-resent the number of substitutions per nonsynonymous and synonymous site, respectively, these parameters (or often their ratio Ka/Ks or Z) are important for the estima-tion of evoluestima-tionary rates. The indicaestima-tions of Ka < Ks (Z < 1), Ka > Ks (Z > 1), and Ka = Ks (Z = 1) on evolutionary trends are negative (purifying), positive (adaptive), and neutral mutations, respectively. Ka and Ks can be esti-mated based on approximate methods, which typically involve three essential steps [4]: (1) counting the number of synonymous (S) and nonsynonymous (N) sites among targeted sequences, (2) counting the number of synony-mous (Sd) and nonsynonymous (Nd) substitutions between two orthologous sequences, and (3) calculating the number of synonymous (ds) and nonsynonymous (dn) substitutions per site after correcting for multiple substitutions. Most of the methods assume simplified nucleotide substitution paths and involve ad hoc data treatments that are not well-justified [5,6]. For instance, NG (Nei-Gojobori) method, a commonly-used approxi-mate method in the early days, considers all possible evo-lutionary courses among compared DNA sequences and assumes that each nucleotide can be substituted with any of three other nucleotides at equal rate when it counts both sites and substitutions [7]. It adopts Jukes-Cantor's one parameter formula only to correct for multiple substi-tutions. Another example, LWL (Li-Wu-Luo) method, classifies sites and substitutions as i-fold degenerate sites (i = 0, 2, 4) and considers unequal rates between transi-tional and transversional changes only when it counts substitutions, but considers equal rates when counting sites [8]. A modified LWL, LPB (Li-Pamilo-Bianchi) method corrects for bias in counting sites by using differ-ent formulas for Ka and Ks estimation, which differdiffer-entiate LPB from LWL method [9,10]. Versions of LWL and LPB methods were also proposed by distinguishing two-fold degenerate sites and substitutions, taking the account of the transition/transversion rate bias when counting sites and correcting for arginine codons [11,12].
Among approximate methods, YN (Yang-Neilsen) method made significant progress through consideration of transition/transversion rate and nucleotide frequency biases [13]. Based on YN method, we recently proposed a modified YN method (MYN) to distinguish substitutions between purines (A/G) and between pyrimidines (T/C) [13,14]. MYN incorporates most of the major features of sequence evolution but assumes that different sites in sequences evolve the same way and at the same rate. This assumption is somewhat less thorough, and accumulating evidence of rate variation over sites is rather overwhelm-ing [15-20]. Since mutation rates certainly vary among
sites, and mutations at different sites may be fixed or drift-ing at different rates due to their versatile roles in the struc-ture and function of gene products (mostly proteins albeit RNAs also fold into different conformations), unequal nucleotide frequencies, different codon usage among spe-cies, and variation of substitution rates among different sites should all be taken into account, allowing for signif-icant yet maybe incremental improvements on various parameter estimations. Some sixteen years ago, one of the pioneers of this field, Ziheng Yang suggested J -distribu-tion (gamma-distribu-distribu-tion) as an adequate approxima-distribu-tion based on his intensive comparative analysis on several continuous distributions leveraging on sequence data from the globin genes [21]. As J-distribution has been fre-quently used in estimating sequence divergence [7,22-27], we adopt it to formulate an improved approximate method, denoted as J-MYN, based on MYN method [14]. In this method, we assume that nucleotide substitutions follow J-distribution because negative binomial distribu-tion is known to be generated when Poisson parameter J varies according to a particular Jdistribution among sites [28]. We would like to emphasize that the Jdistribution here refers to raw mutation rate rather than Jdistribution of Z itself. It has been proposed that nucleotide substitu-tion in coding region is context-dependent [29], and therefore, substitution rates depend on not only the neighboring sequences but also their functional con-straints and models that allow for the correlation of sub-stitution rates at adjacent sites were also developed [30,31]. However, as these models tend to produce results similar to the simple gamma model and variations of D can make the distribution suitable for accommodating different levels of rate variations in various datasets [31], we chose the simple gamma distribution as the depiction of raw various mutation rates. Since YN and MYN ods perform better as compared to numerous other meth-ods [12] and MYN improves the performance of YN for most parameter combinations [14], we focus on evaluat-ing the performance of J-MYN by comparing it to YN and MYN under variable conditions. The definitions of sym-bols used in Ka and Ks estimations are listed in Table 1.
Results
Computer simulation
protein-coding sequences. To assess the advantages of J-MYN in comparison with YN and MYN, we generated three groups of simulated sequences with the PAML package: (1) equal codon frequencies, (2) human frequencies (based on human protein-coding genes from the ENSEMBL data-base) [37] and (3) rice frequencies (based on rice protein-coding genes) [38]. We also generated 2,000 sequence pairs with 1,200 bp in length for examining the effect of different parameters.
Consistency analysis and effect of codon frequencies In general, a better method should have relatively mini-mal deviations from real values with near infinite amount of data and within a reasonable range of all relevant parameters. In reality, we have to define both data in a limited way and parameter ranges within reasonable boundaries. In this exercise, we use Z = 0.3, 1, and 3 to represent negative, neutral, and positive mutations, respectively [3], and fix parameter t to 0.6 for initial assessment. Since genuine values for N often range from 1.5 to 5, we always fix N = 3.75 as typical. Considering that
J-MYN differentiates NY from NR, we always fix one of them to 3.75 and allow the other varying from 1 to 10. We then analyze Z among data generated with YN, MYN, and J -MYN against NR (fixing NY = 3.75), using the three codon frequencies under different selective pressures (Figure 1A– I). We observed that J-MYN produces less deviated Z from the standard data under negative selection as we perform analyses for different species. Although J-MYN performs in a very similar way as MYN does, it is obviously better than YN under either positive or neutral selections. Since biased codon frequencies often have opposite effects as compared to the bias of transition/transversion rate ratio, ignoring codon frequency bias can lead to an overestima-tion of Z [13]. Using empirical data from human and rice, which represent distinct codon usages, we also did not
detect any effect among different codon frequencies (Fig-ure 1A–I). Since most of the evolutionary studies tend to calculate evolutionary rates between closely-related spe-cies, future research should focus more on the effect of dif-ferent parameters and the improvement of calculations under negative selection.
Effect of J-distribution
MYN method assumes that different sites in a sequence evolve in the same way and at the same rate. It is obvious that such an assumption does not happen in the real world for most proteins and their genes. For instance, mutation rates are not the same in nuclear and organellar genomes among different species [39]. In addition, sequence variations among portions or domains of pro-teins mutate differently from a fixed mutation rate due to their specific structural and functional constraints for dif-ferent genes under difdif-ferent selective pressures. Therefore, we introduced a parameter D in MYN method so that each substitution rate across sites is assumed to follow J -distri-bution.
Since D is an unknown random variable and its variations may lead to changes of probability density of J -distribu-tion as well as devia-distribu-tions of J-MYN method, we chose dif-ferent parameters to force it to deviate from real values under different selective pressures (Figure 2). For a quali-tative survey, the order of estimated values of Z, in the cases of NR = 1, 2, and 3, is: YN <J-MYN < MYN; the order of estimated values of Z for the rest cases, NR = 4, 5, 6, 7, 8, 9, and 10, is: J-MYN<MYN <YN. Furthermore, we observed that estimated Z do not change much as D varies when expected Z = 1 or 3, and J-MYN again performs bet-ter when Z = 0.3 than it does when Z = 1 or 3. Because most calculated Z values indicate negative selection, and variation of D has stronger influence under negative selec-Table 1: Symbols used in Ka and Ks calculation
Symbol Definition
S Number of synonymous sites
N Number of nonsynonymous sites
Ks Synonymous substitution rate Ka Nonsynonymous substitution rate
Z Estimator of selective strength, Z = Ka/Ks Sd Number of synonymous substitutions
Nd Number of nonsynonymous substitutions
t Divergence time between two sequences, the expected number of nucleotide substitutions per codon, t = (Ks × 3S + Ka × 3N)/(S + N) D The parameter of gamma distribution
N Ratio of transitional rate/transversional rate
NR Ratio of transitional rate between purines to transversional rate, NR = DR/E
NY Ratio of transitional rate between pyrimidines to transversional rate, NY = DY/E
gN Frequency of nucleotide N, N [T, C, A, G] DR Transitional rate between purines
Estimated Z based on YN, MYN, and J-MYN Figure 1
Estimated Z based on YN, MYN, and J-MYN. We plotted Z values estimated by YN, MYN, and J-MYN when NY = 3.75,
considering NR varying from 1 to10. We used the canonical genetic code for simulated sequences with 1.6 million codons and
three sets of codon frequencies: equal (A to C), human (D to F) calculated from human protein-coding genes, and rice (G to I) calculated from rice protein-coding genes. Z = 0.3 (A, D, G), Z = 1 (B, E, H), and Z = 3 (C, F, I) were considered as represent-ative values for purifying selection, neutral mutation, and positive selection, respectively.
Z
D
Z
D
Z
D
Z
D
Z
D
Z
D
Z
D
Z
D
Z
D
!" #!" JŦ#!" $%Z
&
'
(
Estimated Z when NY = 3.75 and NR varies from 1 to 10 under negative selection
Figure 2
Estimated Z when NY = 3.75 and NR varies from 1 to 10 under negative selection. We obtained better Z estimates by introducing parameter D when orthologous genes are under negative selection with Z varying from 0.1 to 0.9. The canonical genetic code was used for simulated sequences with 1.6 million human codons.
Z
D+
Z
D
Z
D
Z
D
, ,
Z
D
, ,
-Z
D
, , -+
Z
D
-+ + .
Z
D
+ + . .
Z
D
!" #!" JŦ#!" $%Z
)
'
(
tion, we analyzed the variation of Z in a range of 0.1 to 0.9 to evaluate the effect of D on Z. We obtained different optimal D values when Z varies from 0.1 to 0.9, and plot-ted different Jdistribution densities (Figure 3). Each curve appears reaching its maximum and goes down with an increasing substitution rate. The peaks of the curves shift to the left and become lower in density when optimal D values decrease from 4.8 to 1.5; the decrease is attributa-ble to the increase of Z (selective pressure) from 0.1 to 0.9. Furthermore, selective pressure shows significant effects on D, with an increase in the probability at the lowest and highest substitution rates across all sites. Because J-MYN produces less biases than both YN and MYN do when Z varies from 0.1 to 0.9 under D = 4 (data not shown), we chose D = 4 as a typical value for our analyses.
Effect of t
The parameter t represents divergence time between two sequences. To test the effect of t on our method, we use human codon frequency (2,000 pairs of sequences with 400 codons for each case), and vary t from 0.1 to 1. Since
J-MYN does not change much in comparison with MYN under positive selection and neutral selection, we only consider the three obvious conditions of negative selec-tion when NR = 10 and NY = 1 are fixed: Z = 0.2, 0.3 and 0.4 (Figure 4). Although YN, MYN, and J-MYN all have a
Jdistribution density as a function of substitution rates at optimal D values
Figure 3
J distribution density as a function of substitution rates at optimal D values. We plotted different J distribu-tion densities as a funcdistribu-tion of substitudistribu-tion rates at optimal D values: (1) Z = 0.1, D = 4.8; (2) Z = 0.2, D = 4; (3) Z = 0.3, D = 3.3; (4) Z = 0.4, D = 3; (5) Z = 0.5, D = 2.5; (6) Z = 0.6, D = 2; (7) Z = 0.7, 0.8, and 0.9, D = 1.5. Note that each curve reaches its maximum and goes down with increasing substi-tution rates.
, -+ .
J
Ŧ
&/&0
1/
JŦ&/
D+
D
D
D
D
D
D
The effect of t based on YN, MYN, and J-MYN Figure 4
The effect of t based on YN, MYN, and J-MYN. J-MYN deviates less under the effect of t as compared to other methods. Both YN and MYN tend to overestimate Z. Since MYN and J-MYN are two modified forms of YN, all datasets exhibit a similar trend. However, when t increases, J-MYN performs better than the other two methods. Parameter val-ues are (A) D = 4, NR = 10, NY = 1, the expected value of Z =
0.2; (B) D = 4, NR = 10, NY = 1, the expected value of Z = 0.3;
and (C) D = 4, NR = 10, NY = 1, the expected value of Z = 0.4.
, +
Z
V )
, +
Z
V (
, +
,
Z
V
nearly identical overall trend when t varies from 0.1 to 1, and they all tend to overestimate Z for negative selection,
J-MYN deviates less from the expected values. Despite the fact that J-MYN also overestimates Z and the overestima-tion becomes less obvious as t increases, while the overes-timation of both YN and MYN becomes severer.
Effects of NR and NY
We used the same data (2,000 pairs of human codon sequences with 400 codons for each case) and methods to test the effects of NR and NY. We plotted the average esti-mates of Z from YN, MYN, and J-MYN methods against NY = NR for the parameter combinations: the expected Z val-ues vary as 0.2 and 0.3 when D = 4 (Figure 5). While the curves produce from YN and MYN methods superimpose each other when NR (=NY) varies from 1 to 10, J-MYN devi-ates clearly less from the expected Z. We found that J -MYN still performs better than the other two methods, whereas MYN is degraded to YN when NY is equal to NR. The result suggests that the assumption of variable substi-tution rates among different sites is necessary to Ka and Ks calculations.
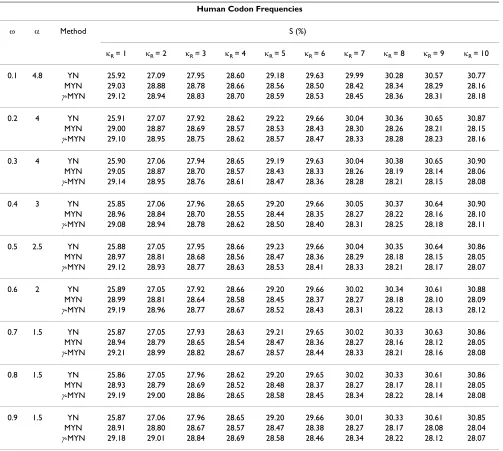
Effect of S%
Usually the effect of S% (the fraction of synonymous sites in a sequence) is considered as a factor of method evalua-tion. Changes in Z in relation to S% are often evaluated
based on the effect of S% on the deviation of Ka and Ks. Therefore, an overestimated S% may give rise to underes-timation of Ks and overesunderes-timation of Ka, resulting in over-estimation of Z. Likewise, underestimation of S% may also lead to overestimation of Ks and underestimation of
Z. It has been reported that S% has enormous influence on Ka and Ks under negative selection but has neglectable effect under positive selection [40]. We used human sequences to examine the effect of S% on J-MYN (Table 2), fixing NY to 3.75. As NR increases, the value of S% gen-erated from our method exhibits minor fluctuations under different negative selections, when compared to that from YN. But the difference between J-MYN and MYN is minute under this condition. In more details, the order of estimated values of S%, in the cases of NR = 1, 2, and 3, is: YN < MYN <J-MYN; in the rest cases, the order of estimated values of S%, when NR = 5, 6, 7, 8, 9 and 10, is: MYN <J-MYN < YN. We did not observe any obvious trend under the condition of NR = 4. Therefore, J-MYN is deemed insensitive to S% changes.
Effect of sequence lengths
The length of homologous genes subjected to an analysis usually varies in actual calculation. In order to evaluate the effect of variable sequence lengths, we use two groups of simulated rice sequences under the conditions of (1) Z = 0.2, NR = 10, NY = 1, t = 0.6, and D = 4; and (2) Z = 0.3,
The effects of NR and NY based on YN, MYN, and J-MYN
Figure 5
The effects of NR and NY based on YN, MYN, and J-MYN. We showed the effects of NR and NY when Z = 0.2 (A) and 0.3
(B) were said to represent negative selection. The human codon frequency was used for the simulated sequences and D = 4 for both plots.
, +
, + , +
Z
!
)
, +
, + , +
!
(
!" #!"
JŦ#!"
$%Z
!" #!"
JŦ#!"
NR = 10, NY = 1, t = 0.6, and D = 4. We then calculate the average estimated Z when the number of codons varied from 100 to 1,000 (Table 3). It appears that all three methods overestimate Z regardless the number of codons in the datasets. In particular, despite the fact that all three methods give rise greater biases for shorter sequences (<300 codons), J-MYN performs better than the other two methods. We also found that the performance of J-MYN is getting better faster than the other two methods as the number of codon increases.
Testing real data
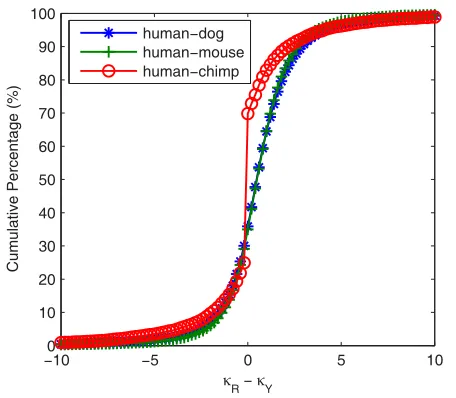
We used three ortholog datasets for the test, 14,323 from human-dog, 16,066 from human-mouse, and 12,351
from human-chimp. For a more comprehensive display, we examined the cumulative percentage of NR-NY (Figure 6), showing different transitional substitutions with une-qual frequencies. For example, the cumulative percentages for NR - NY > 0.4 for human-dog, human-mouse and human-chimp orthologs are 52.27%, 52.66%, and 24.47% and those for NR - NY < -0.4 are 25.36%, 24.31%, and 21.87%, respectively. In the rest cases, for |NR - NY| d 0.4, they are 22.37%, 23.02%, and 53.66% for the three ortholog groups. We found that the value for human-chimp is more than twice as much as that of human-dog (or human-mouse), and the reasons are attributable to a close evolutionary relationship between human and chimpanzee [41].
Table 2: S% Estimates under different negative selections based on YN, MYN, and J-MYN
Human Codon Frequencies
Z D Method S (%)
NR = 1 NR = 2 NR = 3 NR = 4 NR = 5 NR = 6 NR = 7 NR = 8 NR = 9 NR = 10
0.1 4.8 YN 25.92 27.09 27.95 28.60 29.18 29.63 29.99 30.28 30.57 30.77
MYN 29.03 28.88 28.78 28.66 28.56 28.50 28.42 28.34 28.29 28.16
J-MYN 29.12 28.94 28.83 28.70 28.59 28.53 28.45 28.36 28.31 28.18
0.2 4 YN 25.91 27.07 27.92 28.62 29.22 29.66 30.04 30.36 30.65 30.87
MYN 29.00 28.87 28.69 28.57 28.53 28.43 28.30 28.26 28.21 28.15
J-MYN 29.10 28.95 28.75 28.62 28.57 28.47 28.33 28.28 28.23 28.16
0.3 4 YN 25.90 27.06 27.94 28.65 29.19 29.63 30.04 30.38 30.65 30.90
MYN 29.05 28.87 28.70 28.57 28.43 28.33 28.26 28.19 28.14 28.06
J-MYN 29.14 28.95 28.76 28.61 28.47 28.36 28.28 28.21 28.15 28.08
0.4 3 YN 25.85 27.06 27.96 28.65 29.20 29.66 30.05 30.37 30.64 30.90
MYN 28.96 28.84 28.70 28.55 28.44 28.35 28.27 28.22 28.16 28.10
J-MYN 29.08 28.94 28.78 28.62 28.50 28.40 28.31 28.25 28.18 28.11
0.5 2.5 YN 25.88 27.05 27.95 28.66 29.23 29.66 30.04 30.35 30.64 30.86
MYN 28.97 28.81 28.68 28.56 28.47 28.36 28.29 28.18 28.15 28.05
J-MYN 29.12 28.93 28.77 28.63 28.53 28.41 28.33 28.21 28.17 28.07
0.6 2 YN 25.89 27.05 27.92 28.66 29.20 29.66 30.02 30.34 30.61 30.88
MYN 28.99 28.81 28.64 28.58 28.45 28.37 28.27 28.18 28.10 28.09
J-MYN 29.19 28.96 28.77 28.67 28.52 28.43 28.31 28.22 28.13 28.12
0.7 1.5 YN 25.87 27.05 27.93 28.63 29.21 29.65 30.02 30.33 30.63 30.86
MYN 28.94 28.79 28.65 28.54 28.47 28.36 28.27 28.16 28.12 28.05
J-MYN 29.21 28.99 28.82 28.67 28.57 28.44 28.33 28.21 28.16 28.08
0.8 1.5 YN 25.86 27.05 27.96 28.62 29.20 29.65 30.02 30.33 30.61 30.86
MYN 28.93 28.79 28.69 28.52 28.48 28.37 28.27 28.17 28.11 28.05
J-MYN 29.19 29.00 28.86 28.65 28.58 28.45 28.34 28.22 28.14 28.08
0.9 1.5 YN 25.87 27.06 27.96 28.65 29.20 29.66 30.01 30.33 30.61 30.85
MYN 28.91 28.80 28.67 28.57 28.47 28.38 28.27 28.17 28.08 28.04
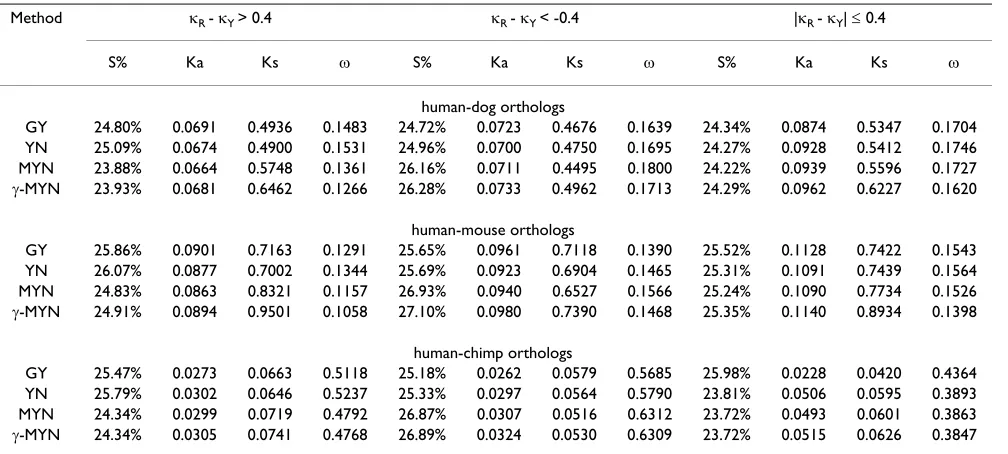
To evaluate the performance of J-MYN, we compared a set of values for several key parameters (S%, Ka, Ks, and Z) generated with J-MYN and three other selected methods in a straightforward way, considering three cases of NR - NY > 0.4, NR - NY < -0.4, and |NR - NY| d 0.4 (Table 4). We chose the value of 0.4 as a threshold so that the three cases can stand for three groups of NR under the condition of NY = 3.75: (1) NR = 5, 6, 7, 8, 9 and 10; (2) NR = 1, 2, and 3; (3)
NR = 4. Other than YN and MYN, we also used a maximum likelihood method proposed by Goldman and Yang (denoted as GY) [33].
The results showed a few interesting trends. First, GY per-forms in a similar way as YN does as compared to MYN and J-MYN; it is consistent with our previous simulation results, as they share a common consideration of transi-tion/transversion rate bias and nucleotide frequencies bias [12,42]. Second, the trends of Z estimates with the three methods, YN, MYN and J-MYN, are consistent with our simulation results. In the cases of |NR - NY| d 0.4 and NR - NY > 0.4, when NR = 4, 5, 6, 7, 8, 9, and 10, the order of estimated values of Z is: J-MYN < MYN < YN. When con-fined to NR - NY < -0.4, when NR = 1, 2, and 3, YN underes-timates Z and MYN overestimates Z as compared to J -MYN. Taking Z estimates as an example, they are 0.1695, 0.1800, and 0.1713 for human-dog orthologs, 0.1465, 0.1566, and 0.1468 for human-mouse orthologs, and 0.5790, 0.6312 and 0.6309 for human-chimp orthologs, calculated with YN, MYN, and J-MYN, respectively. These findings are in agreement with our simulation studies. Third, the orders of S% estimates with the three methods (YN, MYN and J-MYN) are also consistent with our simu-lation results. For example, when NR - NY > 0.4, NR = 5, 6, 7, 8, 9 and 10, YN overestimates S% and MYN underesti-mates S% as compared to J-MYN. In the case of NR - NY < -0.4, when NR = 1, 2, and 3, the order of estimated values of S% is: YN < MYN <J-MYN. Fourth, we took one gene as an example to show the outperformance of our new method over others. Among the human-chimp orthologs, Z values of an immunoglobulin interleukin-1-related receptor (NP_068577) are listed as 1.02406, 0.622611, 0.59999, and 0.843755, when J-MYN, MYN, YN, and GY are used for the calculation, respectively. Obviously, only J-MYN is able to detect positive selection for this gene, and others failed. This gene has been studied previously based on a population genetics analysis of extended-haplotype-homozygosity in Northeast Asians, and a possible positive selection scheme was proposed for it [43]. This result is in accordance with the result of large-scale scanning on pos-itively selected genes between human and chimpanzee genomes [44,45].
Program availability and performance
A C++ program implementing J-MYN method is included in the updated KaKs_Calculator [42], available upon request. And we tested the running time with YN, MYN, J -MYN, and GY, using the three testing datasets (14,725 dog, 16,368 mouse, and 15,646 human-chimp gene pairs). Table 5 shows the time consumption for each method to compute Ka/Ks ratios from the three datasets and their average running time. On average, J -MYN takes 600 folds less time than GY does, and YN, MYN, and J-MYN perform similarly in time consumption. Table 3: Average Z estimates calculated based on YN, MYN and
J-MYN.
Rice Codon Frequencies (D = 4)
Number of codons Z = 0.2 Z = 0.3
YN MYN J-MYN YN MYN J-MYN
100 0.308 0.245 0.235 0.458 0.364 0.352
200 0.305 0.230 0.222 0.450 0.341 0.332
300 0.294 0.219 0.210 0.435 0.325 0.316
400 0.290 0.215 0.207 0.426 0.317 0.308
500 0.294 0.216 0.208 0.430 0.317 0.308
600 0.291 0.214 0.206 0.427 0.316 0.307
700 0.290 0.213 0.205 0.424 0.313 0.305
800 0.290 0.212 0.205 0.424 0.313 0.305
900 0.288 0.212 0.204 0.422 0.312 0.303
1000 0.287 0.210 0.203 0.421 0.310 0.302
Note: The parameters used are NR = 10, NY = 1, t = 0.6, and D = 4. Z = 0.2 and Z = 0.3 are used separately to represent purifying selection. Z values are averaged over 2,000 pairs of simulated sequences.
Cumulative percentage of NR - NY for dog, human-mouse and human-chimp orthologs at a bin size of 0.2 Figure 6
Cumulative percentage of NR - NY for human-dog, human-mouse and human-chimp orthologs at a bin size of 0.2. We divided the x-axis into 100 bins and plotted the cumulative percentage of NR - NY from the orthologous genes of human-dog, human-mouse and human-chimp.
Ŧ Ŧ
, -+ .
2345
NŦN!
6Ŧ4
6Ŧ
We believe that J-MYN may become a useful tool for large-scale studies, when ML-based methods (such as GY) are deemed time-consuming.
Discussion
Why should we continue developing Ka/Ks methods? A major limitation of Ka/Ks methods, mentioned in liter-atures, is their poor ability for detecting positive selection (adaptive selection) [6,46-52]. To detect positive selection at sites requires that Z value averaged over all branches is >1 and to detect positive selection along lineages requires
Z value averaged over all sites is >1 [6]. Therefore, Ka/Ks methods are only useful to weight average selection pres-sure over sites and branches. They may not be able to detect positive selection for some highly conserved pro-teins that are mostly invariable but become fragile when a single site alters. Other detrimental cases include trans-membrane domains where high variability may not change its physiochemical property. To overcome the weakness, there have been methods developed, such as Likelihood Ratio Test (LRT) [53-56] implemented in PAML [57] and Hyphy software [58], to identify positive
selection [45,59-61], which tend to be qualitative. An obvious pitfall of these methods is that they do not weigh the relative degree of two genes under negative selection. Ka/Ks methods can perform better in this regard [38,62-64] as they tend to be more quantative. In addition, Ka/Ks methods can be readily extended from our current work to detect the sequence alternations that lead to protein struc-ture changes and positive selection, in combination with other techniques, such as ancestral sequence reconstruc-tion [65-67] and primary [68,69] or tertiary windowing [70,71]. Therefore, we believe that the two different lines of methods (LRT-like methods and Ka/Ks methods) should also be useful under appropriate conditions.
Why should we introduce new parameters?
With the introduction of the parameter D, our method J -MYN shows significant improvements when compared with the other two related methods in both simulation and tests on real data. As J-MYN assumes that evolution-ary rate at each site follows J-distribution, we found that the parameter D has observable effects under different evolution rates. For instance, when Z >= 1, J-MYN Table 4: Proportions of synonymous sites (S%) and estimates of Ka, Ks and Z
Method NR - NY > 0.4 NR - NY < -0.4 |NR - NY| d 0.4
S% Ka Ks Z S% Ka Ks Z S% Ka Ks Z
human-dog orthologs
GY 24.80% 0.0691 0.4936 0.1483 24.72% 0.0723 0.4676 0.1639 24.34% 0.0874 0.5347 0.1704
YN 25.09% 0.0674 0.4900 0.1531 24.96% 0.0700 0.4750 0.1695 24.27% 0.0928 0.5412 0.1746
MYN 23.88% 0.0664 0.5748 0.1361 26.16% 0.0711 0.4495 0.1800 24.22% 0.0939 0.5596 0.1727
J-MYN 23.93% 0.0681 0.6462 0.1266 26.28% 0.0733 0.4962 0.1713 24.29% 0.0962 0.6227 0.1620
human-mouse orthologs
GY 25.86% 0.0901 0.7163 0.1291 25.65% 0.0961 0.7118 0.1390 25.52% 0.1128 0.7422 0.1543
YN 26.07% 0.0877 0.7002 0.1344 25.69% 0.0923 0.6904 0.1465 25.31% 0.1091 0.7439 0.1564
MYN 24.83% 0.0863 0.8321 0.1157 26.93% 0.0940 0.6527 0.1566 25.24% 0.1090 0.7734 0.1526
J-MYN 24.91% 0.0894 0.9501 0.1058 27.10% 0.0980 0.7390 0.1468 25.35% 0.1140 0.8934 0.1398
human-chimp orthologs
GY 25.47% 0.0273 0.0663 0.5118 25.18% 0.0262 0.0579 0.5685 25.98% 0.0228 0.0420 0.4364
YN 25.79% 0.0302 0.0646 0.5237 25.33% 0.0297 0.0564 0.5790 23.81% 0.0506 0.0595 0.3893
MYN 24.34% 0.0299 0.0719 0.4792 26.87% 0.0307 0.0516 0.6312 23.72% 0.0493 0.0601 0.3863
J-MYN 24.34% 0.0305 0.0741 0.4768 26.89% 0.0324 0.0530 0.6309 23.72% 0.0515 0.0626 0.3847
Table 5: Timing comparisons on YN, MYN, J-MYN and GY methods
Method Time Required, seconds (hr:min:sec) Average
human-dog human-mouse human-chimp
YN 332(0:5:32) 389(0:6:29) 280(0:4:40) 334(0:5:34)
MYN 529(0:8:49) 641(0:10:41) 396(0:6:36) 522(0:8:42)
J-MYN 533(0:8:53) 639(0:10:39) 395(0:6:35) 522(0:8:42)
GY 154309(42:51:49) 233899(64:58:19) 602381(167:19:41) 330196(91:43:16)
remains stable. We also observed that selective pressure can overwhelm the variable substitution rates across sites and it becomes the most influential factor when increas-ing dramatically. Therefore, when we consider strong pos-itive selection and neutral evolution, the effect of variable substitution rates across sites can be somewhat neglected. In addition, more parameters often lead to increase of complexity of an algorithm, resulting in the decrease of efficiency. However, we hold the view that proper intro-duction of parameters is worthwhile.
It has been noticed that the majority of the evolutionary selections are actually negative in nature, and the state-ment is confirmed by our analyses on real data. When Z varies from 0.1 to 1, we selected optimal D to minimize biases and found that J-MYN is very sensitive when D changes under negative selection. Furthermore, the opti-mal D becomes smaller when Z becomes larger under neg-ative selection, and the effects of various substitution rates across sites become evident under negative selection, emphasizing the importance of our method in the calcu-lation under negative selection.
As to J-Tamura-Nei model, it usually leads to higher vari-ations, especially in phylogeny analyses. However, we found some multi-level observations in both simulation and real data testing (see in additional file 1). The differ-ence of variations of Z between YN and J-MYN (or MYN) seems to be correlated to the value of NR - NY, when results in Tables S2-S6 were examined together. For instance, when NR-NY < 0, Z values vary more when J-MYN is used than YN is. As NR-NY increases, the Z variation values from
J-MYN decrease, leading to lower numbers than those of YN. The variations of Z calculated with J-MYN are slight higher than those yielded from MYN in most cases but not all. These results reflect the distinction between the usage of J-Tamura-Nei model (or Tamura-Nei model) in KaKs computation and that of phylogeny reconstruction.
How the variable substitution rates influence the Ka/Ks calculations?
We begin our discussion with how Dparameter in J-MYN improves MYN method. It is known that ignoring rate var-iation among sites leads to underestimation of both the sequence distance and the transition/transversion rate ratio N (both NR and NY) [4]. N is used not only in estimat-ing S and N but also in generatestimat-ing a transition probability matrix for estimating Sd and Nd. If we derive an approxi-mate formula for Z = Ka/Ks | (Nd/N)/(Sd/S) (the symbol of "|" is used to emphasize the absence of correction for multiple substitutions), Z is composed of two parts: Nd/N and Sd/S. For purifying selection, synonymous substitu-tions occur more frequently than nonsynonymous ones so we should only focus on Ks (Sd/S). Since N decrease is related to the reduction of substitution rate between two
codons, underestimation of N leads to underestimation of Sd. In addition, nucleotide transitions between two codons are more likely to be synonymous especially at the third codon positions, underestimation of N leads to underestimation of S. However, the influence of N on Sd is significantly stronger than that on S. As a consequence, an underestimated N, when used in MYN, may give rise to underestimation of Sd/S, resulting in overestimation of Z as compared with J-MYN. Our theoretical deductions are consistent with both simulation (Figure 2) and real data (Table 4).
In addition, we found the optimal Dvalues fall between 1 and 5 (Figure 3). In these cases, the distribution of gamma values is bell-shaped, meaning that most sites have inter-mediate rates around 1 whereas a few sites have either very low or very high rates [4]. When selection pressure increases, the number of sites of intermediate rates decreases (Figure 3). In particular, when D approaches infinity, the distribution diminishes into the model of a single rate for all sites, which is used in MYN method. If D
d 1, the distribution has a highly skewed L-shape, suggest-ing that most sites have either very low rates of substitu-tion or are nearly "invariable" with possible substitusubstitu-tion hotspots. Furthermore, estimates of D from real data in many species over multiple sequences show increases from 0.26 to 3.0, and this relatively wide window allows us to explore the spectrum of different substitution rates over different sites [4]
Applications of our new method
Divergence time (t) is another parameter important for the estimation of Ka and Ks. When divergence time reaches the extremes, the compared sequences among genes often vary considerably and their corresponding protein structures may changed over greater evolutionary time scale. Therefore, under such conditions it may become meaningless to calculate the substitution rates of such genes. However, most methods for calculating Ka and Ks use homologous genes for estimating substitution rates among closely-related species or within close line-ages, and observable selections are mostly negative. Since our method J-MYN has better performance than other methods when Z < 1, it provides a useful alternative for more comprehensive Ka and Ks calculations.
been always considered to be the method of choice [13,33]. It has been suggested in the literature that GY and YN both give rise to similar estimates on Ka and Ks prima-rily due to the fact that they both take account of major dynamic features of DNA sequence evolution, including transition/transversion rate and nucleotide/codon fre-quency biases [12,42]. As J-MYN performs better than other methods under certain conditions, despite the fact that its advantages seemed less obvious under other con-ditions, we believe that J-MYN may become a useful tool for large-scale sequence analysis when ML-based methods are deemed time-consuming.
Conclusion
We compared J-MYN with two other methods, YN and MYN, by examining long sequences, performing compu-ter simulations, and analyzing real datasets. Since neglect-ing the variation of substitution rates among different sites may lead to biased estimates, our new method has minimal deviations when parameters vary within normal ranges defined by empirical data. J-MYN performs better when genes are under strong purifying selection and com-parable to the other two methods when genes are under positive selection or remain neutral. In addition, we showed that biased estimates of Ka and Ks primarily orig-inate not only from biased estimates of N–or both NR and
NY–but also from the neglect of variable substitution rates.
Methods
Mutation modelIn Markov-chain models of codon substitution, the codon triplet is considered as the unit of evolution, and a Markov chain is used to describe substitutions from one codon to another codon [4]. In detail, the state space of the chain is the sense codons with regard to the canonical genetic code. Stop codons are not allowed inside a functional pro-tein and are not considered. Although there are several mutation (substitution) models that take different sequence variation features into account, in this report we limit our discussions to the Tamura-Nei Models [24] (see Table S1 in additional file 2 for details).
J-MYN also needs a transition probability matrix similar to YN and MYN. We assigned the substitution rate qij from any codon i to j (i z j) to generate a transition probability matrix as follows:
The diagonal elements of the transition probability matrix, Q = {qij}, are determined based on the mathemat-ical requirement that the row sums equal to zero. The matrix is normalized with the result that the sum over non-diagonal terms is 1.
Estimating NR and NY
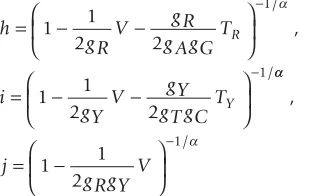
To generate the transition probability matrix, we need to estimate NR and NY. Similar to YN and MYN, we calculated four nucleotide frequencies (gT, gC, gA, gG), proportions of transitional differences between purines (TR), and between pyrimidines (TY), and the proportion of transver-sional differences (V) from compared sequences:
where gR = gA + gG and gY = gT + gC. Note that D is the square of the inverse of the variation coefficient in the gamma function.
We then used equation 3 to estimate NR and NY.
The detailed procedures for deducing NR and NY were sum-marized in additional file 2. We also made other modifi-cations accordingly, such as using NR and NY to estimate S and N, generating relevant transition probability matrix (Equation 1), considering different transitional evolution pathways to count Sd and Nd, and correcting for multiple substitutions when estimating Ka and Ks (Equation 4; [24]).
The algorithm
When compared to MYN and YN, our J-MYN method considers that the rate of nucleotide substitution O approximately follows J-distribution. In fact, if the rate of nucleotide substitution Ois the same for all sites consid-ered, the model becomes the model that is used in MYN.
qij=
0,if i and j differ by more than one differnce ,if i
j
S aand j differ by a synonymous transversion
,if i and
R j
N S jj differ by a synonymous transition between purines
,
Y j
N S iif i and j differ by a synonymous transition between pyrimmidines ,if i and j differ by a nonsynonymous transvers
j
ZS iion
,if i and j differ by a nonsynonymous transition
R j
ZN S bbetween purines
,if i and j differ by a nonsynonymous
Y j
ZN S transition between pyrimidines
⎧ ⎨ ⎪ ⎪ ⎪ ⎪ ⎪ ⎩ ⎪ ⎪ ⎪ ⎪ ⎪ (1) h
g RV
g R g AgGT
i
gY V gY gT gCT
R Y =⎛ − − ⎝ ⎜ ⎞ ⎠ ⎟ =⎛ − − ⎝ ⎜ ⎞ ⎠ ⎟ − − 1 1 2 2 1 1 2 2 1 1 / / , D D D D , / j
g RgY V
=⎛ − ⎝ ⎜ ⎞ ⎠ ⎟ − 1 1 2 1 (2)
N D E
N D E
R
Y
h gY j g R g R j g R i g R j gY
gY j gY
= = − × − × − = = − × − × − 1 2 / , / (3)
d g AgG
g R h gT gC
gY i g g
g AgGgY g R
gT gCg R
gY j g g g g
R Y A G T
= + +⎛ − −
⎝
⎜ ⎞
⎠
⎟ − −
2D CC−g gR Y
J-MYN uses an iterative approach to estimate Ka and Ks. Before iteration, J-MYN computes nucleotide frequencies (regarding to the three codon positions), NR, NY, S, and N from the sequences to be analyzed. Based on the F3 × 4 model [36], codon frequencies are calculated by multiply-ing each nucleotide frequencies. NR and NY are estimated from four-fold degenerate sites at the third codon position and non-degenerate sites. S and N are calculated by using
NR, NY, and codon frequencies. J-MYN chooses initial val-ues for t and Z as starting point for iteration. It generates a transition probability matrix that represents substitution probabilities from one codon to another by using Z, t, N, and codon frequencies. This transition probability matrix is subsequently used to deduce Sd and Nd and for new esti-mates of Z and t. J-MYN repeats the calculation for another transition probability matrix, until the algorithm converges.
Comparative analysis on Ka and Ks estimations
We used simulated sequences generated from hypotheti-cal common ancestral sequences for our comparative analysis by randomly choosing codons (61 excluding stop codons) from the ancestral sequences according to codon frequencies that were derived from three empirical data-sets: (1) equal codon frequencies [13], (2) human codon frequencies deduced from 39,420 human protein-coding genes from ENSEMBL database (Release 35; [37]) and (3) rice codon frequencies deduced from 19,079 rice protein-coding genes [38] (see in additional file 1).
In addition to codon frequencies, we also have to fix or choose ranges of other parameters for the simulation, including sequence length, divergence time (t), two ratios of transitional rate between purines (NR) and between pyrimidines (NY) to transversional rate, and selective pres-sure Z. Although Z varies from gene to gene, Z = 1 and 3 can be regarded as "typical values" for neutral mutation and positive selection, respectively [3,13,67], which are observable from real datasets. Since most calculated Z val-ues indicate negative selection and variation of parameter
D has stronger influence under negative selection, we ana-lyzed the variation of Z in a range of 0.1 to 0.9 for the eval-uation of effects of D on Z. To accurately examine the effect of one parameter and to avoid stochastic errors aris-ing from other factors, we generated 2,000 pairs of sequences. Three orthologous gene sets were downloaded from NCBI's HomoloGene database (Build 61), which contained 14,725 human-dog, 16,368 human-mouse, and 15,646 human-chimp gene pairs [72]. We considered "NA" occurrence (in any of Ka, Ks or Z) as unreliable data and filtered the orthologous pairs (extremes in sequence homology) that have such labels, and 14,323 human-dog, 16,066 human-mouse, and 12,351 human-chimp gene pairs were remained. The datasets were used for compar-ing J-MYN with other methods.
Competing interests
The authors declare that they have no competing interests.
Authors' contributions
DPW deduced formulas and analyzed the data. DPW, HLW and SZ drafted the manuscript. SZ programmed this new method. DPW, HLW and SZ carried out computer simulations. JY supervised the research and revised the manuscript. All authors read and approved the final man-uscript.
Reviewers' comments
Reviewer 1Kateryna Makova (assisted by Mr. Chungoo Park), Center for Comparative Genomics and Bioinformatics, Depart-ment of Biology, 305 Wartik Lab, Penn State University, University Park, PA, 16802
In this paper, the authors suggest a new algorithm, called
J-MYN, to accurately estimate nonsynonymous and syn-onymous substitution rates (Ka and Ks) of protein-coding DNA.
The J-MYN considers the variation of substitution rates among different sites in a sequence, which is overlooked by existing methods, and shows that their unequal substi-tution rates affect Ka and Ks.
Specific comments
1. Authors should highlight standard deviations of Z (as well as Ka and Ks) in all tests and show significance of dif-ference in all comparisons.
Authors' response
Agreed. We added the standard deviations for the calculations of Z, Ka, Ks and S% in key analyses in the supplementary materials.
2. To represent distinct codon usages by two genomes (human and rice), authors should reveal their codon usage difference in the paper.
Authors' response
Agreed. We added the tables for human codon frequencies and rice codon frequencies to the supplementary materials.
3. Why were some tests carried out for rice genome, while the other tests for human genome? For example, rice sequences (and not human sequences) were used to study the effect of sequence lengths.
Authors' response
differences when use different codon frequencies. Under most conditions, we chose to use human codon frequencies.
4. How are optimal D values statistically determined in each test?
Authors' response
We added the details to the supplementary materials.
5. The authors find that human-chimp orthologs have higher Z values than human-dog (or human-mouse) orthologs and thus claim that many genes (i.e., 1075 from human-chimp orthologs; 25 and 14 for human-dog and human-mouse, respectively) evolve under strong positive selection. However, this is incongruent with Bakewell et al. (2007; PMID: 17449636) in terms of the number of genes under positive selection and Z values. Authors should discuss the difference in detail.
Authors' response
Bakewell et al[44]indeed identified two gene sets, 154 and 233 positive selected genes or PSG for human and chimpanzee lin-eages, respectively, the authors also claimed that the branch-site likelihood method was not able to detect all PSGs according to their results from computer simulation. Therefore, we speculate that both their and our estimates about the numbers of PSG are not thorough enough, limited by our methodology. In our calcu-lation, we did not distinguish the two lineages, only computed the average values across the lineages, and did not consider the common ancestor of human and chimpanzee. We believe that only an in-depth population genetic analysis may resolve such issues. As far as Z is concerned, our methods are based on the raw definition of Ka/Ks and their methods are based on branch-site test. Interestingly, most of the functional categories of PSG genes in both studies overlap significantly, especially in "protein metabolism & modification" and "stress response and immu-nity".
6. Regardless of the number of codons and divergence time (t), why do all three methods (J-MYN, MYN, and YN) overestimate Z values?
Authors' response
We believe that this is perhaps due to similar assumptions with the same parameter settings (i.e. NR = 10, NY = 1) in the two calculations. However, the differences are also obvious as we tried to demonstrate throughout our manuscript.
7. It is not clear how the "unreliable data" from three orthologous gene sets were excluded.
Authors' response
We addressed this in our revised manuscript.
8. It is not clear how multiple splicing variants for each gene were handled to obtain codon frequencies.
Authors' response
We did not distinguish splicing variants in our study. In other words, we assumed that codon frequencies are the same for all possible alternatively spliced forms.
9. It is surprising that a set of human-dog gene pairs took longer to compute Ka/Ks ratios than that of human-chimp gene pairs(533 sec versus 395 sec for J-MYN), even though the number of human-dog gene pairs was smaller than that of human-chimp gene pairs (14,725 versus 15,646).
Authors' response
As the sequence variation of individual gene pairs governs the time for the calculation, the required time is not proportional to the number of gene pairs but the number of effective sites.
Reviewer 2
David A. Liberles, Department of Molecular Biology, Uni-versity of Wyoming, Laramie WY 82071, USA
"J-MYN: A new algorithm for estimating Ka and Ks with consideration of variable substitution rates" by Wang, Wan, Zhang, and Yu describes a more model rich version of the original Yang and Nielsen 2000 model [13]. Previ-ous work added parameters to differentiate between purine transitions and pyrimidine transitions [14]. The current work adds a gamma distribution on top of the pre-viously described work.
Authors' response
We agree with reviewer's excellent explanation why J-MYN is capable of improving the performance of omega calculation. Modeling D at the amino acid level avoids suffering from the parameter redundancy especially when genes are subjected to negative selection as in one of our unpublished results, we found that the interplay of D parameter and other evolutionary fea-tures may show some degrees of redundancy.
The authors show the improved performance of J-MYN on simulated data, where the correct answer is known. This is necessary but not sufficient to support the use of additional parameters on real data, as the model is effec-tively recovering itself on simulated data. The authors do apply J-MYN to mammalian comparative genomic data. However, it should be possible to evaluate the likelihood of the sequence data given the model and its parameteri-zation for J-MYN compared to simpler models and to evaluate the performance of the models with AIC, even if the methods are approximate rather than proper likeli-hood estimates.
Authors' response
In our previous work, we did incorporate AIC to KaKs calcula-tions [42]and found that the selected models in the calculation did not depend on combinations of various parameters. We speculate that J-MYN perhaps may not be the best choice under certain conditions, when the smallest AIC is considered as the criteria. We will incorporate AIC into our new model and the updated KaKs Calculator (the software through model selection and model averaging).
A more minor point is that the authors suggest that approximate methods need to average over all sites or all branches. Based upon earlier work using ancestral sequence reconstruction coupled with counting methods [65-67], approximate methods have been developed or can easily be extended from current work based upon pri-mary windowing to detect selective sweeps [68,69] and tertiary windowing to detect structural covariation leading to positive selection [70,71]. This should probably be dis-cussed when discussing the power of these methods.
Authors' response
We expanded our discussion into this issue. The power of detect-ing positive selection in KaKs methods certainly can be enhanced by introductions of ancestral sequence reconstruction and sliding windows. However, it is still an interesting question as which one is better when compared to the LRT methods.
Further development of models based upon mechanistic molecular and biological underpinnings is always a wel-come addition to the literature. A number of problems from multiple sequence alignment to amino acid-based phylogeny to problems in detecting positive selection
suf-fer from the divorce of common models from underlying processes. Well-performing mechanistic models will be broadly applicable across bioinformatics.
Authors' response
We fully agree with this comment. In the real world, sequence analysis can be complex and difficult. Therefore, models consid-ering more biological parameters lay foundations for broader applications, especially in the field of molecular evolution (phy-logeny tree reconstruction and mechanics of evolution dynam-ics).
Reviewer 3
Zhaolei Zhang, Banting & Best Dept. of Medical Research (BBDMR), Department of Molecular Genetics, University of Toronto, 160 College St., Room 608, Donnelly CCBR Building, Toronto, ON M5S 3E1, Canada
"J (gamma)-MYN: A new algorithm for estimating Ka and Ks with consideration of variable substitution rates"
Authors: Da-Peng Wang, Hao-Lei Wan, Song Zhang, and Jun Yu.
General comments
This manuscript describes a new method to estimate the ratio of Ka/Ks taking into account the evolutionary rate variation. Ka/Ks ratio is commonly used as an indicator of selective pressure acting on protein-coding genes. Current methods mostly use simplified substitution models, which may have effect on the estimation of Ka/Ks. Here, based on their previous work, the authors present a new method that the evolutionary rates across sites are mod-eled by a gamma distribution. Using both simulated and real data, the authors show that the new method performs better than current methods under some conditions.
The novelty of this manuscript is that this is the first Ka/Ks estimation method that considers the rate variation among sites. It is an important contribution to the scien-tific communities that use Ka/Ks in their research, and likely will open avenues for new researches in this area.
Specific comments
I found the overall writing is clear, albeit a little verbose at some places.
Authors' response
We revised the manuscript again for clarity.
Concern of overfitting
Authors' response
We would like to address this issue as it has been a major con-cern all along. First, more complex models (e.g. allowing for the correlation of substitution rates at adjacent sites and thus parameter-rich) used in phylogenetic analyses usually produce similar results to simple gamma models [31]. Second, the oppo-site is usually true also as some methods with simple assump-tions often lead to similar results over complex ones. For instance, Nei [7]developed a simple method (giving no weights to different types of codon substitutions) that gives essentially the same results as those more complicated methods (such as giving different evolutionary pathways different weights). Third, more parameters usually lead to higher sensitivities to sequence variations albeit untenable in certain cases, especially when testing some real data. However, setting more parame-ters, especially by estimating their optimal ranges, we should be able to assess the relationships between parameters and the characteristics of the real data as well as tradeoffs between parameters and models.
Specific examples
Is it possible for the authors to show one specific example (a gene) that the new method out-performs other meth-ods, i.e. the conclusion is more biologically relevant?
Authors' response
Limited by the manuscript length, we decided to show our anal-ysis on one real gene in the "testing real data" section.
Reviewer 4
Shamil Sunyaev, Harvard Medical School, Boston, MA, United States
This manuscript presents a new method to compute Ka and Ks. The authors incorporated Tamura-Nei model into the Yang-Nielsen approach. This extension of the method would be of interest to experts in molecular evolution. I have a few comments and suggestions.
1) The manuscript would benefit from a much clearer jus-tification of the method and discussion of its applicabil-ity. Tamura-Nei model was developed for the control region of the mitochondrial genome. Is the model with the uniform selective constraint (reflected by parameter omega) and raw mutation rates following gamma distri-bution realistic for nuclear protein coding genes? The dominant source of mutation rate variation in mamma-lian genes (used by the authors for testing the method) is likely to be the context-dependency, predominantly due to CpG contexts. Is the gamma distribution model capa-ble of capturing this variation? Different rates for transi-tions between purines and pyrimidines imply strong strand bias. Is this a realistic assumption in nuclear genes and does it justify incorporation of additional parame-ters? Also, Tamura-Nei distance is known to have higher
variance. How is this reflected in the performance of the method? I would suggest discussing these issues in the introduction and discussion sections.
Authors' response
We are grateful to the valuable suggestions and revised relevant text accordingly. After it was brought forth by Professor Ziheng Yang in researching globin genes [21], gamma distribution has been widely used in characteristic of variable substitution in coding genes [74], especially in phylogeny analyses. In our method, we only computed the raw omega value (averaging all sites in a gene) based on raw mutation rates following gamma distribution. But this can be easily expanded to omega varia-tions among sites in a manner using the sliding-window meth-ods when necessary. It was proposed that nucleotide substitutions in both coding and noncoding regions are context-dependent in the sense that substitution rates depend on the identity of neighboring bases by adopting an approach of incor-porating gamma distribution [29]. Furthermore, models that allow for the correlation of substitution rates at adjacent sites were also developed [30]. However, as these models tend to pro-duce results similar to the simple gamma model and variations of D can make the distribution suitable for accommodating dif-ferent levels of rate variation in various data sets [31], we chose the simple gamma distribution as the depiction of raw various mutation rates. As to the difference between purine and pyrimi-dine transitions, they are driven by potential underlying forces such as codon bias to the extent that it is correlated across codons in a gene and the chemistry (specificity) of DNA syn-thesis, damaging agents, DNA polymerase, and DNA repair enzymes [73]. In our computer simulations, we found that the new method did not always have higher variations in related parameter estimations as in compared with other methods.
2) I suggest that the presentation of the manuscript will be improved. For example, it is not clear that by gamma dis-tribution of substitution rates (and, in general, by variable substitution rates) the authors mean gamma distribution of raw mutation rate rather than gamma distribution of omega.
Authors' response
Done. We revised the text to clarify this point. We do mean J distribution of the raw mutation rate rather than omega.
positive or negative selection and demonstration that the new method has higher power to detect selection (e.g. using fewer species or partial sequences). I understand, however, that this may be a subject of a separate study.
Authors' response
Agreed. We have removed the discussion on positive selection on the human-chimp dataset. We added an example for an evaluation of our new method. We are performing a systematic study on sequences from diverse evolutionary distances and planned to publish the results in separate manuscripts.
4) Is the software implementation of the method availa-ble?
Authors' response
Yes. Since the new integrated version of KaKs_Calculator 2.0 is still being programmed, a simple C++ source code package (can be used in Linux) is available upon request from the authors now.
Additional material
Acknowledgements
We thank Dr. Zhang Zhang and Miss Yanyang Zhi for their constructive comments on this manuscript. We are also grateful to Prof. Songnian Hu for many thoughtful suggestions and thank all staffs in Beijing Institute of Genomics for their sincere supports. We thank four reviewers for several very good suggestions. This work was supported by the National Basic Research Program of China (2006CB910404) awarded to JY.
References
1. Gillespie JH: The Causes of Molecular Evolution Oxford University Press, USA; 1991.
2. Kimura M: The neutral theory of molecular evolution Cambridge, England, Cambridge University Press; 1983.
3. Li WH: Molecular Evolution. Sunderland, Mass. Sinauer Associ-ates; 1997.
4. Yang Z: Computational Molecular Evolution Oxford University Press, USA; 2006.
5. Hurst LD: The Ka/Ks ratio: diagnosing the form of sequence evolution. Trends Genet 2002, 18:486.
6. Yang Z, Bielawski JP: Statistical methods for detecting molecu-lar adaptation. Trends Ecol Evol 2000, 15:496-503.
7. Nei M, Gojobori T: Simple methods for estimating the num-bers of synonymous and nonsynonymous nucleotide substi-tutions. Mol Biol Evol 1986, 3:418-426.
8. Li WH, Wu CI, Luo CC: A new method for estimating synony-mous and nonsynonysynony-mous rates of nucleotide substitution considering the relative likelihood of nucleotide and codon changes. Mol Biol Evol 1985, 2:150-174.
9. Li WH: Unbiased estimation of the rates of synonymous and nonsynonymous substitution. J Mol Evol 1993, 36:96-99. 10. Pamilo P, Bianchi NO: Evolution of the Zfx and Zfy genes: rates
and interdependence between the genes. Mol Biol Evol 1993,
10:271-281.
11. Tzeng YH, Pan R, Li WH: Comparison of three methods for esti-mating rates of synonymous and nonsynonymous nucleotide substitutions. Mol Biol Evol 2004, 21:2290-2298.
12. Zhang Z, Yu J: Evaluation of six methods for estimating synon-ymous and nonsynonsynon-ymous substitution rates. Genomics Pro-teomics Bioinformatics 2006, 4:173-181.
13. Yang Z, Nielsen R: Estimating synonymous and nonsynony-mous substitution rates under realistic evolutionary models.
Mol Biol Evol 2000, 17:32-43.
14. Zhang Z, Li J, Yu J: Computing Ka and Ks with a consideration of unequal transitional substitutions. BMC Evol Biol 2006, 6:44. 15. Fitch WM: The estimate of total nucleotide substitutions
from pairwise differences is biased. Philos Trans R Soc Lond B Biol Sci 1986, 312:317-324.
16. Fitch WM, Margoliash E: A method for estimating the number of invariant amino acid coding positions in a gene using cyto-chrome c as a model case. Biochem Genet 1967, 1:65-71. 17. Fitch WM, Markowitz E: An improved method for determining
codon variability in a gene and its application to the rate of fixation of mutations in evolution. Biochem Genet 1970,
4:579-593.
18. Holmquist R, Goodman M, Conroy T, Czelusniak J: The spatial dis-tribution of fixed mutations within genes coding for proteins.
J Mol Evol 1983, 19:437-448.
19. Uzzell T, Corbin KW: Fitting discrete probability distributions to evolutionary events. Science 1971, 172:1089-1096.
20. Wakeley J: Substitution rate variation among sites in hyper-variable region 1 of human mitochondrial DNA. J Mol Evol 1993, 37:613-623.
21. Yang Z: Variations of substitution rates and estimation of evo-lutionary distances of DNA sequence. In PhD Thesis Beijing Agri-cultural University; 1992.
22. Jin L, Nei M: Limitations of the evolutionary parsimony method of phylogenetic analysis. Mol Biol Evol 1990, 7:82-102. 23. Li WH, Gouy M, Sharp PM, O'HUigin C, Yang YW: Molecular
phy-logeny of Rodentia, Lagomorpha, Primates, Artiodactyla, and Carnivora and molecular clocks. Proc Natl Acad Sci USA 1990, 87:6703-6707.
24. Tamura K, Nei M: Estimation of the number of nucleotide sub-stitutions in the control region of mitochondrial DNA in humans and chimpanzees. Mol Biol Evol 1993, 10:512-526. 25. Yang Z: Maximum-likelihood estimation of phylogeny from
DNA sequences when substitution rates differ over sites. Mol Biol Evol 1993, 10:1396-1401.
26. Yang Z: Maximum likelihood phylogenetic estimation from DNA sequences with variable rates over sites: approximate methods. J Mol Evol 1994, 39:306-314.
27. Yang Z, Goldman N, Friday A: Comparison of models for nucle-otide substitution used in maximum-likelihood phylogenetic estimation. Mol Biol Evol 1994, 11:316-324.
28. Hasegawa M, Kishino H, Yano T: Dating of the human-ape split-ting by a molecular clock of mitochondrial DNA. J Mol Evol 1985, 22:160-174.
29. Siepel A, Haussler D: Phylogenetic estimation of context-dependent substitution rates by maximum likelihood. Mol Biol Evol 2004, 21:468-488.
Additional file 1
Standard deviations of Z and supplementary method. Additional file 1 contains: (I) the standard deviations of Z values that are used in Figure 1, Figure 2, Figure 4, Figure 5 and Table 4; (II) human codon and rice codon frequencies; and (III) an approach of determining the optimal D values in each test.
Click here for file
[http://www.biomedcentral.com/content/supplementary/1745-6150-4-20-S1.pdf]
Additional file 2
Description of the Tamura-Nei model and the detailed derivations of
NR and NY. Additional file 2 contains supplementary tables and derivation process in this study. This file contains two sections: section I shows the description of the Tamura-Nei model and section II details the procedures for deducing NR and NY.
Click here for file