R E S E A R C H A R T I C L E
Open Access
Effect of region of interest on ADC and
interobserver variability in thyroid nodules
Xiang Zhou
1†, Chao Ma
2†, Zhi Wang
1, Jia-ling Liu
1, Yuan-peng Rui
1, Yue-hua Li
3and Yi-feng Peng
1*Abstract
Background:To determine the effect of region of interest (ROI) on tumor’s apparent diffusion coefficient (ADC) and interobserver variability in thyroid nodules.
Methods:Thirty-three individuals with 45 pathologically-confirmed thyroid nodules were assessed by preoperative diffusion-weighted imaging (DWI) with b values of 0 and 400 s/mm2, respectively. Two readers evaluated the ADC values of lesions based on three ROI techniques: whole-volume, single-slice and small solid-sample groups. Interobserver variability was analyzed for all ROI techniques, and the mean ADCs of benign and cancerous thyroid nodules were compared.
Results:For the mean ADCs of non-cancerous thyroid nodules, average differences and limits of agreement (LOAs) between readers were 0.00 [−0.17–0.17] × 10−3mm2/s for whole-volume ROI (ICC = 0.967), 0.00 [−0.26– 0.26] × 10−3mm2/s for single-slice ROI (ICC = 0.932) and−0.02 [−0.38–0.41] × 10−3mm2/s for small solid-sample ROI (ICC = 0.823). For the mean ADCs of cancerous thyroid nodules, average differences and LOAs between readers were−0.05 [−0.23–0.13] × 10−3mm2/s (ICC = 0.885), 0.01 [−0.23–0.25] × 10−3mm2/s (ICC = 0.839) and−0.07 [−0.52–0.39] × 10−3mm2/s (ICC = 0.579) for the three ROI methods, respectively. The mean ADC values were more scattered in the small solid-sample ROI group in comparison with the whole-volume and single-slice groups, in noncancerous and cancerous specimens. Of all three ROI techniques, whole-volume ROI-determined ADC had the highest combined sensitivity (80.0%), specificity (88.3%) and Youden index (0.683), with a cut-off of 1.84 × 10⁻³mm2/s.
Conclusions:The ROI method overtly affects ADC measurements in benign and cancerous thyroid nodules. Small solid-sample ROI yielded the worst interobserver variability of average ADC measurements.
Keywords:Thyroid nodule, DWI, ADC, Region of interest, MRI
Background
Thyroid nodules are commonly detected in the adult population, and can be diagnosed as noncancerous or cancerous. Diffusion-weighted imaging (DWI) is an emerging technique for evaluating head and neck tu-mors, representing a non-invasive method for measuring the diffusion of molecular water, which has the potential
to distinguish tissue properties and physiological
features. Recently, DWI with derived apparent diffusion coefficient (ADC) has been applied to differentiate noncancerous thyroid nodules from cancerous ones
quantitatively [1–20]. Because of the heterogeneity of tumor tissues, ADC measurements may depend on region of interest (ROI) selection. In DWI, ROIs ob-tained by three main ROI techniques, i.e. whole-volume, single-slice, and small solid-sample, have been applied
for obtaining the ADC values of tumors [21, 22].
However, it is rarely assessed for thyroid nodules. The current study aimed to evaluate the effect of ROI selec-tion on ADC measurements and interobserver variability in thyroid nodules.
Methods
Patients
Forty-five patients with thyroid nodules were recruited between September 2013 and December 2014, with signed
© The Author(s). 2019Open AccessThis article is distributed under the terms of the Creative Commons Attribution 4.0 International License (http://creativecommons.org/licenses/by/4.0/), which permits unrestricted use, distribution, and reproduction in any medium, provided you give appropriate credit to the original author(s) and the source, provide a link to the Creative Commons license, and indicate if changes were made. The Creative Commons Public Domain Dedication waiver (http://creativecommons.org/publicdomain/zero/1.0/) applies to the data made available in this article, unless otherwise stated.
* Correspondence:[email protected]
†Xiang Zhou and Chao Ma contributed equally to this work.
1Department of Radiology, Putuo Hospital, Shanghai University of Traditional
informed consent obtained from all participants. The in-clusion criteria comprised: diameter of thyroid nodules larger than 6 mm; no motion artifacts; no contraindica-tions for MRI; no history of thyroidectomy or radiother-apy. Eight cases were excluded for thyroid nodules smaller than 6 mm, which makes it hard to identify the border using ADC measurements. Four additional patients with obvious movement artefacts on DWI images were also ex-cluded. Therefore, 33 patients (7 males and 26 females; mean age, 52.2 ± 10.3 years; age range, 25–71 years) with 45 (30 benign and 15 malignant) thyroid nodules con-firmed by histopathological findings were finally enrolled in the current study. The histopathological types of the thyroid nodules are listed in Table1.
MRI
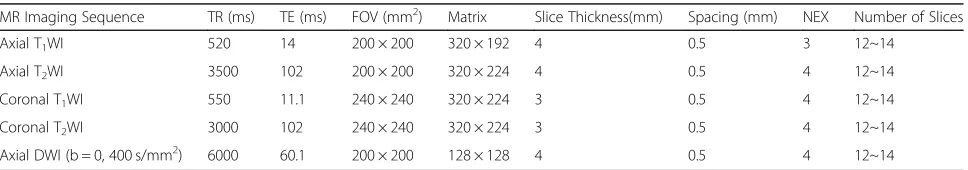
Imaging was carried out on a 1.5 T MR (Signa Excite HD Twinspeed, GE Healthcare, USA) using a four-channel array coil, by conventional MRI sequences and transverse single shot echo-planar DWI (b values, 0 and 400 s/mm2). The main parameters of MRI sequences are presented in Table2.
Data analysis
Inclusion and exclusion of patients were carried out by the same senior radiologist (10-year experience in head and neck radiology). The reader was not aware of histo-pathological findings. DWI images were analysed based on the lesion’s signal intensity relative to adjacent non-cancerous thyroid tissues on axial T1WI and T2WI.
DWI data and ADC maps were analysed with the AW 4.3 software (GE Healthcare). Two senior radiologists (10- and 8-year experience in head and neck radiology, respectively) independently measured the lesions’ADCs
slice technique, the ROI was defined by tracing a line along the perceived tumor margins on DWI of b400
(me-dian ROI area, 217 mm2; range, 33–970 mm2). In the whole-volume technique, ROIs were made along the perceived tumor borders on DWI of b400, covering the
whole tumor region on every tumor-containing slice (median ROI area, 896 mm2; range, 51–5201 mm2), and ADC values in all sections were averaged for further analysis.
Statistical analysis
Statistical analyses were carried out with the Medcalc software (Version 13.0.0.0, MedCalc software).
Inter-observer variability of tumor ADCs in all ROI
methods was assessed by determining interclass cor-relation coefficients (ICCs), with the values of 0–0.20, 0.21–0.40, 0.41–0.60, 0.61–0.80 and 0.81–1.00 reflect-ing poor, fair, moderate, good and excellent correla-tions, respectively [23] as previously proposed [24]. Average ADCs in various ROI selection techniques were compared by the Friedman test, with post-hoc
assessment by the Wilcoxon signed-rank test [25].
Statistical significance thresholds for the Friedman and post-hoc tests were set at P < 0.05 and P < 0.017 (0.05/3), respectively [21].
Results
Interobserver ADC variability
Axial DWI data and ADC maps for ADCs obtained with the various ROI selection techniques are depicted in Fig. 1. Average ADCs for benign and malignant thyroid nodules assessed by two readers employing various ROI selection techniques are presented in Tables 3 and 4, respectively.
Table 2Main scan parameters and sequences for thyroid gland evaluation
MR Imaging Sequence TR (ms) TE (ms) FOV (mm2) Matrix Slice Thickness(mm) Spacing (mm) NEX Number of Slices
Axial T1WI 520 14 200 × 200 320 × 192 4 0.5 3 12~14
Axial T2WI 3500 102 200 × 200 320 × 224 4 0.5 4 12~14
Coronal T1WI 550 11.1 240 × 240 320 × 224 3 0.5 4 12~14
Coronal T2WI 3000 102 240 × 240 320 × 224 3 0.5 4 12~14
For ADCs in benign thyroid nodules, average differ-ences and limits of agreement (LOAs) between readers were 0.00 [−0.17–0.17] × 10−3mm2/s for the whole-volume group (ICC = 0.967), 0.00 [−0.26–0.26] × 10−3 mm2/s for the single-slice technique (ICC = 0.932) and− 0.02 [−0.38–0.41] × 10−3mm2/s for the small solid-sample group (ICC = 0.823), as shown in Fig.2.
For ADCs in malignant thyroid nodules, average
differences and LOAs between readers were−0.05 [−
0.23–0.13] × 10−3mm2/s for the whole-volume group (ICC = 0.885), 0.01 [−0.23–0.25] × 10−3mm2/s for the single-slice technique (ICC = 0.839) and−0.07 [−0.52– 0.39] × 10−3mm2/s for the small solid-sample group (ICC = 0.579), as shown in Fig.3.
ADCs in the three ROI selection techniques
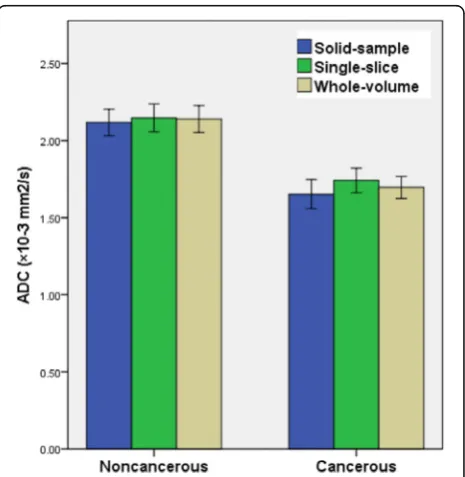
Average ADCs for noncancerous and cancerous thy-roid nodules obtained by the three ROI selection
techniques are summarized in Table 5 and Fig. 4,
re-spectively. The mean ADCs of b400 were more
scat-tered in the small solid-sample group in comparison with the other two techniques for both noncancer-ous and cancernoncancer-ous thyroid nodules. The Friedman test demonstrated no significant differences in ADCs for noncancerous thyroid nodules among the various
techniques (P= 0.797), while cancerous specimens
had significant differences (P< 0.001).
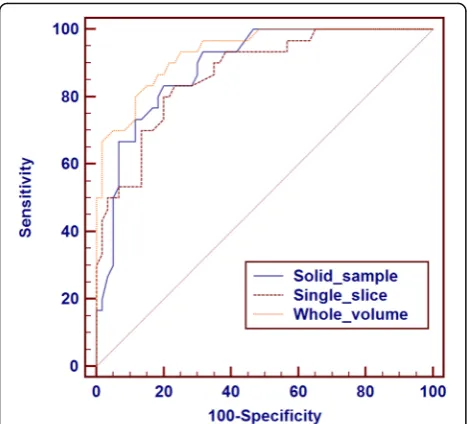
Diagnostic performances of the three ROI selection techniques in noncancerous and cancerous nodules
Compared with benign nodules, the areas under the ROC curves (AUC values) used to identify malignant nodules according to the ADCs obtained in the three ROI methods were 0.891, 0.870, and 0.934, respect-ively. Among the three ROI selection methods, the whole-volume method-derived ADC had the highest combined sensitivity (80.0%), specificity (88.3%) and Youden index (0.683), with 1.84 × 10⁻³mm2/s as cut-off. ROC data for the diagnostic performances of the three ROI techniques in differentiating noncancerous
and cancerous nodules are depicted in Fig. 5 and
Table 6.
Discussion
Our results demonstrated that the reproducibility of ADC measurements of both noncancerous and cancer-ous thyroid nodules in the whole-volume and single-slice methods was acceptable, with average interobserver bias not exceeding 0.1 × 10⁻³mm2/s and LOAs below 0.3 × 10⁻³mm2/s [21]. The reproducibility of average Fig. 1Images obtained from a 28-year-old female patient with histologically proven follicular thyroid carcinoma in the left lobe. In the whole-volume (c-j) and single-slice (g) methods, freehand ROIs were drawn along the high signal intensity border of the tumor to cover the entire tumor on DWI at b400. In the solid sample method, three circular ROIs were placed within the tumor areas of the highest cellular activity on DWI at b400. The tumor areas showed high signals on DWI at b400and low signals on the ADC map (k).a, Axial T2WI;
b, Axial T1WI;c-j, DWI (b400); K, ADC map
Table 3Inter-observer comparison of apparent diffusion coefficient (ADC) values (× 10−3mm2/s) for benign thyroid nodules obtained by the whole-volume, single-slice and solid-sample ROI methods by two independent readers
Parameters Solid-sample ROI Single-slice ROI Whole-volume ROI
Reader 1 Reader 2 Reader 1 Reader 2 Reader 1 Reader 2
ADC400 2.03
(1.88, 2.27) [1.48, 2.93]
2.02 (1.96, 2.20) [1.67, 2.95]
2.03 (1.91, 2.36) [1.73, 3.17]
2.06 (1.93, 2.18) [1.65, 3.24]
2.05 (1.94, 2.28) [1.80, 3.25]
2.06 (1.92, 2.19) [1.73, 3.26]
ADC measurements of both noncancerous and cancer-ous thyroid nodules in the solid-sample ROI selection method was inadequate because of the scattered mean ADCs in Bland-Altman test results, with the limits of agreement over ±0.30 × 10⁻³ mm2/s for the small solid-sample group. Mean ADC measurements have been employed to assess the ADC diagnostic threshold in dis-tinguishing noncancerous thyroid nodules from
cancer-ous ones in previcancer-ous studies [1–20]. However, the
reliability of ADC data obtained with the above ROI se-lection techniques in thyroid nodules has been rarely evaluated. Previously, the effects of the three ROI selec-tion techniques on tumor ADC and interobserver vari-ability in patients with pancreatic [21] and advanced colorectal [22] cancers have been assessed. The latter re-ports demonstrated that ROI size and placement
consid-erably impact the tumor’s mean ADC as well as
interobserver variability [21, 22], with the whole-volume technique showing the highest reproducibility [21, 22]. A consensus report by Padhani et al. advocated that basic standards for tissue diffusion coefficient assess-ment and reporting are necessary, and strongly warned against the use of small delineations in ADC measure-ments [26]. Therefore, a feasible method should be de-termined to standardize ADC measurements in thyroid nodules. Additionally, we found that the whole-volume method for ROI selection yielded the highest diagnostic
value for differentiating noncancerous and cancerous thyroid nodules.
The reproducibility of average ADC measurements for both noncancerous and cancerous thyroid nodules in the solid-sample ROI selection method was inad-equate because of the scattered mean ADCs in the Bland-Altman test. In the current study, the solid-sample technique was limited to the size and position in the tumor area, significantly varying from one pa-tient to another, which could be due to pathological and structural differences. In clinic, the solid-sample technique is commonly employed to obtain the ADCs of thyroid nodules [1–20]. Here, three circular ROIs were placed within solid tumor areas showing high signals on DWI. Two investigators independently
measured tumor ADCs using the solid-sample
method, without consensual selection of the same slice and position for the ROI in each case. Tumors usually show heterogeneity, especially in cases with thyroid goitre and adenoma, and ROIs should be placed away from cystic areas. In this study, the solid-sample method yielded the worst interobserver variability for mean ADC measurements. Therefore, the solid-sample method derived ROI is not optimal for ADC measurements of thyroid nodules.
Regarding benign thyroid nodules, obvious differences were observed in mean ADCs among the assessed ROI
selection techniques. In ADC measurement of malig-nant thyroid nodules by the small solid-sample tech-nique derived ROI, the most viable solid tumor portions were ncluded in the ROI, while blood vessels as well as the tumor border and cystic parts were ex-cluded. Blood vessels or the tumor boundary could elevate the ADCs due to the tissue having high blood perfusion along the vessel or boundary, which acceler-ates the diffusional movement of water molecules. In the whole-volume and single-slice methods, blood vessels and the tumor border were easily included in the ROI, which may lead to relatively elevated ADCs. Furthermore, previous studies reported markedly de-creased ADCs in cancerous nodules but not in non-cancerous and normal tissues [8–12], corroborating the current work. The solid portions of malignant thyroid nodules contain areas with hypercellularity and high nucleocytoplasmic ratio, resulting in reduced extracellular space and limited cellular diffusion, which may lead to low ADC values [15]. Additionally,
field strength, b-value selection and the
post-processing approach employed potentially contribute to the final ADC [27]. As stated above, DWI was car-ried out on the same 1.5 T scanner in one hospital with the single-shot echo-planar imaging sequence to
avoid instrument bias [1–12]. Some studies have used b values of 300, 400 and 500 s/mm2, respectively, for DWI of thyroid nodules, which can reduce the effects of blood perfusion to reflect the actual diffusion in the tissue [15–17]. Other studies have used higher b
values (over 600 s/mm2) for DWI of thyroid nodules,
which may increase susceptibility artefacts in DWI [2,
12]. The b value of 400 s/mm2 used in this study was suitable for the reproducibility of ADC measurements, and selected according to the signal-to-noise balance
and DWI image quality [28]. In addition, a
meta-analysis of DWI value in distinguishing cancerous Fig. 3Interobserver reproducibility of mean ADC measurements (× 10−3mm2/s) for all three ROI methods in malignant thyroid nodules. In Bland-Altman plots, the differences in mean ADC measurements (y-axis) were plotted against the mean ADCs (x-axis). Continuous line, mean absolute difference (bias); dashed line, 95% confidence interval of the mean difference (limits of agreement)
Table 5Comparisons of mean ADC400(× 10− 3
mm2/s) (± standard deviation, SD) measured by the whole-volume, single-slice and solid-sample methods for noncancerous and
cancerous thyroid nodules
Category Solid-sample ROI
Single-slice ROI
Whole-volume
ROI P
Noncancerous thyroid nodules
2.12 ± 0.32 2.15 ± 0.35 2.14 ± 0.34 0.797
Cancerous thyroid nodules
1.65 ± 0.22 1.74 ± 0.21 1.70 ± 0.19 < 0.001
thyroid nodules from noncancerous ones advocated for higher b values to increase diagnostic accuracy, al-though no notable differences in AUC values were
found between the low and high b value groups [29].
The limitations of this work should be mentioned. Firstly, the b value for DWI in this study was low. DWI examinations were carried out with a b value of
400 s/mm2 to minimize susceptibility artefacts and
ameliorate the SNR of the thyroid gland, while greater b values might show higher sensitivity and reflect the actual diffusion [29–31]. Additional b values for DWI should be assessed in further research, identifying the optimal b value for the detection of thyroid gland
lesions. Secondly, the effects of ROI selection
techniques on ADC measurement in distinct field strengths or b-values were not evaluated, which de-serves further investigation.
interest; T1WI: T1-weighted imaging; T2WI: T2-weighted imaging
Acknowledgements
Not applicable.
Authors’contributions
ZX, LJL, and RYP performed the majority of the experiments; ZX and MC substantially contributed to data analysis and interpretation, and manuscript drafting; ZX, MC, WZ, and LYH participated in the design of the study; PYF substantially contributed to study conception and design, and performed manuscript revision; all authors read and approved the final manuscript.
Funding
Not applicable.
Availability of data and materials
All data related to this work are available from the corresponding author upon reasonable request.
Ethics approval and consent to participate
This work had approval from the Institutional Review Board of Putuo Hospital Ethics committee. Forty-five individuals with thyroid nodules were recruited upon signed informed consent.
Consent for publication
Not applicable.
Competing interests
The authors declare that they have no competing interests.
Author details 1
Department of Radiology, Putuo Hospital, Shanghai University of Traditional Chinese Medicine, 164 LanXi Road, Putuo District, Shanghai 200062, China. 2Department of Radiology, Changhai Hospital of Shanghai, The Second
Military Medical University, Shanghai 200433, China.3Department of Radiology, No.6 People’s Hospital, Shanghai Jiaotong University, Shanghai 200233, China.
Received: 9 March 2019 Accepted: 30 June 2019
References
1. Erdem G, Erdem T, Muammer H, Mutlu DY, Firat AK, Sahin I, et al. Diffusion-weighted images differentiate benign from malignant thyroid nodules. J Magn Reson Imaging. 2010;31:94–100.
2. Wu Y, Yue X, Shen W, Du Y, Yuan Y, Tao X, et al. Diagnostic value of diffusion-weighted MR imaging in thyroid disease: application in differentiating benign from malignant disease. BMC Med Imaging. 2013;13:23.
3. Khizer AT, Raza S, Slehria AU. Diffusion-weighted MR imaging and ADC mapping in differentiating benign from malignant thyroid nodules. J Coll Physicians Surg Pak. 2015;25:785–8.
4. Razek AA, Sadek AG, Kombar OR, Elmahdy TE, Nada N. Role of apparent diffusion coefficient values in differentiation between malignant and benign solitary thyroid nodules. AJNR Am J Neuroradiol. 2008;29:563–8.
5. Schueller-Weidekamm C, Kaserer K, Schueller G, Scheuba C, Ringl H, Weber M, et al. Can quantitative diffusion-weighted MR imaging differentiate benign and malignant cold thyroid nodules? Initial results in 25 patients. AJNR Am J Neuroradiol. 2009;30:417–22.
Fig. 5ROC curves of ADC values measured by the whole-volume, single-slice and solid-sample methods for benign and malignant thyroid nodules
Table 6ROC analyses of ADC measured by the whole volume, single slice and small solid-sample methods for benign and malignant thyroid nodules
Category Small solid-sample ROI
Single-slice ROI
Whole-volume ROI
AUC 0.891 0.870 0.934
Cut-off value (×10−3 mm2/s)
1.90 1.90 1.84
Sensitivity 83.3% 83.3% 80.0%
Specificity 80.0% 78.3% 88.3%
6. Schueller-Weidekamm C, Schueller G, Kaserer K, Scheuba C, Ringl H, Weber M, et al. Diagnostic value of sonography, ultrasound-guided fine-needle aspiration cytology, and diffusion-weighted MRI in the characterization of cold thyroid nodules. Eur J Radiol. 2010;73:538–44.
7. Tamer F, Ali T. Solitary thyroid nodule: diagnostic yield of combined diffusion weighted imaging and magnetic resonance spectroscopy. Egypt J Radiol Nucl Med. 2017;48:593–601.
8. Shi HF, Feng Q, Qiang JW, Li RK, Wang L, Yu JP. Utility of diffusion-weighted imaging in differentiating malignant from benign thyroid nodules with magnetic resonance imaging and pathologic correlation. J Comput Assist Tomogr. 2013;37:505–10.
9. Wang J, Takashima S, Takayama F, Kawakami S, Saito A, Matsushita T, et al. Head and neck lesions: characterization with diffusion-weighted echo-planar MR imaging. Radiology. 2001;220:621–30.
10. Tezuka M, Murata Y, Ishida R, Ohashi I, Hirata Y, Shibuya H. MR imaging of the thyroid: correlation between apparent diffusion coefficient and thyroid gland scintigraphy. J Magn Reson Imaging. 2003;17:163–9.
11. Dilli A, Ayaz UY, Cakir E, Cakal E, Gultekin SS, Hekimoglu B. The efficacy of apparent diffusion coefficient value calculation in differentiation between malignant and benign thyroid nodules. Clin Imaging. 2012;36:316–22. 12. Mutlu H, Sivrioglu AK, Sonmez G, Velioglu M, Sildiroglu HO, Basekim CC, et
al. Role of apparent diffusion coefficient values and diffusion-weighted magnetic resonance imaging in differentiation between benign and malignant thyroid nodules. Clin Imaging. 2012;36:1–7.
13. Lu Y, Moreira AL, Hatzoglou V, Stambuk HE, Gonen M, Mazaheri Y, et al. Using diffusion-weighted MRI to predict aggressive histological features in papillary thyroid carcinoma: a novel tool for pre-operative risk stratification in thyroid cancer. Thyroid. 2015;25:672–80.
14. Nakahira M, Saito N, Murata S, Sugasawa M, Shimamura Y, Morita K, et al. Quantitative diffusion-weighted magnetic resonance imaging as a powerful adjunct to fine needle aspiration cytology for assessment of thyroid nodules. Am J Otolaryngol. 2012;33:408–16.
15. Yan B, Liu HJ, Wang CB, Li M, Min ZG, Ma SH, et al. ADC values in differentiation of benign and malignant thyroid nodules. Chin J Med Imaging Technol. 2011;27:510–4.
16. Ren S, Liu CH, Bai RJ. Value of diffusion weighted imaging in diagnosis of nodular lesions of thyroid: a preliminary study. Zhonghua Yi Xue Za Zhi. 2010;90:3351–4.
17. Li RK, Qiang JW, Liu W, Liao ZH, Zhang B, Li X, et al. Application of MR diffusion weighted imaging in the differentiation of malignant from benign thyroid focal lesions. Radiol Practice (China). 2009;24:719–22.
18. Aydın H, Kızılgöz V, Tatarİ, Damar Ç, Güzel H, Hekimoğlu B, et al. The role of proton MR spectroscopy and apparent diffusion coefficient values in the diagnosis of malignant thyroid nodules: preliminary results. Clin Imaging. 2012;36:323–33.
19. Ilica AT, ArtaşH, Ayan A, Günal A, Emer O, Kilbas Z, et al. Initial experience of 3 tesla apparent diffusion coefficient values in differentiating benign and malignant thyroid nodules. J Magn Reson Imaging. 2013;37:1077–82. 20. Lu Y, Hatzoglou V, Banerjee S, Stambuk HE, Gonen M, Shankaranarayanan A,
et al. Repeatability investigation of reduced field-of-view diffusion-weighted magnetic resonance imaging on thyroid glands. J Comput Assist Tomogr. 2015;39:334–9.
21. Ma C, Liu L, Li J, Wang L, Chen LG, Zhang Y, et al. Apparent diffusion coefficient (ADC) measurements in pancreatic adenocarcinoma: a preliminary study of the effect of region of interest on ADC values and interobserver variability. J Magn Reson Imaging. 2016;43:407–13. 22. Lambregts DM, Beets GL, Maas M, Curvo-Semedo L, Kessels AG, Thywissen
T, et al. Tumour ADC measurements in rectal cancer: effect of ROI methods on ADC values and interobserver variability. Eur Radiol. 2011;21:2567–74. 23. Cohen J. Weighted kappa: nominal scale agreement with provision for
scaled disagreement or partial credit. Psychol Bull. 1968;70:213–20. 24. Bland JM, Altman DG. Statistical methods for assessing agreement between
two methods of clinical measurement. Lancet. 1986;1:307–10. 25. Willemink MJ, Borstlap J, Takx RA, Schilham AM, Leiner T, Budde RP, et al.
The effects of computed tomography with iterative reconstruction on solid pulmonary nodule volume quantification. PLoS One. 2013;8:e58053. 26. Padhani AR, Liu G, Koh DM, Chenevert TL, Thoeny HC, Takahara T,
Dzik-Jurasz A, Ross BD, Van Cauteren M, Collins D, Hammoud DA, Rustin GJ, Taouli B, Choyke PL. Diffusion-weighted magnetic resonance imaging as a cancer biomarker: consensus and recommendations. Neoplasia. 2009; 11:102–25.
27. Dale BM, Braithwaite AC, Boll DT, Merkle EM. Field strength and diffusion encoding technique affect the apparent diffusion coefficient measurements in diffusion-weighted imaging of the abdomen. Investig Radiol. 2010;45:104–8.
28. Braithwaite AC, Dale BM, Boll DT, Merkle EM. Short and midterm reproducibility of apparent diffusion coefficient measurements at 3.0-T diffusion-weighted imaging of the abdomen. Radiology. 2009;250:459–65. 29. Chen LH, Xu J, Bao J, Huang XQ, Hu XF, Xia YB, Wang J. Diffusion-weighted
MRI in differentiating malignant from benign thyroid nodules: a meta-analysis. BMJ Open. 2016;6:e008413.
30. Ichikawa T, Erturk SM, Motosugi U, Sou H, Iino H, Araki T, et al. High-b value diffusion weighted MRI for detecting pancreatic adenocarcinoma: preliminary results. AJR Am J Roentgenol. 2007;188:409–14.
31. Huang WC, Sheng J, Chen SY, Lu JP. Differentiation between pancreatic carcinoma and mass-forming chronic pancreatitis: usefulness of high b value diffusion-weighted imaging. J Dig Dis. 2011;12:401–8.
Publisher’s Note