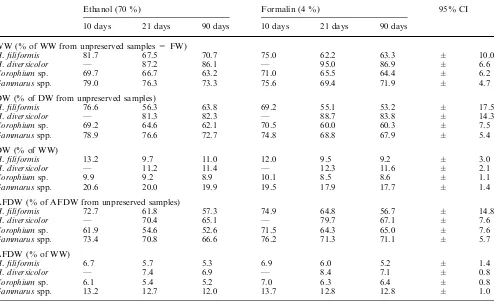
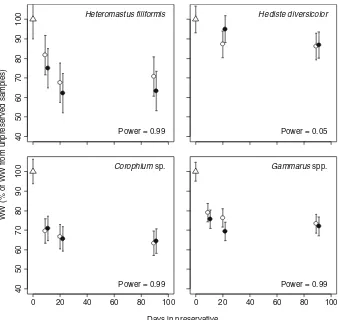
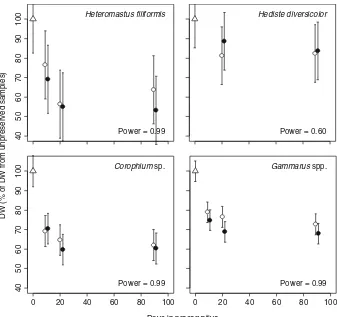
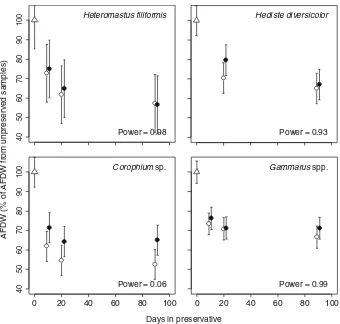
Preservation effects on wet weight, dry weight, and ash-free dry weight biomass estimates of four common estuarine macro-invertebrates: no difference between ethanol and formalin
8
0
0
Full text
Figure
Related documents