Glasgow Theses Service http://theses.gla.ac.uk/
Jordan, Patrick William (1993)
Consistency and usability.
PhD thesis.
http://theses.gla.ac.uk/5577/
Copyright and moral rights for this thesis are retained by the author
A copy can be downloaded for personal non-commercial research or
study, without prior permission or charge
This thesis cannot be reproduced or quoted extensively from without first
obtaining permission in writing from the Author
The content must not be changed in any way or sold commercially in any
format or medium without the formal permission of the Author
USABILITY
Patrick William Jordan
Submitted for the degree of Doctor of Philosophy (ph.D.) to the University of Glasgow Faculty of Science.
Research carried out in the Department of Psychology, : .
Submitted April 1993.
ABSTRACT
The thesis is divided into two main parts. In the first a multi-component
framework for usability is outlined. The components - guessability, learnability, experienced user performance. system potential. and re-usability - describe how users' performance on a task changes with experience. and each is associated with a different part of a learning curve. Definitions of the components are offered. as are examples of where each may be particularly important. The potential
advantages of the framework are then discussed. Anexperimental methodology and criteria based analysis method for quantifying the components of usability is proposed. This is demonstrated in the evaluation of a video cassette recorder. Non-experimental alternatives to this methodology are also considered.
The second part of the thesis is about the issue of consistency. A distinction between two types of consistency - set compatibility and rule compatibility - is proposed. Set compatibility is concerned with inter-task associations. whilst rule compatibility concerns the prior association of tasks and action-rules. Predictions are made about the effects of each type of consistency on the various components of usability. and these are tested in the context of a study of the invocation of menu commands. Results indicated that rule compatibility had the greater effect on early interactions. whilst set compatibility was more salient later on. A series of further studies is then reported. the aim of which was to investigate whether these effects were general across types and levels of interface. and other levels of task. Results mainly. but not entirely. indicated that they were.
Data from a more "ecologically valid" usability evaluation was re-analysed. to investigate whether the effects of consistency are important outside of artificial and tightly controlled experiments. Apparently they are - almost half of the
difficulties encountered during users' early interactions with a commercially available word processor could be attributed to either set or rule incompatibilities.
TABLE OF CONTENTS
Chapter 1. INTRODUCTION p. 19
PART I: USABILITY
Chapter 2. A MULTI·COMPONENT FRAMEWORK FOR
USABILITY p, 23
2.1 THE FIVE COMPONENT FRAMEWORK 2.1.1 Guessability
2.1.2 Leamability
2.1.3 Experienced user performance 2.1.4 System potential
2.1.5 Re-usability
2.1.6 Implications for usability evaluation. and design 2.1.7 Classifying users
2.2 PROSPECTS FOR GENERALISATION 2.2.1 Inter-user variability
2.2.2 Inter-task vru:iability
2.2.3 Experience on a task vs. experience on an interface 2.3 ARE THE COMPONENTS OF USABILITY INDEPENDENT?
2.4SUMMARY
Chapter 3. HOW THE COMPONENTS OF USABILITY CAN BE
MEASURED p. 37
3.1 EXPERIMENTAL METHODS
3.1.1 Jordan and O'Donnell's "semi-formal" analysis 3.1.2 Fitting an equation
3.1.3 Judging the data by eye
3.1.4 Testing for significant differences between trials 3.1.5 Quantifying system potential and re-usability
3.3 NON-EXPERIMENTAL TECHNIQUES 3.3.1 Empirical techniques
3.3.2 Focus groups
3.3.3 Think aloud protocols 3.3.4 Incident diaries 3.3.5 Feature checklists
3.3.6 Questionnaires
3.3.7 Semi-structured interviews
3.3.8 Predictive techniques
3.3.9 Task analyses
3.3.10 Expert walkthroughs
3.4 CHOOSING A METHOD
3.5SUMMARY
Chapter 4. APPLYING THE FRAMEWORK TO A USABILITY
EVALUATION OF A VIDEO CASSETTE RECORDER p. 54
4. 1 THE STUDY
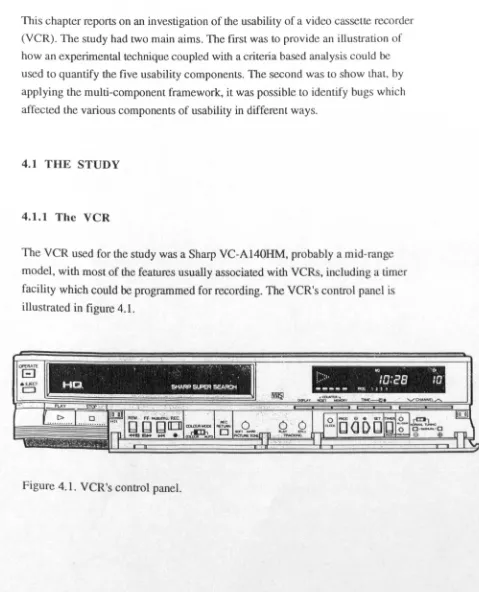
4.1.1 TheVCR
4.1.2 Subjects
4.1.3 Experimental design
4.1.4 Procedure
4.2 RESULTS, ANALYSIS, AND DISCUSSION
4.2.1 Sensitivity of performance measures
4.2.2 Guessability
4.2.3 Leamability
4.2.4 EUP
4.2.5 System potential
4.2.6 Re-usability
4.3 IDENTIFYING AND CLASSIFYING BUGS
PART 2: CONSISTENCY
Chapter 5. WHAT IS CONSISTENCY? p. 71
5.1 TOWARDS UNDERSTANDING CONSISTENCY: TIlE DEVELOPMENT OF FORMALISMS
5.1.1 Reisner's action language
5.1.2 Production rules
5.1.3 Set grammar
5.1.4 Task Action Grammar (TAG)
5.1.5 Agent Partitioning Theory (APT)
5.1.6 Set compatibility 5.1.7 Rule compatibility
5.1.8 Internal and external consistency
5.2SUMMARY
Chapter 6. HOW MIGHT CONSISTENCY AFFECT USABILITY?
p. 86
6.1 PREDICTIONS
6.1.1 Set compatibility and usability 6.1.2 Rule compatibility and usability
6.1.3 Assumptions underlying predictions
6.2 EMPIRICAL SUPPORT FROM PREVIOUS WORK
6.2.1 Morin and Grant (1955)
6.2.2 Barnard, Hammond, and Long (1981)
6.2.3 Carroll (1982)
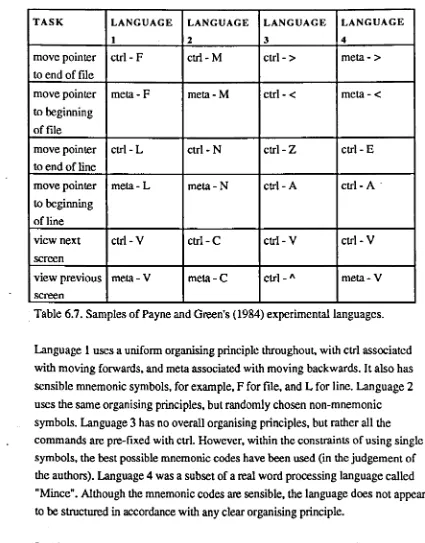
6.2.4 Payne and Green (1984)
6.2.5 Comments on the studies and possible future reading
6.3SUMMARY
Chapter 7. APPLYING THE THEORY TO MENU COMMANDS
p. 104
7.1 THE STUDY
7.1.1 Apparatus
7.1.2 Subjects
7.1.4 Procedure
7.2 RESULTS
7.2.1 Guessability
7.2.2 Leamability
7.2.3 EUP
7.2.4 Re-usability
7.2.5 Overall success
. 7.2.6 Inter-subject variability
7.3 DISCUSSION
7.4 CONCLUSIONS
7.5 SUMMARY
Chapter 8. TESTING THE GUESSABILITY PREDICTIONS p. 126
. 8.1 THE STUDY
8.1.1 Apparatus
8.1.2 Subjects
8.1.3 Experimental design
8.1.4 Procedure
8.2 RESULTS AND DISCUSSION
8.2.1 Comparison to guessability,leamability, and EUP 8.2.2 Discovering a schema inthe absence of set compatibility
8.2.3 Inter-subject variability
8.3SUMMARY
Chapter 9. APPLYING THE THEORY TO AN ICONIC
INTERFACE p. 141
9.1 THE STUDY
9.1.1 Apparatus
9.1.2 Subjects
9.1.3 Experimental design
9.2 RESULTS AND DISCUSSION 9.2.1 Guessability
9.2.2 Leamability 9.2.3 EUP
9.3SUMMARY
Chapter 10. APPLYING THE THEORY TO A COMMAND DRIVEN
INTERFACE p. 165
10.1 THE STUDY
10.1.1 Apparatus
10.1.2 Subjects
10.1.3 Experimental design
10.1.4 Procedure
10.2 RESULTS AND DISCUSSION
10.2.1 Guessability
10.2.2 Leamability
10.2.3 EUP
10.2.4 System potential
10.2.5 Re-usability
10.3 SUMMARY
Chapter 11. INVESTIGATING THE EFFECTS OF CONSISTENCY AT A HIGHER LEVEL OF AN INTERFACE, WITH HIGHER
LEVEL TASKS p. 184
11.1 LEVELS OF TASK
11.2 LEVELS OF INTERACTION
11.3 THE STUDY
11.3.1 Apparatus
11.3.2 Subjects
11.3.3 Experimental design
1104 RESULTS AND DISCUSSION
1l.4.1 Guessability without previous experience
1104.2 Guessability with previous experience of similar tasks
11.5 SUMMARY
Chapter 12. DOES CONSISTENCY MATTER IN "REAL"
INTERFACES? p. 20S
12.l THE STUDY
12.l.1 Subjects
12.1.2 Design
12.1.3 Procedure
12.1.4 Re-analysing for the effects of consistency
12.2 DISCUSSION
12.3 SUMMARY
Chapter 13. CONCLUSIONS
13.1 GENERAL OUTCOMES
13.1.1 Implications of the usability framework for design and evaluation
13.l.2 Implications of set and rule compatibility
p. 217
13.2 POSSmLE FUTURE RESEARCH
13.2.1 Developing non-experimental techniques for usability measurement
13.2.2 Total experience vs. experience on a task with an interface
13.2.3 Developing a discovery procedure to identify inconsistencies
13.2.4 Strength of affinity
13.2.5 Percentage set compatibility
13.2.6 Investigating user strategy
13.2.7 Manipulation of prior mental contents
APPENDICES
p. 231
Appendix 4.1. Overview of the experiment
Appendix 4.2. Example of a task sheet
Appendix 4.4. Action-rules for performing sub-tasks set with VCR.
Appendix 7.1. Balancing for experimental task presentation order, and for task by task type.
Appendix 7.2. Overview of the experiment.
Appendix 7.3. Experimental protocol.
Appendix 8.1. Experimental configuration B.
Appendix 8.2. Experimental configuration C.
Appendix 8.3. Formalisation of task action-rules associated with configuration
B.
Appendix 8.4.Formalisation of task action-rules associated with configuration
c.
Appendix 8.5. Overview of the experiment.
Appendix 8.6. Experimental protocol.
Appendix 9.1. Overview of the experiment.
Appendix 9.2. Experimental protocol.
Appendix 10.1. Overview of the experiment.
Appendix 10.2.Introduction to simulated document editor.
Appendix 10.3. Experimental protocol.
Appendix 11.1.Example of changes made to an experimental letter.
Appendix 11.2. Overview of the experiment.
Appendix 11.3. Practice tasks.
Appendix 11.4. Experimental protocol.
Appendix 12.1. Overview of the Experiment.
Appendix 12.2.Examples of a letter in "plain" and "standardised" forms.
Appendix 12.3. How to standardise a letter.
Appendix 12.4. Experimental protocol.
REFERENCES
LIST OF FIGURES
Chapter 1: Introduction No figures
Chapter 2: A multi-component framework for usability
Figure 2.1. Idealised learning curve illustrating the five components of usability.
Chapter 3: How the components of usability can be measured
Figure 3.1. Idealised performance profile of the form used by Jordan and O'Donnell (1992) in their quantification ofgucssability.Iearnability and EUP.
Figure 3.2. Idealised performance curve illustrating time on task vs. trial number.
Chapter 4: Applying the framework to a usability evaluation of a video cassette recorder.
Figure 4.1. The VCR's control panel.
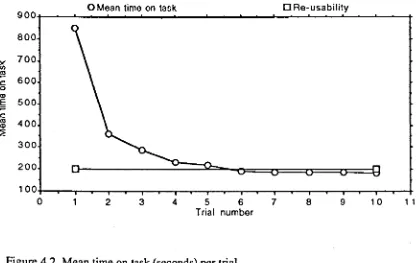
Figure 4.2. Mean time on task (seconds) per trial.
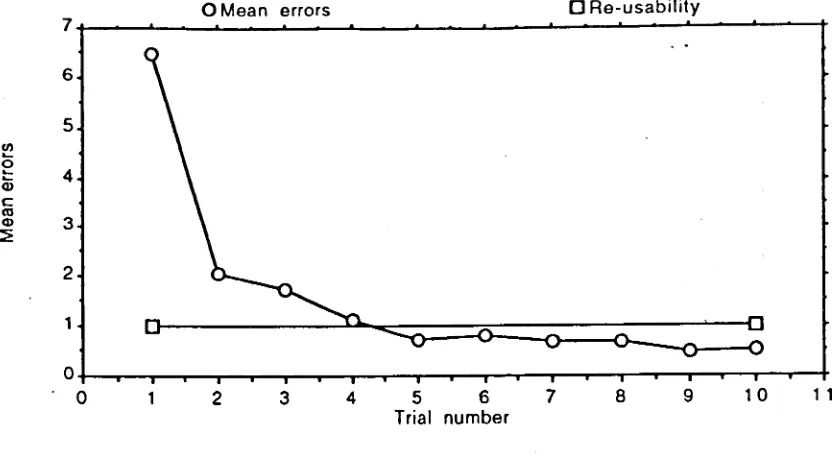
Figure 4.3. Mean number of errors per trial.
Figure 4.4. Mean number of sub-tasks for which manual was consulted per trial.
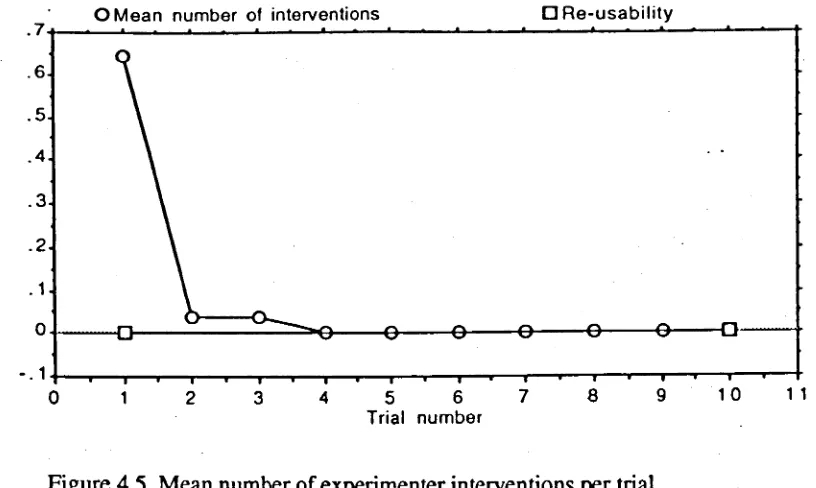
Figure 4.5. Mean number of experimenter interventions per trial.
Chapter 5: What is consistency? No figures.
Chapter 6: How might consistency affect usability
Figure 6.l. Examples of plots from Morin and Grant's study. Figure 6.2. Performance by trial in terms of time.
Figure 6.3. Performance by trial in terms of instruction requests. Chapter 7:Applying the theory to menu commands.
Figure 7.1.An experimental menu configuration.
Figure 7.3. Mean time on task per trial for each task type.
Figure 7.4. Mean number of errors on later trials for each type of task.
Figure 7.5. Mean time on task on later trials for each type of task.
Figure 7.6. Mean number of errors on later trials for each task type (male subjects only).
Figure 7.7. Mean time on task on later trials for each task type (male subjects only).
Chapter 8: Testing the guessability predictions.
Figure B.1.An experimental menu configuration (configuration A).
Figure B.2.An experimental menu configuration (configuration D)..
Figure B.3.Mean time on experimental tasks versus previous experience with similar tasks, for each task type.
Figure B.4.Mean number of errors on experimental tasks versus experience with similar tasks, for each task type.
Chapter 9: Applying the theory to an iconic interface.
Figure 9.1. Possible label for saving icon.
Figure 9.2. Possible label for saving icon.
Figure 9.3. Possible label for printing icon.
Figure 9.4. Possible label for printing icon.
Figure 9.5. Operation icons 1 - 8.
Figure 9.6. An experimental interface.
Figure 9.7. Mean time on task (seconds) per trial for each task type.
Figure 9.B.Mean number of errors per trial for each task type.
Figure 9.9. Mean time on experimental task (seconds) for subjects without and subjects with previous interface experience on filler tasks.
Figure 9.10. Mean number of errors on experimental task for subjects without and subjects with previous interface experience onfiller tasks.
Figure 9.11. Mean time on task (seconds) over the last few trials for each type of task.
Figure 9.12. Mean number of errors over the last few trials for each type of task.
Chapter 10: Applying the theory to a command driven interface.
Figure 10.1. Mean time on task (seconds) per trial for each task type.
Figure 10.2. Mean number of errors per trial for each task type.
Figure 10.4. Mean time on task (seconds) on later trials for each task type.
Figure 10.5. Mean number of errors on later trials for each task type.
Chapter 11: Investigating the effects of consistency at a higher level of an interface, with higher level tasks.
Figure 11.1. Number of subjects using the correct interaction method for
each task type.
Figure 11.2. Mean time on task (seconds) for each task type.
Figure 11.3. Mean number of errors for each task type.
Figure 11.4. Mean number of subjects consulting help for each task type.
Chapter 12: Does consistency matter in "real" interfaces?
No figures.
Chapter 13: Conclusions.
LIST OF TABLES
Chapter 1: Introduction
Chapter 2: A multi-component framework for usability
Chapter 3: How the components of usability can be measured
Chapter 4: Applying the framework to a usability evaluation of a video cassette recorder.
Table 4.1. Sub-tasks set to subjects.
Table 4.2. Mean guessability values.
Table 4.3. Criteria set to represent learning the experimental task.
Table 4.4. Mean trials tofulfilment of learning criteria.
Table 4.5. Mean EUP values.
Table 4.6. System potential values.
Table 4.7. Mean re-usability values.
Chapter 5: What is consistency?
Table 5.1. Reisner's action language description of ROBART 1 and 2.
Table 5.2. Reisner's "necessary" rules (rule schemata) for ROBART 1and 2.
Table 5.3. Set Grammar notation for ROBART 1 and 2.
Table 5.4. Alternative Set Grammar notation for ROBART 1.
Table 5.5. TAG description of ROBART 1 and 2.
Table 5.6. Possible APT descriptions of ROBART 1.
Table 5.7. Possible APT notations for imaginary text editor.
Table 5.8. Extended APT-style description of ROBART 1 for notional British and American users.
Chapter 6: How might consistency affect usability
Table 6.1. Components of usability.
Table 6.2. Possible lightIswitch correspondence (r=1).
Table 6.3. Possible light Iswitch correspondence (r=0.3)
Table 6.4. Possible light Iswitch correspondence (r
=
-1)Table 6.6. Set and rule compatibility of tasks performed using the experimental languages.
Table 6.7. Samples of Payne and Green's (1984) experimental languages.
Table 6.8. Set and rule compatibility of tasks performed using the
experirnentallanguages.
Chapter 7:Applying the theory to menu commands.
Table 7.1. Set and rule compatibility of experimental tasks.
Table 7.2. Experimental hypotheses.
Table 7.3. Commands used in experiment. and their associated menu headings.
Table 7.4. Formalisation of task action-rules associated with interface illustrated in figure 7.1.
Table 7.5. Tasks by type for the configuration illustrated in figure 7.l.
Table 7.6. Experimental subjects.
Table 7.7. Mean guessability values.
Table 7.8. Comparison of guessability values between task types.
Table 7.9. Mean learnability values.
Table 7.10.Comparison of learnability values between task types.
Table 7.11. Mean EUP values.
Table 7.12. Comparison of EUP values between task types.
Table 7.13. Mean re-usability values.
Table 7.14. Comparison ofre-usability values between task types.
Table 7.15. Mean EUP values - male subjects only.
Table 7.16. Comparison of EUP values between tasks - male subjects only.
Chapter 8: Testing the guessability predictions.
Table 8.1. Set and rule compatibility of experimental tasks.
Table 8.2. Experimental hypotheses for study 2.
Table 8.3. Formalisation of task-action rules associated with configuration
A.
Table 8.4. Formalisation of task-action rules associated with configuration
D.
Table 8.5. Mean time on experimental tasks.
Table 8.6. Mean number of errors made on experimental tasks.
Table 8.7. Comparison of guessability (time on task) between task types.
Table 8.9. Number of users successfully completing tasks at the second attempt.
Chapter 9: Applying the theory to an iconic interface.
Table 9.1.Set and rule compatibility of experimental tasks.
Table 9.2. Experimental hypotheses.
Table 9.3.Icons chosen for experimental interface.
Table 9.4.Accidentally included filler icons.
Table 9.5. Formalisation of task-action rules associated with an experimental interface.
Table 9.6. Experimental tasks by task type.
Table 9.7. Mean guessability values by task type, for subjects with no previous experience of the interface.
Table 9.8. Mean guess ability values by task type, for subjects who had previous experience with the interface.
Table 9.9. Comparison of guessability values between task types for users without previous experience of the interface.
Table 9.10. Comparison of guessability values between task types for users without previous experience of similar tasks.
Table 9.11. Mean learnability values.
Table 9.12. Comparison ofleamability values between tasks types using
WSR tests.
Table 9.13. Mean EUP values.
Chapter 10: Applying the theory to a command driven interface.
Table 10.1. Set and rule compatibility of experimental tasks.
Table 10.2. Experimental hypotheses.
Table 10.3. Formalisation of task action-rules associated with an experimental configuration.
Table 10.4. Experimental tasks by task type.
Table 10.5. Mean guessability values.
Table 10.6. Comparison of guessability between task types.
Table 10.7. Mean learnability values.
Table 10.8.Comparison of learnability values between task types.
Table 10.9. Mean EUP values.
Table 10.10. Comparison of EUP values between task types.
Table 10.11. Mean re-usability values.
Chapter 11: Investigating the effects of consistency at a higher level of an interface, with higher level tasks.
Table 11.1. Set and rule com patibility of experimental tasks.
Table J1.2. Experimental hypotheses.
Table 11.3. Formalisation of task action-rules associated with an experimental interface.
Table 11.4. Tasks set in each trial.
Table 11.5. Experimental tasks by task type.
Table 11.6. Mean guessability values for those without previous experience of the interface.
Table 11.7. Comparison of guessability values for those without previous experience of the interface.
Table 11.B.Mean guessability values for those with previous experience similar tasks with the interface.
Table 11.9. Comparison of guessability values for those with previous experience of similar tasks with the interface.
Chapter 12: Does consistency matter in "real" interfaces?
Table 12.1. Sub-tasks performed in converting letter.
Acknowledgements
This thesis reports research conducted from 1990 to 1993. whilst I was employed as a Research Assistant at the University of Glasgow on SERC IDTI grant GRlF/3917l1IED4I1I1109 - Measurement of User Interface Performance.
Thanks are due to my supervisor Steve Draper for comments on my work. for ideas raised during discussions. and for reading successive drafts of my thesis. I am also indebted to my colleagues inthe Department of Psychology for advice and assistance given. inparticular Eddie Edgerton and Judy Ramsey.
Much of the literature reviewed in this thesis was the work of Stephen Payne (University of Wales). and Thomas Green (MRC Applied Psychology Unit. Cambridge). On occasions when I have rung to request information regarding publications, or to ask for comments on my ideas, I have found them to be both courteous and helpful. Similarly, Andrew Howes (MRC Applied Psychology Unit, Cambridge), has also taken the time to comment on my work.
Coming, as I do, from an engineering background I initially had little idea about how to conduct behavioural research, until I completed an MSc inErgonomics at the University of Birmingham. In particular I am indebted to Graham Johnson (then at Philips, Eindhoven, Holland, with whom I did my main research project), who introduced me to how empirical studies should be designed. run. and
reported.
Chapter 1
INTRODUCTION
The topic of human-machine interaction (HMI) is increasingly coming to the attention of academia, industry, and the population in general. This is reflected in the growing numbers of academic journals, books, conferences, magazine articles and even television programs dedicated to HMI issues. This heightened awareness is not surprising - most of the Western world probably come across "high-tech" information technology based products everyday, either at work or in the home. These range from video recorders and microwave ovens, to sophisticated military equipment and the control banks in nuclear power stations.
The study of HMI encompasses a range of issues, from the social changes brought about by automation, to the effects of working with visual display units. The work reported in this thesis, however, is concerned with usability - how easily and effectively a particular user can perform at the human-machine interface - and with consistency. Loosely, consistency concerns whether or not similar types of task can be performed in similar ways at an interface, and this thesis is concerned with the effects of this on usability; their existence, nature, size, and practical importance. An empirical approach was taken, with an experimental methodology being employed throughout, to test the conceptual and theoretical ideas presented. The work reported is intended as a contribution to the HMI literature. Contributing to other related disciplines isnot an explicit aim, although the methods used were originally developed in psychology.
This thesis offers two conceptual developments: distinguishing five components of usability associated with different parts of a user's learning curve, and distinguishing two types of consistency. The central portion of the thesis establishes the importance of the latter by demonstrating, experimentally, their independent effects on the former. The effects are large, but the experimental conditions are artificial. However, the last study reported offers evidence that the same consistency effects can also account for a substantial proportion of users' problems with a popular commercial product
re-usability. These five components embody an intuitively appealing distinction, describing how users' performance on a task might change with experience. Definitions of each of the components are offered. and their relationship to different sections of a notional learning curve illustrated.
An experimental methodology for measuring usability, and an analysis method for quantifying each component are then proposed. These involve monitoring
performance on tasks over a series of trials. rather than on the one-off basis common to many traditional studies. Indeed. the validity of such studies is
questioned on the grounds that it may not be clear as to which aspect of usability is being measured. Non-experimental evaluation techniques are reviewed. with suggestions as to how they could beused to measure the various usability components. A laboratory based experimental evaluation of a video cassette recorder is then reported. This illustrates how the proposed methodology and evaluation can be applied. and how the multi-component framework proved useful in classifying design problems with respect to their effects on different aspects of usability.
The next section of the thesis is concerned with consistency. A review of previous work shows how understanding of this concept has developed with successive treatments. This includes the work of Payne and Green. leading to the
development of their widely used Task Action Grammar. Here. the concept is taken a stage further. with two separate types of consistency - set compatibility and rule compatibility - being identified and defined. Both components are concerned with matches (or mismatches) between aspects of the user's and the designer's mental contents - where the designer's mental contents are embodied in the interface. Set compatibility relates to whether or not a user and designer have the same ideas about which tasks can be thought of as being. in some way. similar. Rule compatibility. meanwhile. is concerned with whether a user's a priori expectations about the specific action-rules required for performing a task match those of the designer.
The ideas about usability and consistency are then brought together. Predictions are made about the effect of each type of consistency on the various components of usability. These assert that set and rule compatibility will each have different effects - rule compatibility being important during earlier interactions
Assumptions underlying these predictions are then discussed. The approach to testing these predictions was empirical observation, rather than by looking at their
fit or conflict with any particular theories of, say, learning or infonnati?~
processing. A series of five tightly controlled laboratory studies is reported. Three of these employ the methodology and analysis method outlined in the first section,
whilst the other two investigate two separate types of guessability, and hence do not require performance profiles for individual tasks.
The studies looked at the effects of consistency in the contexts of different types of
interface (menu based, iconic, and command driven). The effect of inconsistencies
at different interface levels was also investigated. Inthe first four studies .
consistency issues were connected with the names (or representations) of
commands, whilst in the fifth they were concerned with the medium through which users interacted (menus or keypad). Overall, results showed strong support for the predictions, generalised across different interface types and levels. A fmal
study is then reported addressing the question of whether or not consistency
matters in "real" interfaces - a pertinent question as the studies reported here, and
those reported from the literature, were all based on users performing somewhat
artificial tasks on specially created experimental interfaces. Set and rule
incompatibilities in a commercially available word processing package were
identified, and data from a more ecologically valid experimental study re-analysed to see if they had a major effect. Results suggested that almost half of the
problems found could beattributed to inconsistencies, and thus that the issue
might be of considerable importance in practice when designing for usability.
Bringing the ideas about usability and consistency together gave insights into both
issues which might not otherwise have been possible. By applying the
multi-component usability framework, it was possible to gain an understanding of the different effects of the two types of consistency, and to test the assumptions underlying the predictions made about their effects. Suppose that a one-point
evaluation technique had been used. Depending on the level of experience of the
experimental subjects, results would probably have suggested that only one of
these types of consistency mattered. Even if effects were found for both, this
would still not give insights into how the influence of each was experience
dependent Similarly, the different effects of set and rule compatibility on each
usability component illustrated how these components could be
Chapter 2
A MULTI-COMPONENT
FRAMEWORK
FOR
USABILITY
Animportant goal of HeI evaluation is to establish a framework for taking
measurements which will effectively characterise the usability of an interface. This would aid comparisons of an interface against other interfaces or "benchmarks". and could support design improvements. The work of contemporary standards committees, such as the International Standards Organisation (ISO) (Brooke, Beven, Brigham, Harker, and Youmans 1990). and a number of earlier papers (e.g. Eason 1984. Shackel1986) are steps towards this. Informally, usability refers to the costs to users of carrying out useful tasks with an interface (the benefits are sometimes referred to as the "utility").
The ISO (Brooke et all990) define the usability of an interface as "...the
effectiveness, efficiency. and satisfaction with which specified users can achieve specified goals in a particular environment". This definition recognises that an interface's usability may vary between tasks (achieving a goal requires the
completion of tasks in this context) and users. However. what is not explicit in the definition is that usability can vary within tasks and users. For example. the efficiency with which a task can be completed may vary according to the conditions under which it must be performed - what is easy under laboratory conditions may be more difficult in a "real life" setting. The user's frame of mind or degree of alertness may also affect performance. Perhaps someone who is tired will find a task more difficult then one who feels wide awake. These are factors which may vary from day to day. or hour to hour; and can be difficult to monitor. However. there is another important factor which varies over time within users which could be more easily monitored - experience. In this chapter a framework is presented which is designed to account for changes in an interface's usability with user experience.
is to come back toa task after a long gap between repetitions, and the other to relate measures of actual performance to a maximum performance achievable by an ideal user who has learned optimal methods. This extended five component
usability framework can describe the phenomenon of "shells of competency" (Norman, Draper, and Bannon 1986), accounting for how users' performance can change over long time scales - the "asymptote" shifting up or down, for
example, if new techniques are discovered, or a period of disuse leads to forgetting.
The five components are outlined in detail in the next section. Although derived from a very general concept of a learning curve, they are oriented towards empirical measurement and are not concerned with any particular psychological theory of learning. This emphasis on practical measurement is taken further in the next chapter, where methodologies for measuring the components of usability are discussed.
2.1 THE FIVE COMPONENT FRAMEWORK
The five components of the usability framework are described below. For each component the basic concept is introduced, examples are given of where itmay be of particular importance, and a formalised definition, based on the ISO definition of usability is given. Whilst it is accepted that for any given interface the
components may not always be independent, they are at least conceptually distinct.
2.1.1 Guessability
This is a measure of the cost involved in using an interface to perform a new task for the first time - the lower the cost the higher the guessability. where cost may
be measured in terms of, say, time, errors, or effort. Guessability is likely tobe important with interfaces that have a high proportion of one-off users. for example, fire extinguishers, door handles on public buildings. or public
information systems. Also, a lack of guessability could put users off an interface . which in the long run might be comparatively easy to use. For example, a
Guessability isof less importance in situations where procedures are initially demonstrated to the user, or for interfaces which will only be used by experts after long training. This might include, say, military equipment, and aircraf~ ~ontrols. However, note that emergency diagnosis and recovery procedures should still be guessable for pilots - even though they maybeexperienced generally, there may still berare tasks which they have never seen before. Another important case is whether a user with wide experience of a particular interface can find a new function when needed. Menus, for example, are one way of addressing this type of guessability.
Guessability: The effectiveness, efficiency and satisfaction with which specified users can complete specified tasks with a particular interface for the first time.
2.1.2 Learnability
This refers to the cost to the user in reaching some competent level of performance on a task, but excluding the special difficulties of completing the task for the first time. The issue of making judgements about what can be described as "competent" in a particular context isdiscussed in the next chapter. A highly learnable interface would beone where a task was instantly memorable once the method had been shown to the user. Conversely, interfaces which cause "interference" with user expectations are likely tobe un-learnable. For example, an interface which relied on perverse command names might score a high penalty here. Interfaces which rely on recognition might be expected tobe more learnable than those which rely on recall. The user of a recognition based interface (for example a graphical, or menu driven interface) can operate effectively without having toretain detailed information about the interface (Mayes, Draper, McGregor, and Oatley 1988). Learnability may be particularly important where a user is to be self-taught with an interface, or where training time is short For example, temporary secretaries may beintroduced tonew word processing packages on a fairly regular basis. Clearly, signifIcant amounts of working time will bewasted if they do not reach a
The term "leamability" has already appeared widely in the usability literature.
However, its meaning has not always been clearly expressed, and different practitioners appear to mean different things by it. For example, Payne. ~nd Green
(e.g. 1986) use the term with reference to completing new tasks for the first time (here referred to as guessability), whilst others (e.g. Shackel1986 and 1991) use
the term more loosely, to refer to performance by any user who could not be deemed experienced. Indeed, the idea that there is a distinction between usability
for an experienced user, and usability for one with less experience is not
uncommon. However, the distinction is usually couched in rather vague terms,
with little attention to the guessability Ileamability distinction or the criteria by
which a user is judged to be experienced or expert. For example, many studies in
the literature, described as studying new users, either discard the time to complete tasks for the first time, or give subjects special help at this stage, thus omitting
guessability. (Perhaps this is because this appears to have been standard practice . in many areas of learning psychology).
Learnability: The effectiveness, efficiency and satisfaction with which
specified users can achieve a competent level of performance on
specified tasks with an interface, having already completed those tasks once previously.
2.1.3 Experienced user performance (EUP)
This refers to the relatively unchanging performance level of experienced users.
Intuitively, it may appear that practiced users' performance will level off to an
asymptotic level, although for behaviours following the power law of practice
(Card, Moran and Newell 1983) this is not an exact defmition. However, although experienced performance may vary over long timescales, itmay be expected to
remain comparatively steady when compared to performance during the
learnability phase. This component is often what is meant by practitioners when
they use the term "usability" (e.g. Bennett 1984, Eason 1984, ShackeI1986).
EUP will becomparatively important in situations where constraints on training
time and resources are few, but where it is important that the experienced user makes few errors. Again, flying an aircraft would come into this category, as
EUP: The effectiveness. efficiency and satisfaction with which specified experienced users can achieve specified tasks with a particular interface.
2.1.4 System potential
This represents an idealised maximum user performance. and, as such. is an upper bound on EUP. Unlike the other components, which represent properties of the interaction between the user and the interface, system potential is a property of the interface alone, and does not vary either over time or between users. Inthe context of a computer based interface, system potential may be represented, say, by the number of keystrokes or mouse movements required to complete a particular task.
Clearly there will be instances where there is a gap between system potential and EUP, perhaps due to a user learning a non-optimal method of task performance, or simply not having the ability or opportunity to push task performance to its limit. For example, many mouse and menu interfaces have alternative accelerator key options for performing many tasks, however, it is often the case that
experienced users will not bother to learn these, but stick with non-optimal method of command selection from menus. An example of where a user is usually
prevented from exploiting full system potential is with automobiles. Although market research suggests that a major selling point for vehicles istheir
performance, in terms of, for example, top speed, the roads would beextremely hazardous if drivers were to exploit this on a regular basis.
Over longer time scales EUP may move nearer tosystem potential. perhaps creeping up due to a gradual improvement in some ability secondary to the main task. For example, a user might beabletoenter commands more quickly due to gradually improving typing speed. However, sometimes step jumps in
performance might occur, perhaps due to the user discovering some new command or technique. Norman. Draper and Bannon (1986) refer to this
learn it - some users may be content to remain at what they regard as a reasonable level of performance.
System potential will be important in cases where it is the limiting factor on EUP. For example, with a command driven interface the time taken to type long
command strings may be irritating to a user, even if they no longer have any
problems remembering the contents of the strings. It will be of less importance
when EUP is limited by other factors. For example. the reason it may take several
hours for a student to word process an essay is likely to be because of limits on
thinking and typing speed, rather than anything to do with the time that the
package takes to respond to keystrokes.
System potential: The optimum level of effectiveness, efficiency and satisfaction with which it would be possible to complete specified
tasks with an interface.
2.1.5 Re-usability
This component, similar to what Shackel (1986) refers to as re-learnability,
concerns the possible fall-off in user performance after a long gap, perhaps due to
forgetting how the task was done, or, say, forgetting where to find a particular
menu stored command. Re-usability is possibly concerned with more complex
issues than the other components. Firstly, the idea of a "long gap" is somewhat
vague. An implicit assumption associated with learnability and EUP is that users are repeating a task on a fairly frequent and regular basis. The "gap" associated with re-usability can perhaps most usefully be thought of as a length of time significantly greater than the usual gap between task repetitions.
Clearly, re-usability may be dependent on the length of this gap, although there
may be some tasks with which even a short time away brings the user back to the
start of the learning curve, whilst with others users may remain fairly near EUP
even after a long gap. For example, it is possible that many students would now
have no idea about how to perform a long division, even ifthey were proficient at this when in school. Conversely, it is widely held that one who has learned to ride
For example. a task may initially prove very difficult to come back to. however after the user's memory has been jogged. performance may rapidly return to EUP.
Re-usability is likely to beimportant in situations where users may only use an
interface in intermittent "bursts". For example. a researcher may use a statistics
package fairly regularly for a week or so after completing a study. but may then have a gap of a couple of months before using it again after a further study has been completed.
Re-usability: The effectiveness. efficiency. and satisfaction with which
specified users can achieve specified tasks with a particular interface.
after a comparatively long time away from these tasks.
Each of the components of usability is loosely associated with a different section
of a notional learning curve. An example of such a curve is illustrated in figure
2.1 ..
Time
per
wit Fus,wk
Lwnobility
Oulf
Re·usability Gull
Experience ofwk
Figure 2.1. Idealised learning curve illustrating the five components of usability.
2.1.6 Implications for usability evaluation, and design
Perhaps the most obvious corollary of the five component framework. is that
evaluations should be designed with clear ideas of the component of usability
which is of interest For example. if interested in guessability subjects should not
be given the opportunity to practice the experimental tasks beforehand. whereas if EUP were of interest subjects should be well practised in the experimental tasks.
This may cast doubt on some of the "traditional" approaches to usability
measures of performance taken after apparently arbitrary practice opportunities. If, for example, users were given, say, a twenty minute practice session, during which they were free to explore an interface, including, possibly, the experimental tasks, it might be difficult to know what their level of experience on a particular task was when the experimental session commenced. Without knowing this it would not be clear which component of usability was being measured. This practice is commonly reported in the consistency literature (discussed further in chapter 6).
Other types of study have had more closely controlled practice opportunities, but then still made claims for usability as a whole on the basis of one-point measures. An example, from this author's own work, was an investigation of a remote control for operating an in-car stereo (Jordan and Johnson 1991). Subjects had not used the remote prior to any experimental measures being taken. These measures, then, would be representative of guessability. However, because no distinctions were made between different usability components, performance was simply taken as representing the device's "usability", without qualification for the effects of experience. Ideas about methodologies for usability evaluation are discussed in the next chapter.
From the designer's point of view the framework should aid clarity in defining usability goals. Indeed slogans such as "design for usability" have little practical meaning unless the question of who an interface is to beusable for is addressed, and an important part of this is the expected level of user experience. For example, ifdesigning a piece of specialist software, to beused by highly trained users on a regular basis, it may notbeworth the effort and expense of designing a highly guessable, learnable, or re-usable interface provided that high EUP is supported. Inpractical terms this might mean, say, designing a command key based interface, rather than one with menus. Conversely, an interface to, say, a walk-up-and-use health information system should support high guessability, but need not support high learnability or EUP.
names, menu headings, icons etc. on the screen to aid the first time user, or
having them hidden at another "level" of the interface to avoid clutter. Even if the designer cannot cater for all potential levels of experience, at least the f~~ework creates a frame of reference for any trade-offs which might have to be made.
2.1.7 Classifying users
A fairly common theme amongst many HCI practitioners, is to make a distinction
between "expert" and "novice" users (e.g. Fisher 1991, Streitz, Spijkers, and Van
Duran 1987). The multi-component usability framework appears to support the possibility of classifying users with respect to experience. When first reporting the
idea of the guessability Ilearnability IEUP distinction (Jordan, Draper, MacFarlane and McNulty 1991), a three way user distinction was proposed:
Naive users: Users who have not yet completed a particular task with
an interface.
Novice users: Users who have completed a particular task with an
interface one or more times, but not enough times to reach a steady
"asymptotic" level of performance.
Experienced users: Users who have completed a particular task with
an interface enough times to reach a steady "asymptotic" level of performance.
When considering system potential and re-usability, additional user classifications could be:
Expert users: Users performing at the limit of a system's potential on a particular task. (This would be a sub-category of experienced users).
Returning users: Users returning to a task with an interface after a long
period away.
Note that these user classifications, like the usability components, are all defined in relation to a particular task. When studying users operating with the UNIX
status on limited numbers of tasks, whilst possibly being "naive" or "novice" in relation to others. Thus trying to give general labels to a user may prove
inappropriate and unhelpful. What is more important is to have an idea of users' working patterns. For example, if the users in Draper's study rarely used
commands other than those with which they had obtained expertise, then system potential, as the limiting factor on EUP might be the only component of great importance. Conversely, if they were occasionally likely to use other commands on a one off basis guessability would also be important
2.2 PROSPECTS FOR GENERALISATION
A possible criticism of usability definitions, including the framework outlined here, is their narrowness - the reference to " •••specified users performing specified tasks ...".So,how optimistic is it reasonable to be about the possibility of making generalised statements about the usability of any given interface? The answer is likely tobe dependent both upon an interface's user population, and the range of tasks which users are apt to perform with it
2.2.1 Inter-user variability
Baxter and Oatley (1991) identified three types of user experience which may affect performance when using an interface:
Task domain experience: Gained from experience of performing a task, irrespective of the interface with which itisperformed. So, for example, experience of writing the word "computer" will be helpful whether the word is being written by hand, typed, or word processed.
Application program experience: Gained from experience of using a particular application program, perhaps in a different operating
environment For example, a particular graphics package may employ similar icons regardless of the operating environment in which it is run.
Differences between users with respect to each of these experience types can cause marked differences in performance. For example, in a comparison of two different Macintosh based spreadsheet packages, Baxter and Oatley (1991) found that the level of task domain experience which firsttime users brought with them far outweighed any differences between the packages as a factor affecting
performance. Thus, in this case, the usability of the machine was very much user dependent Presumably the other types of experience could have equally dramatic effects on the usability of interfaces for some tasks.
However there will be cases where the user population is fairly homogeneous as regards the three experience types. For example, few of the potential users of a fire extinguisher are likely to have operating system or application program
experience (in this case the two are essentially the same as the fire extinguisher has only one function), although some might have task domain experience (this means that they may have put out a fire, for example a bonfire, an open hearth fire, or a chip pan fire). Thus, whilst users know that to complete their task they must direct the contents of the extinguisher onto the flames, they may not know how to release the contents from the extinguisher. Therefore, there appears no obvious reason to expect a great deal of inter-user variability. Even in an apparently clear cut situation such as this however, there could be "hidden" factors which have a big effect For example, if a user had some knowledge of valve release systems gained in another context this might behelpful.
2.2.2 Inter-task variability
With more complex systems the range of task types will bewider and thus inter-task variability will probably be greater. For example, a statistics package which is easy to use for performing calculations, may not necessarily beusable, say, for creating graphs to represent the data. Probably the majority of modem application programs do tend to support a wide variety of tasks. Thus, a degree of caution shall be necessary before trying tomake generalisations across an interface.
2.2.3 Experience on a task vs. experience on an interface
Another issue is whether experience can be thought of in terms of experience with an interface as a whole, or whether it is only useful toconsider itin task specific contexts. Ifthe former were true, then it might be possible to obtain performance profiles of, say, total number of interactions with the interface versus time to complete each interaction, and then derive measures for each component of usability for the interface as a whole.
The feasibility of such an approach - treating knowledge of an interface as a whole as a single variable - is likely to be dependent on the prospects for transfer of knowledge from one task to another. Ifthe interface were designed in such a way that performance on any particular task could be influenced, as much by experience of other tasks, as by previous experience on that task itself, then this approach may seem reasonable. However, if this is not the case, it seems doubtful that such an approach would give meaningful results.
Overall then, it is probably not sensible to attempt to quantify the various components of usability for an interface as a whole. Rather it may be more constructive to think in terms of how experience of one part of an interface may affect the usability of another part. Consider, for example, a word processor employing a mixture of menus and command keys. It might be expected that experience of activating menu based commands might help the user perform a new task which also relied on a menu command - thus making this task more
key. Indeed menu experience could diminish guessability in this case as the user might decide to try some menu commands which, here, would beinappropriate.
Studies addressing how experience of some tasks may affect the guessability of
others are reported in the next part of this thesis.
2.3 ARE THE COMPONENTS OF USABILITY INDEPENDENT?
Whilst the components of usability outlined in this chapter might beconceptually
separate, they may not always be independent It may be, for example, that a task
which has a high associated re-usability might also have high learnability. Indeed,
itmight be expected that if a designer has kept to a set of sound usability
guidelines or design techniques (e.g. Thimbleby 1991, Booth 1989) that every
aspect of usability would benefit However, this need not always be the case. It
may be that some aspects of design will affect the components in different ways - the second part of this thesis reports on how consistency can affect the different components differentially.
Similarly, differing user strategies may also affect whether the components are
independent Users who take a trial and error approach to a task may, for
example, find a system fairly guessable on the basis that they will eventually "hit
the right button". However, they may not have improved much by the time they
reach EUP. Conversely, users who try to work from some sort of system model might have difficulty early on, if their models were incorrect to start with, but may perform well at EUP ifthey have, by then, adopted the correct model.
Whilst comments in this section of the chapter may indicate caution about the
prospects for generalisation across tasks and users, it is perhaps unnecessary to be
wholly pessimistic about the prospects for making meaningful statements about an
interface's usability. Good evaluations will employ reasonably representative user
populations, and a range of tasks representative of the types of interaction techniques applicable to an interface. It should bepossible, then, to gather data
from which meaningful comparisons between interfaces can be made, or by which
interfaces could be compared to some sort of benchmark standard. Methodologies
for evaluating interfaces with respect to the various components of usability are
2.4 SUMMARY
A five component model of usability has been outlined, accounting both for changes ina user's performance with experience, and the limitation on
performance imposed by the interface. Building on the ISO defmition of usability, these components refer to usability in the context of a particular user performing a particular task, although, with good evaluation practice, itmay, hopefully, be possible to generalise across tasks and user groups.
Chapter 3
HOW THE COMPONENTS OF USABILITY
CAN BE MEASURED
Having outlined a multi-component framework for usability, and questioned the validity of some one-point usability evaluations, it would be constructive to put forward ideas for more comprehensive usability measurement This chapter discusses possible methodologies and analyses for quantifying the five
components of usability. There are two main sections to the chapter. Inthe first, possible experimental methodologies and analyses are considered, and a criteria based approach outlined which formed the basis for analysis in the studies subsequently reported in this thesis. Inthe second, some non-experimental methods are introduced. This is to demonstrate that the multi-component
framework is not only useful in the context of experimental evaluation, but rather that alternative, perhaps less costly, methods can also beused to gain information about the various components of usability.
3.1 EXPERIMENTAL TECHNIQUES
This section starts with a review of a laboratory based technique and "semi-formal" analysis method for quantifying guessability,leamability, and EUP which was originally presented to the Ergonomics Society conference (Jordan and ODonnell 1992). Other possible experiment based analyses are also discussed, and a practical, less complex, analysis method is proposed.
3.1.1 Jordan and O'Donnell's "semi-formal" analysis
This was an experimental approach, based on the idea that in order to quantify guessability, leamability, and EUP, it was necessary to obtain a series of points to which it was possible to fit a curve with a well defined starting point, and some sort of asymptote (or at least a point where the slope starts to level off), This means implicitly that it willbenecessary for experimental subjects to repeat trials (comprising a task or series of tasks) several times, so that their change in
time on task. or errors, can then be plotted against trial number. Having obtained such a plot. the requirements of the analysis are to define a starting point, from
which to derive guessability, an asymptote. to represent EUP. and a point at
which performance could be said to be reasonably close to this asymptote. from which to derive leamability.
It was decided that the start point of the curve should be taken as the point at
which the first trial was completed. This point was chosen as it was directly
measurable. and did not rely on any assumptions about what the theoretical shape
of the curve may have been prior to completion of the firsttrial (if indeed this is a
meaningful notion).
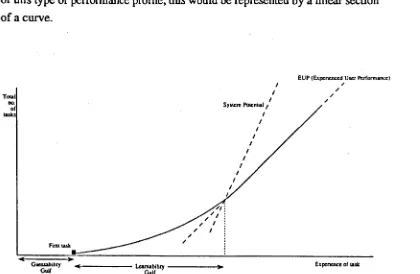
For their analysis lordan and O'Donnell decided to represent performance in terms of cumulative trials against cumulative time on task. This gave plots of a similar
. shape to that illustrated in figure 3.1. The slope of such a curve increases with
improvements in performance. When steady performance is reached the slope becomes linear. In order togain values for EUP and leamability. it was first
necessary to choose a criterion for deciding whether or not a subject's
performance had reached a steady level during the experimental session. Interms
of this type of performance profile, this would be represented by a linear section of a curve.
FirstWI<.
,
,
,
System Pote"'ial,,
,
,
,
,
,
,
,
,
,
,
IEUP (Experienced User Performance) " '" Total 00. o '" '" Guessabilil)'
Gulf _---- LeamabilityGulf ---_
Elpenence of WI<.
Figure 3.1. Idealised performance profile of the form used by lordan and
By fitting a linear regression equation to the last few points collected from each
subject's data, Jordan and O'Donnell checked whether, by the end of the session,
the relationship between points on a performance curve could be adequately described by a straight line. The minimum number of points to which it is useful to fit a straight line is, in this context, three (any two points, considered in
isolation from the rest of the curve, can be said to have a perfect linear
relationship). However, it was decided that four points should be used for the
analysis, to reduce the risk of any freak data points "throwing" the results. The
adequacy of a straight line fit to a set of data points is described by the co-efficient
of determination (R-squared), associated with the linear regression equation
(Daniel 1977). Low values indicate that the closest linear fit is not really an adequate description of the relationship between the points. However, a high
R-squared value indicates that a linear descriptor is adequate, and that the four points can be taken as lying on a line sufficiently straight to represent an area of steady
performance. (Jordan and O'Donnell took an R-squared value of 0.995 to be
"high"). EUP, then could be taken as the mean level of performance over the trials
represented by these points. Note that analysing the last four points for linearity
means that it is the equality of performance on the last three trials which is being
investigated - four points gives three line segments each representing one trial.
The particular form of curve used here (cumulative trials vs. cumulative time on
task) was chosen as steady performance would be represented by a linear segment
of any slope to which it would be possible to fit a linear regression equation. With
other forms of curve (for example, trial number vs. time on task), steady
performance would be represented by a flat portion (see figure 3.2).
Unfortunately, linear regression tests cannot be used to test for flatness, hence
Leam.lbdiIJ Gull
R.· ... biIiIJ Gulf
Experienc. 0(wk
Figure 3.2. Idealised performance curve illustrating time on task vs. trial number.
Inorder to obtain a value for learnability, a criterion was decided upon for
determining a point at which each user's performance curve could reasonably be
said to have started to level off. It had previously been suggested (Jordan et al. 1991) that being within 95% of EUP was a reasonable criterion, and it was this
which was adopted for the analysis. Hence, ifthe linear section of the curve
suggested that a user was completing, say, 100 trials per hour at EUP, then the
first trial at which the rate of task completion was greater than or equal to 95 trials
per hour, could be taken as a reasonable estimate of when a steady level of performance was reached. A value for learnability, then, could be taken from the
appropriate trial number, or the cumulative time taken to reach this trial number minus the time to complete the first trial (this would be covered by the guessability
measure).
TIlls analysis method was applied in the context of the evaluation of a video
cassette recorder (VCR). The study is reported in Jordan and O'Donnell (1992), where it is concluded that the analysis is "...simple enough to be practical, whilst
affording a degree of formality in the assessment of guessability, leamability, and
experienced user performance."
Whilst developing the analysis, Jordan and O'Donnell initially considered three
further options: fitting an equation, judging the data by eye, and testing for
significant differences between performance from one trial to the next. These
3.1.2 Fitting an equation
An initial option was to try to fit a mathematically defined curve to some measured points, in the hope that the level and start point of an asymptote could then be calculated - however, two major problems arose. Firstly. there is no one generally accepted model covering all performance curves (Mazur and Hastie
1978), yet trying to fit a curve to data points without a model is (in the words of Newell and Rosenbloom 1981) "... a notoriously black art." Secondly. the models most frequently suggested in the literature. for example exponential. hyperbolic. or the power law of practice (Card. Moran. and Newell 1983). tend to befitted to far greater numbers of points (often tens (e.g. Card. English and Burr 1978). hundreds (e.g. Kolers 1975). or thousands (e.g. Crossman 1959» than can conveniently beobtained from a usability study. where experimental tasks tend to becomparatively complex. and take many seconds each. Having only a few points may cause problems in this context, as usually it is the earliest of the empirically measured points that are most likely to deviate from any fitted equation (Newell and Rosenbloom 1981).
3.1.3 Judging the data by eye
The major problem with judging for an asymptote and its start point by eye. is that judgements made are likely to be too subjective. and unreliable. The semi-formal
analysis can provide a set of constant criteria for deciding whether or not a curve has become linear. and the point at which linearity has been reached. Without such criteria there are likely to be inconsistencies between how two separate analysts judge the data, and even between the way a single analyst views data on separate occasions. This introduces a potentially large source of error to any values assigned to usability components.
3.1.4 Testing for significant differences between trials
regarded as still improving, however, if there isn't then it is regarded as having levelled off.
The problem with this method is that the likelihood of a difference being statistically significant is liable to be dependent on the subject sample size.
Consider, for example, a mean difference in time on task between two consecutive trials of 20 seconds. If the sample size were, say, sixteen then this difference might prove statistically significant, whereas with a sample of, say, eight, it may not. Again, then, a potential source source of inconsistency would have been introduced into the analysis.
3.1.5 Quantifying system potential and re-usability
The analysis techniques discussed so far make no provision for quantifying system potential or re-usability. By definition system potential means error free performance, but how can itbe quantified in terms of, say, time on task? An experimental measure might be gained from measuring the performance of an over-practiced expert, perhaps the experimenter, who may know an interface "inside-out" by the time he or she has monitored a group of subjects performing the experimental tasks. This approach was taken in the study reported in the following chapter.
Inorder to measure re-usability experimentally, it will be necessary to ask subjects toreturn to the task after a period away. For example, having completed a series of trials during a first experimental session, subjects might return a day later to attempt another trial. Re-usability values could then bederived from performance on this trial.
3.2 CRITERIA BASED ANALYSIS
The idea is based on the approach ofGilb (1981), which advocates setting usability specifications to guide the design and evaluation of an interfac:e: For example, a specification may state that for an interface to be acceptable, 90% of users should be able to complete task X within 30 seconds. In the context of measuring the components of usability, this could be adapted by specifying criteria which define, say, which users can be regarded as experienced, or what level of performance represents having learned a task. For example, it might be decided that if a user had completed a task, say, ten times, they could be classified as experienced on that task. Similarly, performing a task in less than, say, a minute could be taken to represent a competent level of performance, so that users could
besaid to have learned that task. ITthis approach were used, EUP might be taken as mean performance on subjects' tenth trial, and learnability defined by how many trials ittook each subject to complete a task in less than a minute. This was the approach used throughout the studies reported in this thesis.
The way in which criteria are set may be dependent on the context of the study. Most of the studies reported in the next part of this thesis are experiments on specially created interfaces, for the purpose of investigating how different properties of a design affect usability. What was of interest, then. were
comparisons between performance on different types of task. Here criteria were set post-hoc in order to facilitate meaningful comparisons. So, if by the end of an experimental session users tended to be completing tasks of all types in less than, say, five seconds. it would have been helpful to regard this as a competent level of performance. Thismeant that learn ability could be quantified according to how long it took toreach this level on each type of task, and meaningful comparisons made. Similarly. if performance on alltasks appeared to have levelled off after, say. ten trials, performance from here on could be used taken as representative of EUP.
beset in accordance with the needs of, say, a job, or a training program. For example, a manufacturing company's profitability might depend on a
computerised-numerically-controlled (CNC) milling machine operator being able to turn out. say, ten components per hour, or a company might be able to give its secretaries a couple of days to learn a new word processing package, during which time they might expect them to use some of the basic commands about ten times each.
Another potential problem with Jordan and O'Donnell's approach, is that their analysis may make values gained for learnability dependent on EUP. Consider two curves, illustrating performance on similar tasks, but with different types of interface. each curve being a plot of performance over twelve trials. Imagine that they had identical profiles up until, say, the sixth trial, where one started to become linear, the other not reaching linearity until, say, the eighth trial.
With Jordan and O'Donnell's analysis, the second of these would have a higher (faster, less costly) EUP than the first. which is sensible. However, because the second's profile takes longer to stabilise, the analysis would assign a worse learnability value to this interface. So a comparison between the two interfaces would suggest that. although the second had a higher EUP, the first was more learnable - implying some kind of trade off between the two. Of course, this isn't really the case, as learning proceeded at the same rate, but rather the second interface has been "penalised" in terms of learnability, simply through supporting a higher level of EUP. With a criterion based approach this anomaly would not occur, as both profiles would reach the criterion level together (provided this was lower than the first curve's asymptote), giving equallearnability ratings.
Because criteria based analyses require explicit statements to be made about the level of performance which is accepted as representing competence, learnability values are meaningful in their own right This is not really the case in Jordan and ODonnell's analysis where they must beinterpreted in the light of the associated level of EUP.