Science Journal of Applied Mathematics and Statistics
2015; 3(1): 1-5Published online January 19, 2015 (http://www.sciencepublishinggroup.com/j/sjams) doi: 10.11648/j.sjams.20150301.11
ISSN: 2376-9491 (Print); ISSN: 2376-9513 (Online)
Linear regression, fundamental issue in training and
application of engineering
Luz Elva Marín Vaca
2, Martha Lilia Domínguez Patiño
1,
Nadia Lara Ruiz
2,
Miguel Aguilar Cortes
21
Faculty of Chemical Sciences and Engineering, Autonomous University of the State of Morelos, Chamilpa 62209, Morelos, México 2
Student of Doctorate of Engineering and Applied Science, Autonomous University of the State of Morelos, Chamilpa 62209, Morelos, México
Email address:
[email protected] (L. E. M. Vaca), [email protected] (M. L. D. Patiño), [email protected] (N. L. Ruiz), [email protected] (M. A. Cortes)
To cite this article:
Luz Elva Marín Vaca, Martha Lilia Domínguez Patiño, Nadia Lara Ruiz, Miguel Aguilar Cortes. Linear Regression, Fundamental Issue in Training and Application of Engineering. Science Journal of Applied Mathematics and Statistics. Vol. 3, No. 1, 2015, pp. 1-5.
doi: 10.11648/j.sjams.20150301.11
Abstract:
In this paper the impact on student learning in teaching linear regression and correlation analyzes, making use of new information technologies (ICT) to support Project Descartes through tasks; that allow students to research results type of scatterplot equation of the line, analysis determining prognostic variables. To conduct this research took into account two groups 28 and one of 26 students, one of them use technology and other not; the two groups were taught a class mayéutica, performing exercises topic. Both groups developed the same tasks, the group with computer; for the analysis of results, we started from a classified to determine the answers, because the practice is based on tasks with graphical and application of equations. Thus evaluation codes that were used were as follows: 1. If you have any idea = Excellent, 2. has no idea = Good 3. He did not understand anything = Poor; reaching an average rate of 70.39%, of if you have no idea, 25.76% of those who have no idea 3.43%.Keywords:
Component, Formatting, Style, Styling, Insert1. Introduction
If someone could predict the future, it will have accumulated vast wealth with this unique power. Our lives depend on a large number of events whose result cannot anticipate exactly. That is one of the reasons for the importance of statistics in our days, because with the help of their tools we approximate values very close to reality.
The aim of this study is to investigate whether the student through the Linear Regression and Correlation fails to understand the importance and application of Statistics.
In general terms, is a useful statistic to predict outcomes based on the information contained in a sample obtained from a population tool.
It is therefore very important for an engineer studying various methods and sampling procedures, looking for a specific amount of information in a given situation at minimal cost; for decision making. Statistics is based largely on applied mathematics. The vast majority of its fundamental rules are developed and based on prior knowledge must have
application in real situations.
In general, Linear Regression is a part of applied statistics, including within the curriculum at the professional level, because the future graduates will constantly encounter in their professional life in decision-making related to two or more variable.
Furthermore, after reviewing the work of recent years related to the problems of teaching and learning of statistics, no reference relating found addressing the issue of Linear Regression, and of course, where the use of technology involved. The review of the state of the art promptly addressed later in this report, making a brief reference to what is each.
methodology used, materials and teaching aids employees and the adequacy of the contents of the technological society of information, communication and knowledge.
2. Methodology
The phases of the experiment consists of three stages: the first classes are taught in the classroom the student explaining the purpose of the correlation and regression in the form mayéutica (the teacher explains, exercise and students take notes and doubts are clarified as you go class) which is done over the course of 16 hours.
The research instrument is one of the applications of Descartes Project section of Probability and Statistics for the topic Correlation and Linear Regression. To do this, the program and the research paper on computers in the computer center at the Faculty of Chemical Sciences and Engineering UAEM, where he worked with students in group C was installed, while for those in group B only handed form.
This document is organized and designed so that the student progresses in the same way how the class was in the classroom, to facilitate their performance to define the points of the slope, determine the equation of the line, showing clouds of points a scatterplot.
The second stage is the activity that deals calculate the equation of the line through formulas and the correlation values that allow us to predict whether future or intermediate and get reliable results with minimum degree of error.
The third and final step is to predict values of the Industrial Price Index (IPRI), prepared by the National Statistics Institute (INE). This problem was applied to the two aforementioned groups, with group B students performing it manually and group C on the computer.
3. Themes Mayéutica Class
The thematic content of Probability and Statistics II in the V where the topic Linear Regression is included with the following subtopics:
• Least Squares (Linear Regression) • Regression Curvy
• Correlation.
To introduce these methods the various forms that exist to differentiate scatterplots and how to apply are handled. An example of each of the sub and the determination of results using scientific calculator is done. It is intended that the student sees its application in the context of their possible areas of professional development, and give the importance of the subject matter and deserve.
When the scatter plot takes the student determines which correspond sub and applies the following equations for the determination of the line correlation and prognosis:
Equation 1:
= +
Equation 2:= ∙
Equation 3: = + +
Equation 4: = ∙
The equations are related by topic only 2 and 3 correspond to the subject of curvilinear regression.
Otherwise, to accept if there is an acceptable linear correlation, there is no strict rule. Normally, for accepting the existence of the correlation coefficient should be greater than 0.7 or less than -0.7. Otherwise, it is generally reject the existence of linear correlation.
Regarding the content of the corresponding notes are designed according to the content of textbooks, particularly those mentioned as basic texts and consultation of Probability and Statistics for Engineers Johnson-Miller Freund Ed . Printice Hall (1997 pág.330 370), and Probability and Statistics Walpole Meyrs Ed. Mc Graw Hill (1993, p. 373-408), considering further didactic literature of the first author.
3.1. Descartes Project
It is a portal of the "Education Network Digital Descartes" non-governmental organization that aims to promote the renewal and methodological change in the processes of learning and teaching mathematics through Force website, and in other areas of knowledge, using interactive digital resources generated in the Descartes Project. In particular, to achieve this end, the development and dissemination of authoring tool called "Descartes" is promoted.
For regression and correlation tasks are project Descartes proposes a target implementation and are:
Task A). The student determines the coordinates of each of the points that are in the scatterplot. It aims to see if they can identify the correlation between the two variables mentioned in the problem statement, one refers to Industrial Price Index (IPRI) and the other corresponds to the IBEX-35 call (Benchmark more important in the Spanish Stock Exchange).
Task B). The objective of this activity is to detect if the student fails to identify the points that deviate from the trend.
Task C). By observing the scatter diagram is intended that students able to identify which model curve fitting should be applied, so that the most points pass near it, preferably by drawing a line.
Task D). If you are asked to draw a line using the least squares method, it is expected that the student achieves adjust the equation of the line, using their knowledge to determine the values and compare their results.
Task E). The purpose of this activity is aimed at students to apply their knowledge of correlation using either text indications research tool or formulas of their class notes to determine if the two variables involved coincide. It is expected that the student must inform why take that decision and further define what most compatible model with cloud of points is shown.
Task F). The aim is to determine whether the student understands the application of the equation of the line by the least squares method to predict values.
Science Journal of Applied Mathematics and Statistics 2015; 3(1): 1-5 3
The manner of conducting the observation of responses for analysis that this study took into account the reflection questions, which are of great importance in this exercise. Emphasis is made to see if in determining what is asked, the student achieves realize that the equation of the line that is too influenced by a single value. Therefore, if an analysis of their values will conclude that a value causes error in the results and, thus, be aware that you must always see the scatter diagram to determine which model should be applied to those explained in the during the topic in class.
3.2. Possible Errors in Performing the Tasks
Task A). The student identifies the coordinates wrong, and changes the variables.
Task B). By not manipulate the points correctly, fails to determine the equation of the line.
Task C). Seeing the scatterplot, or point cloud, I chose to select a polynomial regression.
Tasks D and E). Seeing the point cloud is tilted by another method other than requested.
Task F and G). If you cannot perform the tasks D and E properly, therefore, will be wrong in tasks F and G.
4. Results and Discussion
It is recalled that the aim of this study is to evaluate the impact of the use of technology as a fundamental tool and support the student's difficulty in understanding and application of Analysis Simple Linear Regression and Correlation, providing independent learning and to complement the revised classroom lessons.
First of all we must define how the analysis of results is done, I assuming that the answers are classified, because the practice is based on tasks with graphical and application of equations. Thus evaluation codes used were as follows:
1. If you have any idea = Excellent 2. Has no idea = Good
3. Do not understand anything = Poor
Considering the types of measurement scale for the variables according to the classification of Stevens, can be classified into:
Nominal. A variable is measured in nominal scale when names are used to establish categories. To distinguish groupings symbols, letters and even numbers are used, although the latter only play a role of symbolic and not numeric.
Ordinals. At this level also several categories are defined, but besides showing an arrangement exists a relationship of "Higher or Lower than" between them. The labels, symbols or numbers assigned if indicated categories, although it is not possible to know the magnitude of difference between each of the categories.
Interval. This scale measures the variables numerically. The numbers of this scale can be established distances enter two individuals, and the arithmetic operations of addition and subtraction are perfectly feasible and meaningful multiplication and division.
Reason. It is the strongest level since using a numerical system in which zero indicates no characteristic being measured. The arithmetic operations of multiplication and division acquire meaning. The difference between two values is important magnitude and defined.
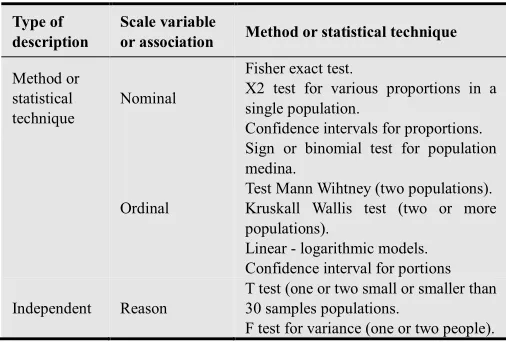
The most common inferential statistical tests according to the measurement range of the variable under study are shown in Table 1 below:
Table 1. Tests inferential statistic
Type of description
Scale variable
or association Method or statistical technique
Method or statistical technique
Nominal
Fisher exact test.
X2 test for various proportions in a single population.
Confidence intervals for proportions.
Ordinal
Sign or binomial test for population medina.
Test Mann Wihtney (two populations). Kruskall Wallis test (two or more populations).
Linear - logarithmic models. Confidence interval for portions
Independent Reason
T test (one or two small or smaller than 30 samples populations.
F test for variance (one or two people).
Based on the above, to perform the data analysis of this study, the Ordinal scale is taken, and since it is an experiment in which no reference results, we used nonparametric tests such statistics.
This is based on the nonparametric statistics is a branch of statistics that studies the evidence and statistical models whose underlying distribution does not conform to the so-called parametric criteria. Their distribution cannot be defined a priori, as are the observed data which determine it.
For this work the Kruskal-Wallis test was used to analyze generally to two groups: Group C Group B computer and no computer, posing hypotheses and results.
The H test or Kruskal-Wallis test is a generalization U test in that it allows us to test the null hypothesis that K independent random samples are identical populations. All observations are arranged together in ranks, and if Ri is the rank sum or occupied by observations of the it shows and n_1 + n (2) + ⋯ + n (k) = n,, the test based on statistics:
H = n(n + 1)12 Rn − 3(n + 1)
The sampling distribution of the statistic H is adequately approximated by the chi-square distribution with Ji K-1 degrees of freedom. (Miller and Freund, 1997, pp. 315-319).
Table 2. Frequencies of the results of the tasks by category
Evaluation codes
Tasks
A B C D E F
Excellent 24 13 17 10 15 17
All right 0 9 4 11 6 3
Wrong 1 3 4 4 4 5
Solution:
1. Null hypothesis: Codes of evolution of the tasks have the same results.
Alternative hypothesis: Codes of evaluations of tasks have different results.
2. Level of significance: α = 0.05.
3. Criteria: Rejection of the null hypothesis if H> 5,991, the value of x20.05 table for two degrees of freedom.
4. Calculations: Sorting the data set in order from lowest to highest, we found that the category Great deals ranks 1, 2, 3.5, 3.5, 5, 6, 8; the results of the category Well, ranges 7, 9, 10.5, 14.5, 17.5, 19.5; Mal and the category ranges 10.5, 12, 14.5, 14.5, 14.5, 18, 20.
Substituting the formula H results:
" =# # 112 $# % &
%
3 #
" 20 ∗ 21 ) 12 29.57 786 1047 1 3
Decision: Since H = 13,670 exceeds 5,991, the null hypothesis should be rejected; conclusion, one can say with 95% level of confidence that the results by task, according to the three categories used to classify the types of responses given by students are not equal.
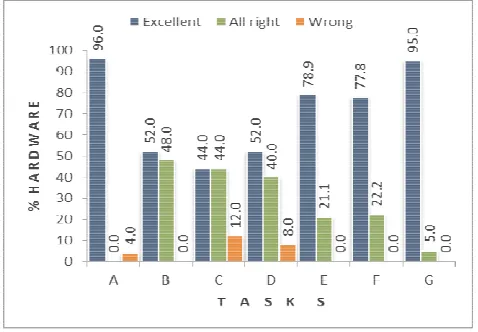
This means, as shown in the graph as a percentage of the table data with which we established earlier hypothesis (Gráfica1), that differences in the results obtained from the various tasks by the students formed teams are very different.
Figure 1. Percentage of task results by category
Just over half of all the teams managed to successfully complete all tasks, especially Task All teams can identify the coordinates of the twelve points with an average percentage of 70.39% and select those that are most off the tre
Frequencies of the results of the tasks by category.
Average
F G
17 18 16.30
1 4.86
6 3.86
1. Null hypothesis: Codes of evolution of the tasks have the
Alternative hypothesis: Codes of evaluations of tasks have
Rejection of the null hypothesis if H> 5,991, the value of x20.05 table for two degrees of freedom.
4. Calculations: Sorting the data set in order from lowest to highest, we found that the category Great deals ranks 1, 2, 3.5, the category Well, ranges 7, 9, 10.5, 14.5, 17.5, 19.5; Mal and the category ranges 10.5, 12, 14.5,
1
3 ∗ 21 13.670
3,670 exceeds 5,991, the null hypothesis should be rejected; conclusion, one can say with 95% level of confidence that the results by task, according to the three categories used to classify the types of responses given
s, as shown in the graph as a percentage of the table data with which we established earlier hypothesis (Gráfica1), that differences in the results obtained from the various tasks by the students formed teams are very different.
task results by category
Just over half of all the teams managed to successfully complete all tasks, especially Task All teams can identify the coordinates of the twelve points with an average percentage of 70.39% and select those that are most off the trend in the
graphs of the tasks Descartes. Similarly, in Task C, E, F, G and more than half of the equipment can identify which type of selected regression according to the point cloud, and applying the least square method for linear regression and determine equation of the line with an average percentage of 25.76%. Only an average rate of 3.43% of all teams did not know what to do from Task B according to the results shown in Table 1, the highest amount is in F and G with 5 and 6 teams who did not make the task; as where the method is applied and do not specify why.
5. Conclusion
This research evaluates the impact of computer use in Correlation and Regression Tasks Descartes, designed for the use of the computer to the concept of scatterplots, straight li fit under a cloud point, calculation of the equation of the line and forecasting results; for students of second semester Engineering Probability and Statistics II. It starts from the idea of explaining the unity of Regression and Correlation traditional way, reinforcing the student to concepts and applying formulas and use of results
want to perform and depending on the graph is the regression type to be apply and to get the results, the utility should be given the prognosis or should be interpreted. After arises implement an evolution Computer Group C and Group B without computer to see who gets the best results when applying the work of Descartes and what is significant is the use of the computer in this area of engineering.
It is essential that students have prior knowledge to assimilate new concepts; to have a significant learning requires leverage previous ideas of how to build skills that will be useful in the professional life of the students. In particular, the acquisition of skills on Linear Regression method must become a fundamental tool, this being significant for its wide application in any workplace.
Moreover, from a particular point of view, the Statistical must be meaningful to make decisions in based on the results and with the help of technology will be very fast implementation.
References
[1] Arancibia, V., Herrera, P., Strasser, K (1999). "Teorías cognitivas del Aprendizaje", en Psicología del Aprendizaje. Santiago de Chile.
[2] Arancibia, Violeta; Herrera, Paulina; Strasser S., Katherine (2008). Manual de Psicología
[3] Educacional. Editorial: Pontificia Universidad Católica de Chile. Santiago.
[4] Ausubel, D. P. y Sullivan, E. (1983). El Desarrollo infantil. Editorial Paidós. Barcelona.
[5] Beco, Guillermo R. (2001). Vigotsky y las Teorías del
Aprendizaje. Consulta del 02
http://perso.wanadoo.es/angel.saez/pagina_nueva_165.htm. graphs of the tasks Descartes. Similarly, in Task C, E, F, G and more than half of the equipment can identify which type of selected regression according to the point cloud, and applying the least square method for linear regression and determine the equation of the line with an average percentage of 25.76%. Only an average rate of 3.43% of all teams did not know what to do from Task B according to the results shown in Table 1, the highest amount is in F and G with 5 and 6 teams who did he task; as where the method is applied and do not
This research evaluates the impact of computer use in Correlation and Regression Tasks Descartes, designed for the use of the computer to the concept of scatterplots, straight line fit under a cloud point, calculation of the equation of the line and forecasting results; for students of second semester Engineering Probability and Statistics II. It starts from the idea of explaining the unity of Regression and Correlation l way, reinforcing the student to concepts and ing formulas and use of results for any outcome you want to perform and depending on the graph is the regression type to be apply and to get the results, the utility should be d be interpreted. After arises implement an evolution Computer Group C and Group B without computer to see who gets the best results when applying the work of Descartes and what is significant is the use of the computer in this area of engineering.
ssential that students have prior knowledge to to have a significant learning requires leverage previous ideas of how to build skills that will be useful in the professional life of the students. In particular, kills on Linear Regression method must become a fundamental tool, this being significant for its wide
Moreover, from a particular point of view, the Statistical must be meaningful to make decisions in based on the results with the help of technology will be very fast
Arancibia, V., Herrera, P., Strasser, K (1999). "Teorías cognitivas del Aprendizaje", en Psicología del Aprendizaje.
Arancibia, Violeta; Herrera, Paulina; Strasser S., Katherine Manual de Psicología
Educacional. Editorial: Pontificia Universidad Católica de
Ausubel, D. P. y Sullivan, E. (1983). El Desarrollo infantil.
Science Journal of Applied Mathematics and Statistics 2015; 3(1): 1-5 5
[6] Becco, G. (2001). Teorías Y Vygotsky Sobre el Aprendizaje. Conceptos centrales de la Perspectiva vygotskiana. Internet: www.monografías.com.
[7] Carretero, Mario (2009). Constructivismo y Educación. Editorial Paidós. Buenos Aires.
[8] Cole, M. y B. Medios (1986). Cognición y pensamiento. Paidós. Buenos Aires.
[9] Cole, M. y S. Scribner (1977). Cultura y pensamiento. Relación de los Procesos cognoscitivos con la cultura, Limosa, México. [10] DeVore, Jay L. (2005). Probability y Estadística párr Ingenieros
y ciencias. Ed. Thomson. Sexta edición.
[11] Galo S., José R. y M. Madrigal, Juan (2009). El Proyecto Descartes: 10 años innovando con TIC. http://descartes.cnice.mec.es/heda/difusion/materiales/xivjaem /Descartes_Galo.pdf
[12] Johnson-Miller, Freund (1997). Probability y Estadística párr. Ingenieros. Editorial Printece Hall (México).
[13] Mendenhall, W., Scheaffer, R. y Wackerly, D. (2003). Estadística matemática con Aplicaciones. Editorial Thomson - México.
[14] Meza Cascante, Luis Gerardo (2002). La Zona de Desarrollo Próximo (ZDP). 3er Festival Nacional y 1er Festival Internacional de Matemática.
[15] Walpole, Meyer (1993). Probability y Estadística párr. Ingenieros. Editorial McGraw-Hill.
[16] http://aportes.educ.ar,aportes.educ.ar/.../el_proyecto_descartes .php. (Agosto 2013)
[17] http://descartes.cnice.mec.es/heda/difusion/materiales/xivjaem /Descartes_Galo.pdf. (Agosto 2013).