The authors’ full names, academic degrees, and affiliations are listed in the Appendix. Address reprint requests to Dr. Gillison at the Ohio State University Comprehensive Cancer Center, Ohio State University, 420 W. 12th Ave., Rm. 690, Columbus, OH 43210, or at maura . gillison@ osumc . edu.
Drs. Ferris and Gillison contributed equal-ly to this article.
This article was published on October 9, 2016, at NEJM.org.
N Engl J Med 2016;375:1856-67. DOI: 10.1056/NEJMoa1602252 Copyright © 2016 Massachusetts Medical Society.
BACKGROUND
Patients with recurrent or metastatic squamous-cell carcinoma of the head and neck after platinum chemotherapy have a very poor prognosis and limited thera-peutic options. Nivolumab, an anti–programmed death 1 (PD-1) monoclonal anti-body, was assessed as treatment for this condition.
METHODS
In this randomized, open-label, phase 3 trial, we assigned, in a 2:1 ratio, 361 patients with recurrent squamous-cell carcinoma of the head and neck whose disease had progressed within 6 months after platinum-based chemotherapy to receive nivolu-mab (at a dose of 3 mg per kilogram of body weight) every 2 weeks or standard, single-agent systemic therapy (methotrexate, docetaxel, or cetuximab). The primary end point was overall survival. Additional end points included progression-free survival, rate of objective response, safety, and patient-reported quality of life.
RESULTS
The median overall survival was 7.5 months (95% confidence interval [CI], 5.5 to 9.1) in the nivolumab group versus 5.1 months (95% CI, 4.0 to 6.0) in the group that received standard therapy. Overall survival was significantly longer with nivolumab than with standard therapy (hazard ratio for death, 0.70; 97.73% CI, 0.51 to 0.96; P = 0.01), and the estimates of the 1-year survival rate were approximately 19 percent-age points higher with nivolumab than with standard therapy (36.0% vs. 16.6%). The median progression-free survival was 2.0 months (95% CI, 1.9 to 2.1) with nivolumab versus 2.3 months (95% CI, 1.9 to 3.1) with standard therapy (hazard ratio for disease progression or death, 0.89; 95% CI, 0.70 to 1.13; P = 0.32). The rate of progression-free survival at 6 months was 19.7% with nivolumab versus 9.9% with standard therapy. The response rate was 13.3% in the nivolumab group versus 5.8% in the standard-therapy group. Treatment-related adverse events of grade 3 or 4 occurred in 13.1% of the patients in the nivolumab group versus 35.1% of those in the standard-therapy group. Physical, role, and social function-ing was stable in the nivolumab group, whereas it was meanfunction-ingfully worse in the standard-therapy group.
CONCLUSIONS
Among patients with platinum-refractory, recurrent squamous-cell carcinoma of the head and neck, treatment with nivolumab resulted in longer overall survival than treatment with standard, single-agent therapy. (Funded by Bristol-Myers Squibb; CheckMate 141 ClinicalTrials.gov number, NCT02105636.)
ABS TR ACT
Nivolumab for Recurrent Squamous-Cell
Carcinoma of the Head and Neck
R.L. Ferris, G. Blumenschein, Jr., J. Fayette, J. Guigay, A.D. Colevas, L. Licitra, K. Harrington, S. Kasper, E.E. Vokes, C. Even, F. Worden, N.F. Saba, L.C. Iglesias Docampo, R. Haddad, T. Rordorf, N. Kiyota, M. Tahara, M. Monga,
M. Lynch, W.J. Geese, J. Kopit, J.W. Shaw, and M.L. Gillison
S
quamous-cell carcinoma of the headand neck is a major cause of cancer-asso-ciated illness and death, with more than 600,000 cases diagnosed annually worldwide.1
Most patients present with locoregionally ad-vanced disease, and more than 50% have recur-rence within 3 years.2-4 Patients with
squamous-cell carcinoma of the head and neck who have cancer progression within 6 months after plati-num-based chemotherapy administered in the con-text of primary or recurrent disease have a medi-an survival of 6 months or less.5 No therapeutic
options prolong survival among these patients.5,6
The recurrence and metastasis of squamous-cell carcinoma of the head and neck are facili-tated by immune evasion,7 which is mediated in
part by expression of the programmed death ligands (PD-L1 and PD-L2) of the T-cell–suppres-sive immune-checkpoint receptor programmed death 1 (PD-1).8-11 Nivolumab, a fully human IgG4
anti–PD-1 monoclonal antibody, has shown anti-tumor efficacy in multiple anti-tumor types.12,13 We
designed a randomized trial to investigate wheth-er ovwheth-erall survival would be longwheth-er with nivolumab therapy than with standard therapy, among pa-tients with platinum-refractory squamous-cell carcinoma of the head and neck.
Methods Patients
Eligible patients had histologically confirmed, recurrent squamous-cell carcinoma of the head and neck (including metastatic disease) of the oral cavity, pharynx, or larynx that was not ame-nable to curative treatment; tumor progression or recurrence within 6 months after the last dose of platinum-containing chemotherapy adminis-tered as adjuvant therapy or in the context of primary or recurrent disease; an age of at least 18 years; an Eastern Cooperative Oncology Group performance-status score of 0 or 1 (on a scale from 0 to 5, with higher numbers indicating greater disability); adequate bone marrow, he-patic, and renal function; and measurable dis-ease according to Response Evaluation Criteria in Solid Tumors (RECIST), version 1.1.14 Major
exclusion criteria were active brain metastases, autoimmune disease, or systemic immunosup-pression; known human immunodeficiency virus or hepatitis B or C virus infection; and previous therapy targeting T-cell costimulating or immune-checkpoint pathways.
Trial Design and Treatments
Patients were randomly assigned in a 2:1 ratio to receive intravenous nivolumab (Opdivo, Bristol-Myers Squibb) or a standard, single-agent therapy of the investigator’s choice, with stratification according to receipt of previous cetuximab ther-apy (yes or no). Nivolumab was administered at a dose of 3 mg per kilogram of body weight every 2 weeks. Standard therapy consisted of weekly intravenous administration of methotrexate at a dose of 40 to 60 mg per square meter of body-surface area, docetaxel at a dose of 30 to 40 mg per square meter, or cetuximab at a dose of 250 mg per square meter after a loading dose of 400 mg per square meter.
End Points and Assessments
The primary end point was overall survival, which was defined as the time from randomization to the date of death from any cause. Secondary end points were progression-free survival (time from randomization to the date of disease progres-sion or death) and the rate of objective response according to RECIST, version 1.1. Additional pspecified end points included the time to re-sponse; associations between PD-L1 level and human papillomavirus (HPV) status and overall survival, progression-free survival, and response rate; safety; and quality-of-life assessments.
Tumor response was assessed by investigators according to RECIST, version 1.1, every 6 weeks beginning at week 9. Patients were treated until an unacceptable level of drug-related toxic effects occurred or until disease progression. However, nivolumab treatment could be continued beyond disease progression, as assessed clinically or radiographically, if the investigator assessed that it was providing clinical benefit. Patients were followed for overall survival every 3 months until death, loss to follow-up, or withdrawal of consent.
metho-trexate, docetaxel, and cetuximab on the basis of the type and grade of the toxic effect.
Patient-reported outcomes, including symp-toms and health-related quality of life, were ex-ploratory end points and were evaluated with the use of the European Organization for Research and Treatment of Cancer (EORTC) Quality of Life Questionnaire–Core 30 module (QLQ-C30) and the head-and-neck–specific module (QLQ-H&N35). Scores for these modules range from 0 to 100, with higher scores indicating better functioning or well-being or higher symptom burden, although scales measuring symptom burden were reverse-scored to facilitate presentation. The propor-tion of patients reporting health problems was assessed with the use of the three-level version of the European Quality of Life–5 Dimensions (EQ-5D-3L) questionnaire. Patients also com-pleted the EQ-5D-3L visual-analogue scale, for which scores range from 0 to 100 and higher scores indicate better perceived health status.
Biomarker Analysis
Fresh or archived pretreatment tumor specimens were obtained after the last therapy and before trial entry from 90.6% of the patients. For pa-tients with oropharyngeal cancer, tumor HPV status, assessed by means of p16 immunohisto-chemical testing, was required to be documented by local or central analysis and was defined as positive if diffuse staining was present in at least 70% of the tumor cells.15 Immunochemical
test-ing for p16 was not performed for nonoropha-ryngeal cancers because of the low prevalence of HPV-positive tumors and poor specificity for HPV status at these anatomical sites.16 Tumor PD-L1
membrane expression was evaluated centrally by means of immunohistochemical testing (Dako North America) with the use of a rabbit antihu-man PD-L1 antibody (clone 28–8, Epitomics) and was scored at prespecified expression levels, in-cluding levels of 1% or more, 5% or more, and 10% or more in a minimum of 100 tumor cells that could be evaluated.17
Trial Oversight
This trial was registered with the National Can-cer Institute and was approved by the tional review board at each participating institu-tion. Written informed consent was obtained from all the patients before enrollment. The trial was designed by the academic authors in
collabo-ration with the sponsor (Bristol-Myers Squibb). The first and last authors attest to the accuracy and completeness of the data and analyses and vouch for adherence of the trial to the protocol. Medical-writing support, funded by the sponsor, was provided by inScience Communications and Chrysalis Medical Communications.
Statistical Analysis
We calculated the required number of events as-suming one planned interim analysis of overall survival after 70% of the events occurred and stopping boundaries that were based on an O’Brien–Fleming alpha-spending function.18 We
calculated that a sample of 360 patients and a total of 278 deaths would be required to ensure that a two-sided test procedure with one interim analysis, a 2:1 ratio for randomization, and an experiment-wide false positive rate of 5% would provide the trial with 90% power to detect a hazard ratio of 0.667 for the comparison of nivolumab with standard therapy.
Analyses of baseline characteristics and effi-cacy followed the intention-to-treat principle. Analyses of dosing and safety were restricted to patients who received at least one dose of ther-apy. The distributions of overall survival and progression-free survival were estimated by the Kaplan–Meier method and compared by means of log-rank tests stratified according to previous receipt of cetuximab (yes or no). Cox proportional-hazards models (stratified according to status with respect to previous receipt of cetuximab) were used to estimate hazard ratios and com-pute confidence intervals. A generalization of the Brookmeyer and Crowley method was used to compute confidence intervals for the median sur-vival times, and the Borgan and Liestøl method was used to compute confidence intervals for survival at specific time points.19
rate would each be tested, hierarchically at an alpha level of 5%, to ensure a false positive rate of no more than 5% for testing all three end points.
Prespecified analyses were performed to assess the consistency of treatment effect on the end points in a range of baseline subgroups, includ-ing subgroups defined accordinclud-ing to PD-L1 expres-sion status and p16 status. A post hoc analysis of treatment effect in PD-L1 expression subgroups (≥1% vs. <1%) according to p16 status (positive vs. negative) was also performed. In addition, tests for interactions between treatment and PD-L1 expression level (prespecified) and be-tween treatment and p16 status (post hoc) were performed. All these analyses were exploratory and descriptive: no adjustments for multiple com-parisons were made, nor was the trial powered to detect interactions.
For patient-reported outcomes, a clinically meaningful change in score was regarded as 10 points for the EORTC C30 and QLQ-H&N35 and as 7 points for the visual-analogue scale of the EQ-5D-3L questionnaire.20-22
Analy-sis of covariance was used to compare the mean score changes between groups, with a separate analysis being performed for each patient-reported outcome. Each analysis was adjusted for treat-ment, visit, status with respect to previous cetux-imab use, and the baseline value of the patient-reported outcome.
The data cutoff point for the analyses of over-all survival, progression-free survival, and safety was December 18, 2015, which was the date of the planned interim analysis. Data on rate of response were based on a database lock on May 5, 2016. At the interim analysis, the independent data monitoring committee confirmed that the P value for the comparison of overall survival was below the formal statistical boundary for signifi-cance of 0.0227.
R esults Patients and Treatment
From June 2014 through August 2015, we ran-domly assigned 240 patients to receive nivolu-mab and 121 to receive standard therapy (Fig. S1 in the Supplementary Appendix, available at NEJM.org). Previous treatment included radio-therapy in 91.4% of the patients and two or more lines of systemic therapy in 54.5%. The
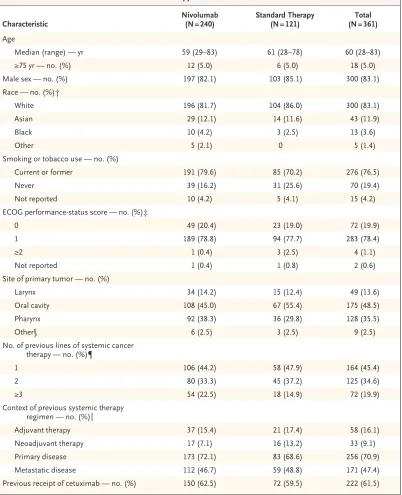
treat-ment groups were balanced with respect to most demographic and clinical characteristics (Table 1), although the standard-therapy group included higher percentages of patients 65 years of age or older and of patients who had never smoked. Tumor p16 status was reported, per protocol, for 178 patients (113 patients in the nivolumab group and 65 in the standard-therapy group), and 26.2% of the patients in the nivolumab group and 24.0% in the standard-therapy group had positive p16 status.
Of 361 patients who underwent randomiza-tion, 347 (96.1%) received one or more doses of assigned therapy (236 patients in the nivolumab group and 111 in the standard-therapy group). Standard therapies that were administered in-cluded methotrexate (in 46 patients), docetaxel (in 52), and cetuximab (in 13). The median dura-tion of treatment was 1.9 months in each group. Data on dose delays and reductions according to treatment group are provided in Table S1 in the Supplementary Appendix. At the time of analy-sis, 41 of 236 patients (17.4%) were still receiving nivolumab and 3 of 111 (2.7%) were still receiv-ing standard therapy.
Efficacy
Among 361 patients who underwent randomiza-tion, 133 deaths (55.4% of patients) occurred in the nivolumab group and 85 deaths (70.2% of patients) occurred in the standard-therapy group. The median duration of follow-up for overall survival was 5.1 months (range, 0 to 16.8).
The median overall survival was 7.5 months (95% confidence interval [CI], 5.5 to 9.1) in the nivolumab group versus 5.1 months (95% CI, 4.0 to 6.0) in the standard-therapy group. Overall survival was significantly longer with nivolumab than with standard therapy, and nivolumab-treated patients had a risk of death that was 30% lower than the risk among patients assigned to standard therapy (hazard ratio, 0.70; 97.73% CI, 0.51 to 0.96; P = 0.01) (Fig. 1A). The delayed separation of the Kaplan–Meier curves for over-all survival is indicative of nonproportionality, and the hazard ratio should be thought of as an average over time.23 The estimated rate of overall
survival at 1 year among patients treated with nivolumab (36.0%; 95% CI, 28.5 to 43.4) was more than double the rate with standard therapy (16.6%; 95% CI, 8.6 to 26.8).
Characteristic Nivolumab (N = 240) Standard Therapy (N = 121) (N = 361)Total Age
Median (range) — yr 59 (29–83) 61 (28–78) 60 (28–83)
≥75 yr — no. (%) 12 (5.0) 6 (5.0) 18 (5.0)
Male sex — no. (%) 197 (82.1) 103 (85.1) 300 (83.1)
Race — no. (%)†
White 196 (81.7) 104 (86.0) 300 (83.1)
Asian 29 (12.1) 14 (11.6) 43 (11.9)
Black 10 (4.2) 3 (2.5) 13 (3.6)
Other 5 (2.1) 0 5 (1.4)
Smoking or tobacco use — no. (%)
Current or former 191 (79.6) 85 (70.2) 276 (76.5)
Never 39 (16.2) 31 (25.6) 70 (19.4)
Not reported 10 (4.2) 5 (4.1) 15 (4.2)
ECOG performance-status score — no. (%)‡
0 49 (20.4) 23 (19.0) 72 (19.9)
1 189 (78.8) 94 (77.7) 283 (78.4)
≥2 1 (0.4) 3 (2.5) 4 (1.1)
Not reported 1 (0.4) 1 (0.8) 2 (0.6)
Site of primary tumor — no. (%)
Larynx 34 (14.2) 15 (12.4) 49 (13.6)
Oral cavity 108 (45.0) 67 (55.4) 175 (48.5)
Pharynx 92 (38.3) 36 (29.8) 128 (35.5)
Other§ 6 (2.5) 3 (2.5) 9 (2.5)
No. of previous lines of systemic cancer therapy — no. (%)¶
1 106 (44.2) 58 (47.9) 164 (45.4)
2 80 (33.3) 45 (37.2) 125 (34.6)
≥3 54 (22.5) 18 (14.9) 72 (19.9)
Context of previous systemic therapy regimen — no. (%)‖
Adjuvant therapy 37 (15.4) 21 (17.4) 58 (16.1)
Neoadjuvant therapy 17 (7.1) 16 (13.2) 33 (9.1)
Primary disease 173 (72.1) 83 (68.6) 256 (70.9)
Metastatic disease 112 (46.7) 59 (48.8) 171 (47.4)
Previous receipt of cetuximab — no. (%) 150 (62.5) 72 (59.5) 222 (61.5)
* There were no significant (P<0.05) between-group differences in the characteristics listed here, except for smoking (P = 0.047). Percentages may not total 100 because of rounding.
† Race was self-reported.
‡ Eastern Cooperative Oncology Group (ECOG) performance status is scored on a scale from 0 to 5, with higher num-bers indicating greater disability.
§ The “Other” category included patients with a tumor in more than one of the categories (i.e., larynx, oral cavity, or pharynx). ¶ A line of systemic chemotherapy was defined as any chemotherapy that was administered as part of primary therapy for squamous-cell carcinoma of the head and neck (e.g., induction or concurrent chemoradiotherapy) or any single-agent or multiple-agent chemotherapy regimen that was administered after a diagnosis of recurrent squamous-cell carcinoma of the head and neck.
overall survival than all the options for standard therapy: methotrexate (median, 4.6 months; haz-ard ratio for death, 0.64; 95% CI, 0.43 to 0.96), docetaxel (median, 5.8 months; hazard ratio, 0.82; 95% CI, 0.53 to 1.28), and cetuximab (me-dian, 4.1 months; hazard ratio, 0.47; 95% CI, 0.22 to 1.01). Across prespecified demographic and clinical subgroups, the estimate of the haz-ard ratio for death in the analysis of overall survival with nivolumab versus standard therapy was less than 1 (Fig. 1C, and Fig. S2 in the Supplementary Appendix).
No significant difference between groups was observed with regard to the rate of progression-free survival (hazard ratio for disease progres-sion or death, 0.89; 95% CI, 0.70 to 1.13; P = 0.32). The crossing of the Kaplan–Meier curves is in-dicative of nonproportionality. The median pro-gression-free survival was 2.0 months (95% CI, 1.9 to 2.1) in the nivolumab group versus 2.3 months (95% CI, 1.9 to 3.1) in the standard-therapy group (Fig. 1B). However, a late separa-tion in the Kaplan–Meier curves was observed, and the estimated rates of progression-free sur-vival at 6 months were 19.7% (95% CI, 14.6 to 25.4) in the nivolumab group and 9.9% (95% CI, 5.0 to 16.9) in the standard-therapy group.
The response rate among nivolumab-treated patients was 13.3% (95% CI, 9.3 to 18.3), includ-ing 6 complete responses and 26 partial respons-es. In the standard-therapy group, the response rate was 5.8% (95% CI, 2.4 to 11.6), including 1 complete response and 6 partial responses. The median time to response was 2.1 months with nivolumab versus 2.0 months with standard therapy. Tumor reductions were more durable with nivolumab, as indicated by the tumor-burden plots over time for patients who had either a partial response or a complete response (Fig. S3 in the Supplementary Appendix).
PD-L1 Expression and p16 Status
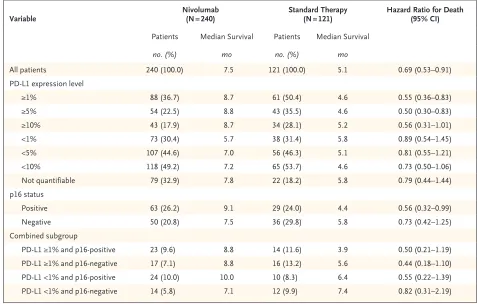
A prespecified, exploratory analysis was per-formed to evaluate the consistency of the treat-ment effect in subgroups defined according to tumor PD-L1 expression level (≥1% vs. <1%) (Table 2). Tumor PD-L1 expression status could be evaluated in 260 of 361 patients (72.0%) (Table S2 in the Supplementary Appendix). Among the patients who could be evaluated, 57.3% had a PD-L1 expression level of 1% or more.
In the analysis of overall survival in the
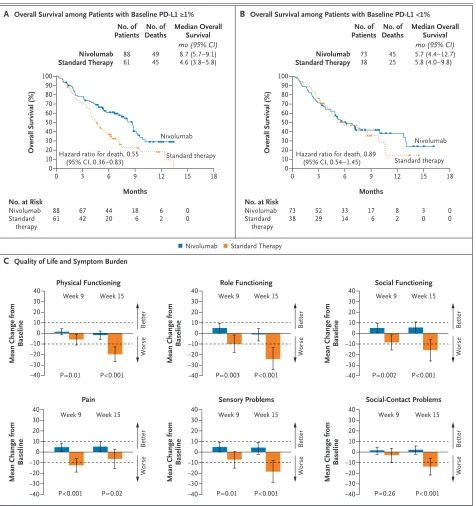
sub-group of patients with a PD-L1 expression level of 1% or more, the hazard ratio for death among patients treated with nivolumab versus standard therapy was 0.55 (95% CI, 0.36 to 0.83) (Fig. 2A), whereas in the subgroup of patients with a PD-L1 expression level of less than 1%, the hazard ratio was 0.89 (95% CI, 0.54 to 1.45; P = 0.17 for interaction) (Fig. 2B). The estimates of the haz-ard ratio for death in the analysis of overall survival in the subgroups of patients with PD-L1 expression levels of 5% or more and of 10% or more were similar to those among patients with PD-L1 expression levels of 1% or more (Table 2).
In our post hoc exploratory analysis involving the 178 patients for whom tumor p16 status was reported, the median overall survival appeared to be longer with nivolumab than with standard therapy regardless of p16 status (Table 2). Among patients with p16-positive tumors, the median overall survival was 9.1 months in the nivolumab group versus 4.4 months in the standard-therapy group (hazard ratio for death, 0.56; 95% CI, 0.32 to 0.99); among patients with p16-negative tu-mors, the median overall survival was 7.5 versus 5.8 months (hazard ratio, 0.73; 95% CI, 0.42 to 1.25; P = 0.55 for interaction) (Figs. S4 and S5 in the Supplementary Appendix).
We further explored the effect of nivolumab versus standard therapy on overall survival in subgroups defined according to both PD-L1 ex-pression (≥1% vs. <1%) and tumor p16 status (positive vs. negative) (Table 2). The estimated hazard ratios for death in the analysis of overall survival with nivolumab versus standard therapy were less than 1 in all four subgroups. Results of the exploratory analysis of the treatment ef-fect on response rates in the subgroups defined according to tumor PD-L1 level and p16 status are provided in Table S3 in the Supplementary Appendix.
Safety
Overall Survival (%) 100 80 90 70 60 40 30 10 50 20 0
0 3 6 9 12 15 18
Months
A Overall Survival
C Treatment Effect on Overall Survival, According to Subgroup Hazard ratio for death, 0.70
(97.73% CI, 0.51–0.96) P=0.01
No. at Risk Nivolumab Standard
therapy 240
121 16787 10942 5217 245 71 00 Standard
therapy
Nivolumab
Progression–free Survival (%)
100 80 90 70 60 40 30 10 50 20 0
0 3 6 9 12 15 18
Months Standard therapy Nivolumab No. of Deaths No. of Patients Nivolumab
Standard Therapy 240121 13385 36.0 (28.5–43.4)16.6 (8.6–26.8) 7.5 (5.5–9.1)5.1 (4.0–6.0) Median Overall
Survival 1–Yr Overall
Survival Rate
% (95% CI) mo (95% CI)
B Progression-free Survival
Hazard ratio for disease progression or death, 0.89 (95% CI, 0.70–1.13) P=0.32
No. at Risk Nivolumab Standard
therapy 240
121 7943 329 122 40 10 00 No. of
Events No. of Patients
Nivolumab
Standard Therapy 240121 190103 2.0 (1.9–2.1)2.3 (1.9–3.1) Median Progression-free
Survival (95% CI) mo
Overall Age
<65 yr ≥65 yr and <75 yr ≥75 yr
ECOG performance-status score 0
≥1 Not reported Previous cetuximab use
Yes No
Intended standard therapy Cetuximab
Methotrexate Docetaxel Site of primary tumor
Larynx Oral cavity Pharynx Other
No. of previous lines of systemic therapy 1
2 ≥3
Platinum-refractory disease in context of primary therapy
Yes No
Unstratified Hazard Ratio (95% CI) no. of patients
Subgroup 240 172 56 12 49 190 1 147 93 33 119 88 34 108 92 6 106 80 54 52 188 121 76 39 6 23 97 1 74 47 15 52 54 15 67 36 3 58 45 18 26 95 Standard Therapy Nivolumab
0.50 1.00 2.00 4.00 8.00
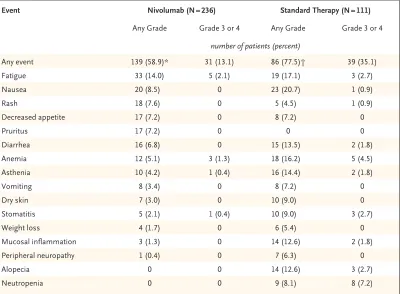
rash, decreased appetite, and pruritus. Among the select adverse events, gastrointestinal events were less common with nivolumab than with standard therapy (occurring in 6.8% vs. 14.4% of the patients; primarily diarrhea), whereas ad-verse events of the skin were more common with nivolumab (in 15.7% vs. 12.6%; primarily rash and pruritus), as were adverse events of the
endo-crine system (in 7.6% vs. 0.9%; primarily hypo-thyroidism). Pneumonitis was observed in 2.1% of the patients treated with nivolumab. Two treatment-related deaths were reported in the nivolumab group (pneumonitis and hypercalce-mia in one patient each), and one patient in the standard-therapy group died from a treatment-related lung infection.
Variable Nivolumab (N = 240) Standard Therapy (N = 121) Hazard Ratio for Death (95% CI)
Patients Median Survival Patients Median Survival
no. (%) mo no. (%) mo
All patients 240 (100.0) 7.5 121 (100.0) 5.1 0.69 (0.53–0.91)
PD-L1 expression level
≥1% 88 (36.7) 8.7 61 (50.4) 4.6 0.55 (0.36–0.83)
≥5% 54 (22.5) 8.8 43 (35.5) 4.6 0.50 (0.30–0.83)
≥10% 43 (17.9) 8.7 34 (28.1) 5.2 0.56 (0.31–1.01)
<1% 73 (30.4) 5.7 38 (31.4) 5.8 0.89 (0.54–1.45)
<5% 107 (44.6) 7.0 56 (46.3) 5.1 0.81 (0.55–1.21)
<10% 118 (49.2) 7.2 65 (53.7) 4.6 0.73 (0.50–1.06)
Not quantifiable 79 (32.9) 7.8 22 (18.2) 5.8 0.79 (0.44–1.44)
p16 status
Positive 63 (26.2) 9.1 29 (24.0) 4.4 0.56 (0.32–0.99)
Negative 50 (20.8) 7.5 36 (29.8) 5.8 0.73 (0.42–1.25)
Combined subgroup
PD-L1 ≥1% and p16-positive 23 (9.6) 8.8 14 (11.6) 3.9 0.50 (0.21–1.19)
PD-L1 ≥1% and p16-negative 17 (7.1) 8.8 16 (13.2) 5.6 0.44 (0.18–1.10)
PD-L1 <1% and p16-positive 24 (10.0) 10.0 10 (8.3) 6.4 0.55 (0.22–1.39)
PD-L1 <1% and p16-negative 14 (5.8) 7.1 12 (9.9) 7.4 0.82 (0.31–2.19)
* Expression of the programmed death 1 ligand 1 (PD-L1) was measured in 260 patients (161 patients in the nivolumab group and 99 in the standard-therapy group), and the p16 level in 178 patients (113 in the nivolumab group and 65 in the standard-therapy group). Hazard ratios are from unstratified Cox proportional-hazards models.
Table 2. Exploratory Analysis of Overall Survival According to Tumor PD-L1 Expression and p16 Status Subgroups.* Figure 1 (facing page). Overall Survival, Progression-free Survival, and Treatment Effect on Overall Survival According to Subgroup.
Figure 2. Overall Survival According to Baseline PD-L1 Status and Quality of Life and Symptom Burden.
Kaplan–Meier curves for overall survival according to tumor programmed death 1 ligand 1 (PD-L1) expression of 1% or higher and of less than 1% are shown in Panels A and B, respectively. Symbols indicate censored observations. Hazard ratios (and 95% confidence intervals) were computed with the use of a Cox proportional-hazards model. Panel C shows the results of multivariable analyses of adjusted mean changes from baseline in patient-reported outcomes at weeks 9 and 15, stratified according to treatment group, for 129 patients with questionnaire responses. Least-squares mean estimates were based on analyses of covariance of changes in scores from baseline with adjustment for treat-ment group, visit, status with respect to previous cetuximab use, and baseline score. Physical, role, and social functioning were assessed by means of the European Organization for Research and Treatment of Cancer (EORTC) Quality of Life Questionnaire–Core 30 module (QLQ-C30), and pain, sensory problems, and social-contact problems were assessed by means of the EORTC head-and-neck–specific module (QLQ-H&N35). All scales range from 0 to 100 and were scored such that higher values indicated better functioning or lower symptom burden. A clinically meaningful score change was regarded as one of 10 points (dashed lines) or more.21,22I bars indicate 95% confidence intervals.
Overall Survival (%)
100 80 90 70 60 40 30 10 50 20 0
0 3 6 9 12 15 18
Months
A Overall Survival among Patients with Baseline PD-L1 ≥1%
C Quality of Life and Symptom Burden Hazard ratio for death, 0.55
(95% CI, 0.36–0.83)
No. at Risk Nivolumab Standard
therapy 88
61 6742 4420 186 62 00 Standard therapy Nivolumab No. of Deaths No. of Patients Nivolumab Standard Therapy 88
61 4945 8.7 (5.7–9.1)4.6 (3.8–5.8) Median Overall
Survival mo (95% CI)
Overall Survival (%)
100 80 90 70 60 40 30 10 50 20 0
0 3 6 9 12 15 18
Months
B Overall Survival among Patients with Baseline PD-L1 <1%
Hazard ratio for death, 0.89 (95% CI, 0.54–1.45)
No. at Risk Nivolumab Standard
therapy 73
38 5229 3314 176 82 30 00 Standard therapy Nivolumab No. of Deaths No. of Patients Nivolumab Standard Therapy 73
38 4525 5.7 (4.4–12.7)5.8 (4.0–9.8) Median Overall
Survival mo (95% CI)
40 30 20 10 0 −10 −30 −40 −20
Nivolumab Standard Therapy
P=0.01 P<0.001 Week 9 Week 15
Better
Worse
Physical Functioning
Mean Change from
Baseline 10 0 −10 −30 −40 −20 40 30 20 P=0.003 P<0.001 Week 9 Week 15 Role Functioning
Mean Change from
Baseline Better Worse 40 30 20 10 0 −10 −30 −40 −20 Better Worse P=0.002 P<0.001 Week 9 Week 15 Social Functioning
Mean Change from
Baseline
−40 P<0.001 P=0.02
40 30 20 10 0 −10 −30 −40 −20 Better Worse
Mean Change from
Baseline
P=0.26 P<0.001 Week 9 Week 15 Social-Contact Problems 40 30 20 10 0 −10 −30 −20 Better Worse
Mean Change from
Baseline
Week 9 Week 15 Pain 40 30 20 10 0 −10 −30 −40 −20 Better Worse
Mean Change from
Baseline
Patient-Reported Outcomes
Patient-reported quality-of-life measures were similar at baseline among patients randomly signed to the nivolumab group and those as-signed to the standard-therapy group (Table S7 in the Supplementary Appendix). Analyses were limited to data collected through week 15 owing to a low number of responses to the question-naires in the standard-therapy group after that time point (Table S8 in the Supplementary Ap-pendix). Patients in the standard-therapy group reported clinically meaningful worsening of phys-ical, role, and social functioning (as assessed by means of the QLQ-C30), as well as of pain, sensory problems, and social-contact problems (as assessed by means of the QLQ-H&N35). Con-versely, among patients treated with nivolumab, these measures remained nearly stable or showed slight improvements. P values showed significant between-group differences at both week 9 and week 15 for most comparisons (Fig. 2C). Addi-tional patient-reported outcome data, including health problems and evaluations of health as
measured by the EQ-5D-3L questionnaire, are provided in Table S9 in the Supplementary Ap-pendix.
Discussion
Among patients with recurrent squamous-cell carcinoma of the head and neck who had dis-ease progression after platinum-based chemo-therapy, treatment with nivolumab resulted in significantly longer survival than treatment with standard therapy. Patients who were treated with nivolumab had stability in several measures of quality of life, whereas the patients who received standard therapy had declines in these measures.
Our exploratory biomarker analysis indicated that patients who were treated with nivolumab appeared to have longer overall survival than those treated with standard therapy, regardless of tumor PD-L1 expression or p16 status. Although we observed preliminary evidence that patients with a tumor PD-L1 expression level of 1% or more or p16-positive tumors (or both) may have
Event Nivolumab (N = 236) Standard Therapy (N = 111)
Any Grade Grade 3 or 4 Any Grade Grade 3 or 4
number of patients (percent)
Any event 139 (58.9)* 31 (13.1) 86 (77.5)† 39 (35.1)
Fatigue 33 (14.0) 5 (2.1) 19 (17.1) 3 (2.7)
Nausea 20 (8.5) 0 23 (20.7) 1 (0.9)
Rash 18 (7.6) 0 5 (4.5) 1 (0.9)
Decreased appetite 17 (7.2) 0 8 (7.2) 0
Pruritus 17 (7.2) 0 0 0
Diarrhea 16 (6.8) 0 15 (13.5) 2 (1.8)
Anemia 12 (5.1) 3 (1.3) 18 (16.2) 5 (4.5)
Asthenia 10 (4.2) 1 (0.4) 16 (14.4) 2 (1.8)
Vomiting 8 (3.4) 0 8 (7.2) 0
Dry skin 7 (3.0) 0 10 (9.0) 0
Stomatitis 5 (2.1) 1 (0.4) 10 (9.0) 3 (2.7)
Weight loss 4 (1.7) 0 6 (5.4) 0
Mucosal inflammation 3 (1.3) 0 14 (12.6) 2 (1.8)
Peripheral neuropathy 1 (0.4) 0 7 (6.3) 0
Alopecia 0 0 14 (12.6) 3 (2.7)
Neutropenia 0 0 9 (8.1) 8 (7.2)
* Data include one patient with a grade 5 event of hypercalcemia and one patient with grade 3 pneumonitis who subse-quently died of a grade 5 pulmonary embolism.
† Data include one patient with a grade 5 event of lung infection.
a greater magnitude of effect from nivolumab therapy than those whose PD-L1 level was less than 1% or who had p16-negative tumors, the interactions were not significant and were not corrected for multiple comparisons. The response data from this trial are consistent with those from a previous phase 1b trial of anti–PD-1 therapy.24,25
In conclusion, nivolumab prolonged survival, as compared with standard therapy, among pa-tients with platinum-refractory squamous-cell carcinoma of the head and neck. Nivolumab was associated with fewer toxic effects of grade 3 or 4 than standard therapy (13.1% vs. 35.1%) and with maintenance of quality of life among
pa-tients with a treatment-refractory cancer that otherwise has serious adverse effects on quality of life as it leads to death.
Supported by Bristol-Myers Squibb.
Disclosure forms provided by authors are available with the full text of this article at NEJM.org.
We thank the patients and their families; the study teams in-volved in the trial; the staff of Ono Pharmaceutical, Osaka, Japan; the staff of Dako North America for collaborative devel-opment of the automated programmed death 1 ligand immuno-histochemical assay; Ludovic Astier for serving as the Check-Mate 141 protocol manager; Naveed Imshad, M.S., and Karthik Darbha, M.S., for statistical programming; Kim Cocks, Ph.D., Fiona Taylor, M.Biochem., and Michael DeRosa, M.A., for infer-ential patient-reported outcome analyses; and Michelle Daniels, M.D., of inScience Communications, Springer Healthcare, and Daniel Hutta, Ph.D., of Chrysalis Medical Communications, for medical writing and editorial assistance (funded by Bristol-Myers Squibb) with an earlier version of the manuscript.
Appendix
The authors’ full names and academic degrees are as follows: Robert L. Ferris, M.D., Ph.D., George Blumenschein, Jr., M.D., Jerome Fayette, M.D., Ph.D., Joel Guigay, M.D., A. Dimitrios Colevas, M.D., Lisa Licitra, M.D., Kevin Harrington, Ph.D., F.R.C.P., F.R.C.R., Stefan Kasper, M.D., Everett E. Vokes, M.D., Caroline Even, M.D., Francis Worden, M.D., Nabil F. Saba, M.D., Lara C. Iglesias Docampo, M.D., Robert Haddad, M.D., Tamara Rordorf, M.D., Naomi Kiyota, M.D., Ph.D., Makoto Tahara, M.D., Ph.D., Manish Monga, M.D., Mark Lynch, Ph.D., William J. Geese, Ph.D., Justin Kopit, Ph.D., James W. Shaw, Pharm.D., Ph.D., M.P.H., and Maura L. Gillison, M.D., Ph.D.
The authors’ affiliations are as follows: the University of Pittsburgh Medical Center and Cancer Institute, Pittsburgh (R.L.F.); the Department of Thoracic–Head and Neck Medical Oncology, University of Texas M.D. Anderson Cancer Center, Houston (G.B.); Centre Leon Berard, Lyon (J.F.), Centre Antoine Lacassagne, Nice (J.G.), and Institut Gustave Roussy, Villejuif (C.E.) — all in France; Stanford Cancer Institute, Stanford, CA (A.D.C.); Fondazione Istituto di Ricovero e Cura a Carattere Scientifico, Istituto Nazionale Tumori, Milan (L.L.); Institute of Cancer Research–Royal Marsden National Institute for Health Research Biomedical Research Centre, London (K.H.); University Hospital Essen, Essen, Germany (S.K.); University of Chicago, Chicago (E.E.V.); University of Michigan, Ann Arbor (F.W.); Winship Cancer Institute of Emory University, Atlanta (N.F.S.); Hospital Universitario 12 de Octubre, Madrid (L.C.I.D.); Dana–Farber Cancer Institute, Boston (R.H.); Universitätsspital Zurich, Zurich, Switzerland (T.R.); Kobe University Hospital, Kobe (N.K.), and Na-tional Cancer Center Hospital East, Kashiwa (M.T.) — both in Japan; Bristol-Myers Squibb, Princeton, NJ (M.M., M.L., W.J.G., J.K., J.W.S.); and Ohio State University, Columbus (M.L.G.).
References
1. Ferlay J, Soerjomataram I, Dikshit R, et al. Cancer incidence and mortality worldwide: sources, methods and major patterns in GLOBOCAN 2012. Int J Can-cer 2015; 136(5): E359-86.
2. Pignon JP, le Maître A, Maillard E, Bourhis J. Meta-analysis of chemotherapy in head and neck cancer (MACH-NC): an update on 93 randomised trials and 17,346 patients. Radiother Oncol 2009; 92: 4-14.
3. Bernier J, Domenge C, Ozsahin M, et al. Postoperative irradiation with or with-out concomitant chemotherapy for locally advanced head and neck cancer. N Engl J Med 2004; 350: 1945-52.
4. Cooper JS, Pajak TF, Forastiere AA, et al. Postoperative concurrent radiotherapy and chemotherapy for high-risk squamous-cell carcinoma of the head and neck. N Engl J Med 2004; 350: 1937-44.
5. Saloura V, Cohen EE, Licitra L, et al. An open-label single-arm, phase II trial of zalutumumab, a human monoclonal anti-EGFR antibody, in patients with platinum-refractory squamous cell carcinoma of the head and neck. Cancer Chemother Pharmacol 2014; 73: 1227-39.
6. Machiels JP, Haddad RI, Fayette J, et al. Afatinib versus methotrexate as second-line treatment in patients with recurrent or metastatic squamous-cell carcinoma of the head and neck progressing on or af-ter platinum-based therapy (LUX-Head & Neck 1): an open-label, randomised phase 3 trial. Lancet Oncol 2015; 16: 583-94.
7. Ferris RL. Immunology and immuno-therapy of head and neck cancer. J Clin Oncol 2015; 33: 3293-304.
8. Topalian SL, Drake CG, Pardoll DM. Immune checkpoint blockade: a common denominator approach to cancer therapy. Cancer Cell 2015; 27: 450-61.
9. Li J, Jie HB, Lei Y, et al. PD-1/SHP-2 inhibits Tc1/Th1 phenotypic responses and the activation of T cells in the tumor micro-environment. Cancer Res 2015; 75: 508-18.
10. Badoual C, Hans S, Merillon N, et al. PD-1-expressing tumor-infiltrating T cells are a favorable prognostic biomarker in HPV-associated head and neck cancer. Cancer Res 2013; 73: 128-38.
11. Concha-Benavente F, Srivastava RM, Trivedi S, et al. Identification of the cell-intrinsic and -extrinsic pathways down-stream of EGFR and IFNγ that induce
PD-L1 expression in head and neck can-cer. Cancer Res 2016; 76: 1031-43.
12. Brahmer J, Reckamp KL, Baas P, et al. Nivolumab versus docetaxel in advanced squamous-cell non–small-cell lung cancer. N Engl J Med 2015; 373: 123-35.
13. Borghaei H, Paz-Ares L, Horn L, et al. Nivolumab versus docetaxel in advanced nonsquamous non–small-cell lung cancer. N Engl J Med 2015; 373: 1627-39.
14. Eisenhauer EA, Therasse P, Bogaerts J, et al. New response evaluation criteria in solid tumours: revised RECIST guideline (version 1.1). Eur J Cancer 2009; 45: 228-47.
15. Jordan RC, Lingen MW, Perez-Ordonez B, et al. Validation of methods for oropha-ryngeal cancer HPV status determination in US cooperative group trials. Am J Surg Pathol 2012; 36: 945-54.
16. Castellsagué X, Alemany L, Quer M, et al. HPV involvement in head and neck cancers: comprehensive assessment of bio-markers in 3680 patients. J Natl Cancer Inst 2016 January 28 (Epub ahead of print).
.com. November 21, 2013 (http://www .freepatentsonline .com/ 20130309250 .pdf).
18.O’Brien PC, Fleming TR. A multiple testing procedure for clinical trials. Bio-metrics 1979; 35: 549-56.
19.Klein JP, Moeschberger ML. Survival analysis: techniques for censored and trun-cated data. New York: Springer-Verlag, 1997.
20.Pickard AS, Neary MP, Cella D. Esti-mation of minimally important differ-ences in EQ-5D utility and VAS scores in cancer. Health Qual Life Outcomes 2007; 5: 70.
21. Osoba D, Rodrigues G, Myles J, Zee B,
Pater J. Interpreting the significance of changes in health-related quality-of-life scores. J Clin Oncol 1998; 16: 139-44.
22. Bottomley A, Tridello G, Coens C, et al. An international phase 3 trial in head and neck cancer: quality of life and symptom results: EORTC 24954 on behalf of the EORTC Head and Neck and the EORTC Radiation Oncology Group. Cancer 2014; 120: 390-8.
23. Allison PD. Survival analysis using SAS: a practical guide. Cary, NC: SAS Institute, 1995.
24. Seiwert TY, Burtness B, Mehra R, et al. Safety and clinical activity of
pembroli-zumab for treatment of recurrent or meta-static squamous cell carcinoma of the head and neck (KEYNOTE-012): an open-label, multicentre, phase 1b trial. Lancet Oncol 2016; 17: 956-65.
25. Mehra R, Seiwert TY, Mahipal A, et al. Efficacy and safety of pembrolizumab in recurrent/metastatic head and neck squa-mous cell carcinoma (R/M HNSCC): pooled analyses after long-term follow-up in KEYNOTE-012. Presented at the Ameri-can Society of Clinical Oncology Annual Meeting, Chicago, June 3–7, 2016. ab-stract.