International Journal of Educational Methodology
Volume 5, Issue 3, 375 - 385.
ISSN: 2469-9632 http://www.ijem.com/
Greek Pre-Service Primary Teachers’ Efficacy Beliefs in Science and
Mathematics Teaching: Initial Adaptation of the STEBI-B and MTEBI
Instruments
Athina Koutsianou*
University of Ioannina, GREECE University of Ioannina, GREECE Anastassios Emvalotis
Received: June 25, 2019 ▪ Revised: July 25, 2019 ▪ Accepted: July 28, 2019
Abstract: Contemporary educational reforms, both in the fields of science and mathematics, highlight the importance of pre-service teachers’ preparation with regard to several meaningful standards. However, teachers’ own self-confidence in science and mathematics teaching are likely to influence their efforts. Framed within a growing body of research focusing on pre-service teachers’ efficacy beliefs in science and mathematics teaching, the present study attempts to investigate Greek pre-service primary teachers’ efficacy beliefs in science and mathematics teaching; and further examine whether there is a relationship between the two. Participants comprised 171 pre-service primary teachers, who were in their second (n = 55), third (n = 64) or fourth year (n = 52) of study and the majority were female (n = 148). Pre-service teachers were asked to complete a questionnaire consisting of the Science Teaching Efficacy Belief Instrument - Form B (STEBI-B) and the Mathematics Teaching Efficacy Belief Instrument (MTEBI). Principal component analyses and reliability analyses were performed for both instruments to examine their adaptation into Greek. According to the results, preservice teachers had medium to high scores in the personal efficacy and outcome expectancy scales, for both science and mathematics teaching. Minor differences in pre-service teachers’ scores were detected according to their year of study. Furthermore, pre-service teachers’ efficacy beliefs in science were strongly correlated with their efficacy beliefs in mathematics. In general, although pre-service teachers appeared to be confident and well-prepared to teach science and mathematics in classrooms, more effort is required to put the international education reform standards into practice.
Keywords: Self-efficacy beliefs, outcome expectancy, pre-service primary teachers, STEBI-B, MTEBI.
To cite this article: Koutsianou, A., & Emvalotis, A. (2019). Greek pre-service primary teachers’ efficacy beliefs in science and mathematics teaching: Initial adaptation of the STEBI-B and MTEBI instruments. International Journal of Educational Methodology,
5(3), 375-385. https://doi.org/10.12973/ijem.5.3.375
Introduction
Contemporary education reform efforts have consistently called for higher quality science and mathematics teaching in primary schools, underlining the importance of pre-service teachers’ preparation during their studies (NCTM, 1991, 2000, 2014; NGSS Lead States, 2013; NRC, 1996, 2012). In accordance with these reform efforts, teachers are asked to implement innovative teaching practices which will enable students to develop critical thinking and problem-solving skills (e.g. by facilitating students to conduct their own inquiries in order to learn scientific and/or mathematical ideas/concepts). Given that teachers’ efficacy beliefs, and especially their self-efficacy beliefs, are considered to be an important internal factor that could reduce their effectiveness in teaching, and subsequently undermine student learning, researchers have focused on exploring and improving pre-service teachers’ efficacy beliefs during their university studies (Blonder, Benny, & Jones, 2014; Brand & Wilkins, 2007; Knaggs & Sondergeld, 2015; Menon & Sadler, 2017; Moseley & Utley, 2006; Swars, Daane, & Giesen, 2006).
A well-known instrument for investigating pre-service teachers’ efficacy beliefs in science teaching is the Science Teaching Efficacy Belief Instrument – Form B (STEBI-B) (Enochs & Riggs, 1990), consisting of two scales: the Personal Science Teaching Efficacy Belief Scale (PSTE) and the Science Teaching Outcome Expectancy Scale (STOE). Following the STEBI-B, the Mathematics Teaching Efficacy Belief Instrument (MTEBI) (Enochs, Smith, & Huinker, 2000) was developed to measure pre-service teachers’ efficacy beliefs in mathematics teaching. Although other instruments have been also developed, both the STEBI-B and MTEBI are frequently employed in the literature since they appear to provide valid and reliable data for these complex constructs (Deehan, 2017; Shroyer, Riggs, & Enochs, 2014).
* Corresponding author:
Athina Koutsianou, Department of Primary Education, University of Ioannina, Ioannina, Greece, 45110. akoutsia@cc.uoi.gr
In Greece, the relevant research is rather limited, focusing mainly on modifications of the instrument to measure teachers’ self-efficacy beliefs in biology and environmental sciences teaching (Malandrakis, 2017; Mavrikaki & Athanasiou, 2011); however, no relevant research has been detected using the MTEBI to examine Greek pre-service teachers’ efficacy beliefs in mathematics teaching. By adapting both the STEBI-B and MTEBI instruments into the Greek language and by examining their psychometric properties, this study contributes to the existing literature and aims to address this gap.
Theoretical Background
According to the international literature (Fives & Buehl, 2012; Fives & Gill, 2015), teachers’ beliefs play an important role in their teaching practices and consequently in student learning; although the relationship between teachers’ beliefs and practices is more complicated than it seems. Pajares (1992) referred to the difficulty in studying teachers’ beliefs due to definition problems, poor conceptualisations and different uses of this construct in the literature. Nowadays, the definition of the term “beliefs” still constitutes a challenge for educational researchers and the use of this term is inconsistent across and within different educational research fields (Fives & Buehl, 2012; Fives & Gill, 2015).
The most commonly-used definition in the literature, however, remains that of Pajares (1992), who claimed that belief can be conceptualised as “an individual’s judgment of the truth or falsity of a proposition, a judgment that can only be inferred from a collective understanding of what human beings say, intend, and do” (p. 316). Taking into consideration the existing definitions and the different uses of this term, Fives and Buehl (2012) conducted a systematic literature review and concluded that “beliefs are best understood as integrated systems” (p. 477); which potentially function as: a) filters of information and experiences; b) frames for problem-solving; or c) guides or standards for intention and action (pp. 478-480).
Ultimately, teachers’ efficacy beliefs may affect the types of learning environments they form and the level of academic progress their students achieve (Bandura, 1997; Blonder et al., 2014; Enochs & Riggs, 1990; Enochs et al., 2000; Kahle, 2008). Over the past three decades, pre-service and in-service teachers’ efficacy beliefs have been examined, mainly based on Bandura’s theory of self-efficacy. According to Bandura (1977, 1993, 1997), two types of beliefs can motivate one’s behaviour: a) self-efficacy beliefs, i.e. “beliefs in one’s capabilities to organise and execute the courses of action required to produce given attainments” (Bandura, 1997, p. 3); and b) outcome expectancy beliefs, i.e. one’s beliefs that “a given behaviour will lead to certain outcomes” (Bandura, 1977, p. 193). In research with regard to teachers, both self-efficacy and outcome expectancy beliefs appear to influence their motivation and the way they choose to behave and teach in the classroom. Specifically,
“…teachers who believe student learning can be influenced by effective teaching (outcome expectancy beliefs) and who also have confidence in their own teaching abilities (self-efficacy beliefs) should persist longer, provide a greater academic focus in the classroom, and exhibit different types of feedback than teachers who have lower expectations concerning their ability to influence student learning.” (Gibson & Dembo, 1984, p. 570, as cited in Moseley & Utley, 2006, p. 2)
Additionally, it has been shown that efficacy beliefs depend on the situation or context relative to the action or task to be performed; thus, teaching efficacy beliefs are likely to vary according to different subject areas (e.g. language and mathematics teaching) (Bandura, 1997; Enochs & Riggs, 1990; Swars et al., 2006; Utley, Moseley, & Bryant, 2005). Internationally, there is a growing body of research focusing on teachers’ efficacy beliefs in science and mathematics teaching, potentially due to the difficulties that primary teachers face in teaching these subjects effectively (Brand & Wilkins, 2007; Kahle, 2008; Menon & Sadler, 2017; Mulholland, Dorman, & Odgers, 2004).
Previous research has found that pre-service teachers’ efficacy beliefs about science and mathematics teaching can be affected by a number of different factors, including: past experiences with science and mathematics; anxiety about science and mathematics; and self-efficacy beliefs in science and mathematics (Bates, Latham, & Kim, 2011; Bleicher, 2007; Kahle, 2008; Knaggs & Sondergeld, 2015; Swars et al., 2006). Furthermore, as pre-service teachers progress through the years of their university studies, factors such as their experiences of participating in university courses and/or in student teaching practice can influence their teaching efficacy beliefs (Brand & Wilkins, 2007; Menon & Sadler, 2017; Moseley & Utley, 2006; Mulholland et al., 2004).
Taking into consideration the importance of understanding pre-service teachers’ beliefs about their efficacy in science and mathematics teaching at the beginning of their teaching career, this study contributes to the growing body of knowledge through the perspective of Greek pre-service primary teachers.
Research Aim and Questions
1. How confident are Greek pre-service primary teachers with science teaching? 2. How confident are Greek pre-service primary teachers with mathematics teaching?
3. Do teachers’ efficacy beliefs in science teaching differ according to their gender and year of study? 4. Do teachers’ efficacy beliefs in mathematics teaching differ according to their gender and year of
study?
5. Is there a relationship between teachers’ efficacy beliefs in science and mathematics teaching?
Method
Participants
The participants of the present study were 171 pre-service primary teachers from a university in western Greece and the overwhelming majority of them were female (n = 148). Fifty-five pre-service teachers were in the second year, 64 were in the third year and 52 were in the fourth (final) year of their studies. Through their four-year studies, pre-service primary teachers are prepared to teach most of the subjects in primary schools in Greece, such as reading, history, mathematics and science; and they are aiming at students aged seven to 12 years old. Since the purpose of the present study is to provide useful information regarding the research questions rather than to generalise the findings, convenience sampling was adopted (Creswell, 2015).
Instruments
STEBI-B. Pre-service teachers’ efficacy beliefs in science teaching were measured using the STEBI-B instrument
developed by Enochs and Riggs (1990). The STEBI-B is a 23-item self-report measure and consists of two scales: the Personal Science Teaching Efficacy Belief Scale (PSTE) which contains 13 items; and the Science Teaching Outcome Expectancy Scale (STOE) which contains 10 items. Pre-service teachers are required to indicate the degree to which they agree or disagree with each statement, using a five-point Likert scale that ranges from 1 = “strongly disagree” to 5 = “strongly agree”. Ten reverse-score items are included in the STEBI-B (items 3, 6, 8, 10, 13, 17, 19, 20, 21, 23). For each scale, total scores are calculated by summing up the scores across the items. In the PSTE, scores range from 13 to 65 and higher scores indicate higher personal teaching efficacy beliefs in science; in the STOE, scores range from 10 to 50 and higher scores indicate a higher science teaching outcome expectancy. In general, the STEBI-B has demonstrated good construct validity and internal consistency in the relevant literature (Bleicher, 2004; Enochs & Riggs, 1990). In the present study, the psychometric properties of the Greek STEBI-B were examined and these are described in the Results section.
MTEBI. Pre-service teachers’ efficacy beliefs in mathematics teaching were assessed using the MTEBI instrument
developed by Enochs et al. (2000). In fact, the MTEBI is a modification of the STEBI-B focusing on mathematics teaching and consists of 21 items which are separated into two scales: the Personal Mathematics Teaching Efficacy Belief Scale (PMTE) which contains 13 items; and the Mathematics Teaching Outcome Expectancy Scale (MTOE) which contains 8 items. In accordance with the STEBI-B, pre-service teachers are asked to indicate the degree to which they agree or disagree with each statement, using a five-point Likert scale that ranges from 1 = “strongly disagree” to 5 = “strongly agree”. In the MTEBI, there are eight reverse-score items (items 3, 6, 8, 15, 17, 18, 19, 21). For each scale, total scores are calculated by summing up the scores across the items. In the PMTE, scores range from 13 to 65 and higher scores indicate higher personal teaching efficacy beliefs in mathematics; in the MTOE, scores range from 8 to 40 and higher scores indicate a higher mathematics teaching outcome expectancy. According to the existing literature, the MTEBI has demonstrated good construct validity and internal consistency (Enochs et al., 2000; Matney, Jackson, & Panarach, 2016). In the present study, the psychometric properties of the Greek MTEBI were examined and these are described in the Results section.
Procedures and Data Analysis
The present study was conducted at the beginning of the academic year 2016-2017. Both the STEBI-B and MTEBI were first translated into Greek by the authors and back-translated by a bilingual PhD candidate; then further modified to improve clarity in the wording of some of the items. Subsequently, a questionnaire, consisting of both instruments and two demographic questions regarding pre-service teachers’ gender and year of their studies, was administered to the participants. It is noted that participation in the study was voluntary and each participant received a unique identification number to maintain anonymity.
indicating good internal consistency; and item-total correlation values greater than .30 were required in order to have at least moderate correlation between each item and the overall factor. Based on the results of the PCAs and reliability analyses, initial versions of the Greek STEBI-B and MTEBI were developed and these are described in detail in the Results section.
In the present study, the total scores of the Greek PSTE, STOE, PMTE and MTOE scales were calculated by averaging the scores across the relevant items. Subsequently, a number of descriptive and bivariate analyses were performed to address the research questions of this study. Specifically, non-parametric tests were chosen to examine any potential differences in each of the four scales regarding teachers’ gender and year of study, since the assumption of normality was not satisfied (Creswell, 2015; Field, 2013; Mayers, 2013). Instead of one-way ANOVA and independent t-tests, Kruskal-Wallis and Mann-Whitney tests were performed. In addition, non-parametric tests using Spearman’s correlation coefficient were conducted to examine any potential relationships between the Greek PSTE, STOE, PMTE, and MTOE scales.
Results
PCA and Reliability Analysis of the STEBI-B
A PCA was conducted on the 23 items of the STEBI-B with Varimax orthogonal rotation. Based on the theory behind the development of the STEBI-B and previous factor analyses (Bleicher, 2004; Enochs & Riggs, 1990), two factors were requested. The Kaiser-Meyer-Olkin measure verified the sampling adequacy for the analysis, KMO = .73. In combination, these two factors explained 27.72% of the variance. Table 1 shows the factor loadings of the 23 items after rotation; the items were ordered according to their factor loadings (from highest to lowest) and grouped according to each factor (i.e. the PSTE and STOE scales). PCA results showed that four items from the PSTE scale (items 8, 17, 20 and 22) and two items from the STOE scale (items 10 and 13) had factor loadings lower than .40.
Table 1. PCA and reliability analysis results of the 23-item STEBI-B (n = 171)
Subscale Item Positive-Negative Wording
Corrected Item-Total
Correlation Loading 1 Factor Loading 2 Factor
Personal Science Teaching Efficacy Belief Scale (PSTE)
21 N .53 .68 −.12
18 P .51 .64 −.09
6 N .51 .63 −.13
12 P .47 .63 .11
23 N .46 .57 −.05
19 N .39 .57 −.18
3 N .41 .56 .04
2 P .35 .46 .26
5 P .26 .40 .24
20 N .27 .37 .19
17 N .27 .35 −.12
22 P .22 .27 −.01
8 N .13 .22 −.35
Eigenvalue = 3.67 % of variance = 15.94 Cronbach’s α = .73
Science Teaching Outcome Expectancy Scale (STOE)
15 P .46 .19 .68
14 P .44 .09 .63
7 P .36 −.20 .54
4 P .35 −.03 .52
1 P .34 −.16 .50
11 P .32 .01 .49
16 P .21 −.04 .42
9 P .29 .30 .40
10 N .19 .14 .30
13 N .05 .28 .05
Eigenvalue = 2.71 % of variance = 11.78 Cronbach’s α = .62
Note: Items in bold indicate highest factor loadings.
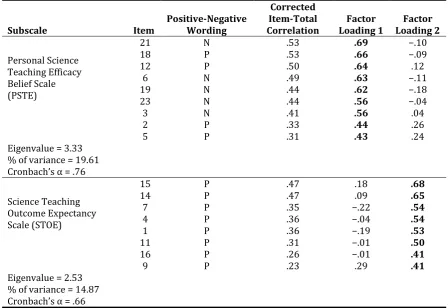
of five items (items 5, 8, 17, 20 and 22) were lower than .30. However, the STOE scale showed moderate internal consistency (α = .62) and the item-total correlations of four items (items 9, 10, 13 and 16) were also lower than .30. Both the PCA and reliability analysis results indicated that some items in the Greek STEBI-B may have to be dropped in order to improve the psychometric properties of the instrument. Thus, the items which failed to load on the expected factor and at the same time demonstrated low correlation with this factor (i.e. items 8, 17, 20 and 22 for the PSTE scale; and items 10 and 13 for the STOE scale) were excluded from the initial version of the Greek STEBI-B. PCA and reliability analysis were repeated with the 17-item Greek STEBI-B, demonstrating small improvements in the values of KMO, factor loadings, item-total correlations and Cronbach’s alpha (see Table 2).
Table 2. PCA and reliability analysis results of the 17-item Greek STEBI-B (n = 171)
Subscale Item Positive-Negative Wording
Corrected Item-Total
Correlation Loading 1 Factor Loading 2 Factor
Personal Science Teaching Efficacy Belief Scale (PSTE)
21 N .53 .69 −.10
18 P .53 .66 −.09
12 P .50 .64 .12
6 N .49 .63 −.11
19 N .44 .62 −.18
23 N .44 .56 −.04
3 N .41 .56 .04
2 P .33 .44 .26
5 P .31 .43 .24
Eigenvalue = 3.33 % of variance = 19.61 Cronbach’s α = .76
Science Teaching Outcome Expectancy Scale (STOE)
15 P .47 .18 .68
14 P .47 .09 .65
7 P .35 −.22 .54
4 P .36 −.04 .54
1 P .36 −.19 .53
11 P .31 −.01 .50
16 P .26 −.01 .41
9 P .23 .29 .41
Eigenvalue = 2.53 % of variance = 14.87 Cronbach’s α = .66
Note: Items in bold indicate highest factor loadings.
Descriptive and Bivariate Analysis for the PSTE and STOE Scales of the STEBI-B
The mean for the PSTE scale was 3.66 (SD = .48) and the mean for the STOE scale was 3.50 (SD = .41), indicating that pre-service teachers had medium to high scores both in personal efficacy and outcome expectancy scales for science teaching.
Mann-Whitney tests were conducted on the PSTE and STOE scales to examine potential differences according to pre-service teachers’ gender. The results of the analyses revealed no significant differences between male and female teachers regarding: the PSTE scale, U = 1138.50, z = −.25, p = .800, r = −.03; and the STOE scale, U = 1103.50, z = −.45, p = .654, r = −.03.
Table 3 shows the means and standard deviations of the PSTE and STOE scales according to teachers’ gender, year of study and total. Table 4 shows the mean ranks of the PSTE and STOE scales according to teacher’s gender and year of study.
Table 3. Means (and standard deviations) of the PSTE, STOE, PMTE and MTOE scales in different groups according to pre-service teachers’ gender and year of studies
Groups PSTE STOE PMTE MTOE
Male (n = 16) 3.64 (.64) 3.52 (.46) 3.81 (.59) 3.37 (.39)
Female (n = 148) 3.67 (.46) 3.49 (.40) 3.70 (.48) 3.38 (.49)
Teachers in the 2nd year of studies (n = 55) 3.52 (.37) 3.55 (.44) 3.65 (.38) 3.51 (.44) Teachers in the 3rd year of studies (n = 64) 3.67 (.50) 3.43 (.39) 3.70 (.52) 3.26 (.50) Teachers in the 4th year of studies (n = 52) 3.81 (.50) 3.53 (.40) 3.77 (.58) 3.40 (.49)
Total (n = 171) 3.66 (.48) 3.50 (.41) 3.70 (.50) 3.38 (.49)
Table 4. Mean ranks of the PSTE, STOE, PMTE and MTOE scales in different groups according to pre-service teachers’ gender and year of studies
Groups PSTE STOE PMTE MTOE
Male (n = 16) 79.66 87.53 92.47 80.22
Female (n = 148) 82.81 81.96 81.42 82.75
Teachers in the 2nd year of studies (n = 55) 67.06 94.15 76.15 101.16
Teachers in the 3rd year of studies (n = 64) 89.47 74.84 88.86 71.52
Teachers in the 4th year of studies (n = 52) 101.76 91.12 92.90 87.79
PCA and Reliability Analysis of the MTEBI
A PCA was conducted on the 21 items of the MTEBI with Varimax orthogonal rotation. Based on the literature regarding the development of the STEBI-B and MTEBI (Enochs & Riggs, 1990; Enochs et al., 2000; Matney et al., 2016), two factors were also requested. The Kaiser-Meyer-Olkin measure verified the sampling adequacy for the analysis, KMO = .80. In combination, these two factors explained 35.59% of the variance. Table 5 shows the factor loadings of the 21 items after rotation; the items were ordered according to their factor loadings (from highest to lowest) and grouped according to each factor (i.e. the PMTE and MTOE scales). PCA results showed that item 8 of the PMTE scale and item 9 of the MTOE scale had factor loadings lower than .40.
In addition, Cronbach’s alpha and corrected item-total correlations for each scale were calculated (see Table 5). According to the results, both PMTE and MTOE scales showed good internal consistency with a Cronbach’s alpha of .81 and .73, respectively. However, the item-total correlations of the aforementioned items (8 and 9) were lower than .30, raising doubts about their inclusion in the instrument.
Table 5. PCA and reliability analysis results of the 21-item MTEBI (n = 171)
Subscale Item Positive-Negative Wording
Corrected Item-Total
Correlation Loading 1 Factor Loading 2 Factor
Personal Mathematics Teaching Efficacy (PMTE)
19 N .69 .77 −.10
3 N .63 .72 −.06
21 N .59 .68 −.18
6 N .54 .64 −.08
16 P .48 .57 −.03
15 N .46 .57 −.13
17 N .46 .55 −.22
20 P .45 .53 −.10
11 P .40 .53 .12
18 N .36 .49 .10
2 P .37 .48 .25
5 P .38 .46 .02
8 N .18 .23 −.21
Table 5. Continued
Subscale Item Positive-Negative Wording
Corrected Item-Total
Correlation Loading 1 Factor Loading 2 Factor
Mathematics Teaching Outcome Expectancy (MTOE)
1 P .56 −.10 .70
10 P .48 .04 .66
13 P .48 .02 .63
4 P .45 −.05 .63
12 P .46 .23 .60
14 P .32 −.11 .50
7 P .32 −.25 .48
9 P .21 .39 .35
Eigenvalue = 2.94 % of variance = 13.98 Cronbach’s α = .73
Note: Items in bold indicate highest factor loadings.
Taking into consideration the results of the PCA and reliability analysis, items 8 and 9 were excluded from this first version of the Greek MTEBI. The PCA and reliability analysis were repeated with the 19-item Greek MTEBI without demonstrating any meaningful changes in the values of KMO, factor loadings, item-total correlations or Cronbach’s alpha (see Table 6).
Table 6. PCA and reliability analysis results of the 19-item Greek MTEBI (n = 171)
Subscale Item Positive-Negative Wording
Corrected Item-Total
Correlation Loading 1 Factor Loading 2 Factor
Personal Mathematics Teaching Efficacy (PMTE)
19 N .68 .77 −.11
3 N .64 .73 −.06
21 N .59 .68 −.18
6 N .55 .65 −.08
15 N .48 .57 −.14
16 P .47 .56 −.01
17 N .44 .55 −.21
20 P .45 .54 −.09
11 P .42 .53 .11
18 N .38 .49 .10
2 P .37 .48 .25
5 P .38 .48 .05
Eigenvalue = 4.37 % of variance = 23.01 Cronbach’s α = .83
Mathematics Teaching Outcome Expectancy (MTOE)
1 P .56 −.10 .72
10 P .47 .04 .67
4 P .46 −.04 .64
13 P .46 .01 .61
12 P .43 .23 .59
14 P .35 −.09 .53
7 P .34 −.24 .49
Eigenvalue = 2.82 % of variance = 14.86 Cronbach’s α = .73
Note: Items in bold indicate highest factor loadings
Descriptive and Bivariate Analysis for the PMTE and MTOE Scales of the MTEBI
The mean for the PMTE scale was 3.70 (SD = .50) and the mean for the MTOE scale was 3.38 (SD = .49), indicating that pre-service teachers had medium to high scores both in personal efficacy and outcome expectancy scales for mathematics teaching.
and female teachers regarding the: PMTE scale, U = 1024.50, z = −.89, p = .375, r = −.10; and the MTOE scale, U = 1147.50, z = −.20, p = .839, r = −.01.
In addition, Kruskal-Wallis tests were conducted on the PΜTE and ΜTOE scales to examine any potential differences between the three groups of pre-service teachers according to their year of study. The results of the analyses revealed no significant differences between the three groups of teachers for the PMTE scale, H(2) = 3.42, p = .181; however, there were significant differences between the three groups of teachers for the MTOE scale, H(2) = 10.81, p = .005. Regarding the MTOE scale, pairwise comparisons were conducted with adjusted p-values (p = .017), indicating that: a) teachers in their 2nd year of study had significantly higher scores than teachers in their 3rd year of study, U = 1160.00, z = −3.21, p < .001, r = .26; b) there were no significant differences between teachers in their 3rd year and teachers in their 4th year of study, U = 1337.00, z = −1.82, p = .068, r = −.14; and c) there were no significant differences between teachers in their 2nd year and teachers in their 4th year of study, U = 1196.00, z = −1.47, p = .142, r = .12.
Again, the means, standard deviations and mean ranks of the PMTE and MTOE scales, according to teachers’ gender, year of study and total, can be seen in Tables 3 and 4.
Relationships between PSTE, STOE, PMTE and MTOE Scales
A Spearman’s correlation coefficient was used to examine potential relationships between the Greek PSTE, STOE, PMTE, and MTOE scales. According to the results of the non-parametric correlational analysis (see Table 7), there was no significant relationship between the two scales of the STEBI-B (PSTE and STOE) and MTEBI (PMTE and MTOE), (ps > .05). However, there was a significant, strong relationship between the PSTE and PMTE scales, as well as between the STOE and MTOE scales (ps < .001).
Table 7. Intercorrelations for Greek PSTE, STOE, PMTE and MTOE scales
Scale 1 2 3 4
1. PSTE ꟷ
2. STOE −.01 ꟷ
3. PMTE .75*** −.03 ꟷ
4. MTOE −.09 .80*** −.13 ꟷ
***p < .001
Discussion
Initial Versions of the STEBI-B and MTEBI Instruments in Greek
A large number of studies worldwide have administered the STEBI-B and/or MTEBI, demonstrating that these instruments can provide valid and reliable data regarding the constructs of pre-service teachers’ personal efficacy and outcome expectancy in science and mathematics teaching (Bates et al., 2011; Bautista & Boone, 2015; Bleicher, 2007; Finson, 2001; Knaggs & Sondergeld, 2015; Menon & Sadler, 2017; Moseley & Utley, 2006; Swars et al., 2006). Likewise, the present study attempts to examine Greek pre-service primary teachers’ efficacy beliefs in science and mathematics teaching, using the STEBI-B and MTEBI instruments. The initial Greek language versions of the STEBI-B and MTEBI instruments were discussed in the Results section, underlining the necessity for further revisions.
Specifically, the initial version of the Greek STEBI-B consists of two scales: the 9-item Personal Science Teaching Efficacy Belief Scale and the 8-item Science Teaching Outcome Expectancy Scale. Although the expected general structure of the two scales was evident, some items had low values, both in factor loadings and item-total correlations. Thus, a total of five items were excluded from the Greek STEBI-B to improve its psychometric properties. The excluded items appeared to trouble a large number of pre-service teachers, based on their responses, suggesting the need for further modification in the wording of items in order to avoid their exclusion from the Greek STEBI-B. For example, the word “ineffective” (item 8) was found not to be understandable by many teachers, taking into account their different responses to other items with a similar meaning (e.g. item 6).
In accordance with other studies (Bleicher, 2004, 2007; Deehan, 2017; Enochs & Riggs, 1990), the PSTE scale demonstrated better internal consistency than the STOE scale in this study. Furthermore, given that the Cronbach’s alpha value of the STOE scale was rather low (α = .66), doubts arose as to whether Greek pre-service teachers are experienced enough to recognise the effects of their teaching on student learning and respond to the STOE items appropriately (see also Deehan, 2017; Menon & Sadler, 2017; Mulholland et al., 2004).
Overall, it is apparent that the psychometric properties of the Greek MTEBI were better than those of the Greek STEBI-B, potentially due to the differential way that pre-service teachers view the two subject areas. However, this assumption should be further examined.
Greek Pre-service Primary Teachers’ Efficacy Beliefs in Science and Mathematics Teaching
In the present study, Greek pre-service primary teachers had medium to high scores in personal efficacy and outcome expectancy, both for science and mathematics teaching, resembling the findings of the extant literature (Bates et al., 2011; Bleicher, 2004; Matney et al., 2016; Mulholland et al., 2004; Utley et al., 2005). In fact, pre-service teachers’ scores in personal efficacy were found to be greater than their scores in outcome expectancy, both for science and mathematics teaching, revealing that even if they feel confident in their own abilities, they may have doubts about the effectiveness of their teaching on student outcomes (Deehan, 2017; Shroyer et al., 2014). These findings are rather encouraging, considering that overestimated teaching efficacy beliefs could be detrimental for pre-service and novice teachers, since there is a risk of establishing over-ambitious and challenging goals (see the review by Siwatu & Chesnut, 2015).
Furthermore, in accordance with previous research, there was a significant, strong relationship between personal efficacy in science teaching and personal efficacy in mathematics teaching (Bursal, 2010; Bursal & Paznokas 2006; Utley et al., 2005); as well as between science teaching outcome expectancy and mathematics teaching outcome expectancy (Utley et al., 2005). The aforementioned relationships could be attributed to the similar nature of these subjects or the frequent use of mathematics as a tool in science education (Bursal, 2010; Bursal & Paznokas 2006; Utley et al., 2005). Additionally, there were no significant differences in pre-service teachers’ scores according to their gender for any scale (Mulholland et al., 2004); though this finding should be interpreted with caution, as female pre-service teachers significantly outnumbered the male ones. On the other hand, minor differences in pre-service teachers’ scores were detected according to their year of study.
Specifically, pre-service teachers in their second year of study were less confident in their own abilities to effectively teach science than their counterparts in the third and fourth year. According to the relevant literature (Bleicher, 2004; Menon & Sadler, 2017; Mulholland et al., 2004; Shroyer et al., 2014), the number of university science courses that pre-service teachers had attended could be one reason for these differences in scores. Moreover, pre-pre-service teachers in their third year of studies were less confident about the effects of mathematics teaching on student outcomes than their counterparts in the second year. A potential interpretation of this finding could be that as pre-service teachers progress in their studies, their optimism may decrease, especially when they are confronted with actual teaching at the school (e.g. during their student teaching practice) (Utley et al., 2006).
Limitations and Suggestions
It is important to note that the results of the present study should be interpreted with caution, in light of some limitations. Firstly, the results of the present study cannot be generalised due to the convenience sampling which was adopted. In this respect, the study should be repeated with a new more representative sample of Greek primary pre-service teachers. Also, the adaptation of the STEBI-B and MTEBI instruments into Greek constituted an initial attempt and further revisions are needed to result in the final versions. In fact, confirmatory factor analyses should be performed with a new sample to examine the instruments’ adaptation into the Greek language. Furthermore, future research is suggested to investigate both Greek pre-service and in-service teachers’ efficacy beliefs in science and mathematics teaching. It would be very interesting to explore whether teaching efficacy beliefs change when pre-service teachers complete their studies and become in-pre-service teachers.
Conclusions
The present study contributes to the existing literature by providing preliminary data regarding the Greek adaptation of two well-known instruments for investigating pre-service teachers’ efficacy beliefs in science and mathematics teaching, the STEBI-B and MTEBI. For the purpose of this study, initial versions of both these instruments have been developed; however, it is necessary to revise these versions and re-administer the questionnaires to a new sample of Greek pre-service primary teachers in order to determine their final form. Furthermore, this study provides useful insights of how confident Greek pre-service primary school teachers are to teach science and mathematics while they are still studying at the university.
2017). Furthermore, it is necessary for pre-service teachers to have the appropriate opportunities during their studies to combine theory with practice and put innovative teaching practices into action.
References
Bandura, A. (1977). Self-efficacy: Toward a unifying theory of behavioral change. Psychological review, 84(2), 191-215. doi: 10.1037/0033-295X.84.2.191
Bandura, A. (1993). Perceived self-efficacy in cognitive development and functioning. Educational psychologist, 28(2), 117-148.
Bandura, A. (1997). Self-efficacy: The exercise of control. New York: W.H. Freeman and Company.
Bates, A. B., Latham, N., & Kim, J.-a. (2011). Linking preservice teachers' mathematics self-efficacy and mathematics teaching efficacy to their mathematical performance. School Science and Mathematics, 111(7), 325-333. doi: 10.1111/j.1949-8594.2011.00095.x
Bautista, N. U., & Boone, W. J. (2015). Exploring the impact of TeachME™ lab virtual classroom teaching simulation on early childhood education majors’ self-efficacy beliefs. Journal of Science Teacher Education, 26(3), 237-262. doi: 10.1007/s10972-014-9418-8
Bleicher, R. E. (2004). Revisiting the STEBI-B: measuring self-efficacy in preservice elementary teachers. School Science
and Mathematics, 104(8), 383-391. doi: 10.1111/j.1949-8594.2004.tb18004.x
Bleicher, R. E. (2007). Nurturing confidence in preservice elementary science teachers. Journal of Science Teacher
Education, 18(6), 841-860. doi: 10.1007/s10972-007-9067-2
Blonder, R., Benny, N., & Jones, M. G. (2014). Teaching self-efficacy of science teachers. In R. Evans, J. Luft, C. Czerniak & C. Pea (Eds.), The role of science teachers’ beliefs in international classrooms: From teacher actions to student
learning (pp. 3-15). Rotterdam, The Netherlands: Sense Publishers.
Brand, B. R., & Wilkins, J. L. M. (2007). Using self-efficacy as a construct for evaluating science and mathematics methods courses. Journal of Science Teacher Education, 18(2), 297-317. doi: 10.1007/s10972-007-9038-7
Bursal, M. (2010). Turkish preservice elementary teachers’ self-efficacy beliefs regarding mathematics and science teaching. International Journal of Science and Mathematics Education, 8(4), 649-666. doi: 10.1007/s10763-009-9179-6
Bursal, M., & Paznokas, L. (2006). Mathematics anxiety and preservice elementary teachers' confidence to teach mathematics and science. School Science and Mathematics, 106(4), 173-180. doi: 10.1111/j.1949-8594.2006.tb18073.x
Creswell, J. W. (2015). Educational research: planning, conducting, and evaluating quantitative and qualitative research (5th ed.). Boston, MA: Pearson.
Deehan, J. (2017). A review of the Science Teaching Efficacy Belief Instrument B: Pre-service teachers. In J. Deehan, The Science Teaching Efficacy Belief Instruments (STEBI A and B): A comprehensive review of methods and findings from
25 years of science education research (pp. 7-43). Cham, Switzerland: Springer International Publishing.
Enochs, L. G., & Riggs, I. M. (1990). Further development of an elementary science teaching efficacy belief instrument: A preservice elementary scale. School Science and Mathematics, 90(8), 694-706. doi: 10.1111/j.1949-8594.1990.tb12048.x
Enochs, L. G., Smith, P. L., & Huinker, D. (2000). Establishing factorial validity of the Mathematics Teaching Efficacy Beliefs Instrument. School Science and Mathematics, 100(4), 194-202. doi: 10.1111/j.1949-8594.2000.tb17256.x Field, A. (2013). Discovering statistics using IBM SPSS statistics (4th ed.). Los Angeles, CA: SAGE Publications Ltd.
Finson, K. D. (2001). Investigating preservice elementary teachers' self-efficacy relative to self-image as a science teacher. Journal of Elementary Science Education, 13(1), 31-41.
Fives, H., & Buehl, M. (2012). Spring cleaning for the “messy” construct of teachers ’ beliefs: What are they? Which have been examined? What can they tell us? In K. Harris, S. Graham, T. Urdan, C., McCormick, G. Sinatra, & J. Sweller (Eds.), APA educational psychology handbook, Vol 1: Theories, constructs, and critical issues (pp. 471–499). Washington, DC: American Psychological Association. doi:10.1037/13273-008
Kahle, D. K. (2008). How elementary school teachers’ mathematical self-efficacy and mathematics teaching self-efficacy
relate to conceptually and procedurally oriented teaching practices (Unpublished doctoral dissertation). The Ohio
State University, Columbus, Ohio, USA.
Knaggs, C. M., & Sondergeld, T. A. (2015). Science as a learner and as a teacher: measuring science self-efficacy of elementary preservice teachers. School Science and Mathematics, 115(3), 117-128. doi: 10.1111/ssm.12110
Malandrakis, G. (2017). Influencing Greek pre-service teachers’ efficacy beliefs and self-confidence to implement the new ‘Studies for the Environment’ curricula. Environmental Education Research, 1-27. doi: 10.1080/13504622.2016.1272672
Matney, G., Jackson, J. L., & Panarach, Y. (2016). Establishing validity of the Thai Mathematics Teaching Efficacy Beliefs Instrument. School Science and Mathematics, 116(3), 164-172. doi: 10.1111/ssm.12165
Mavrikaki, E., & Athanasiou, K. (2011). Development and application of an instrument to measure Greek primary education teachers’ biology teaching self-efficacy beliefs. EURASIA Journal of Mathematics, Science and Technology
Education, 7(3), 203-213.
Mayers, A. (2013). Introduction on statistics and SPSS in Psychology. Harlow, UK: Pearson Education.
Menon, D., & Sadler, T. D. (2017). Sources of science teaching self-efficacy for preservice elementary teachers in science content courses. International Journal of Science and Mathematics Education, 1-21. doi: 10.1007/s10763-017-9813-7
Moseley, C., & Utley, J. (2006). The effect of an integrated science and mathematics content-based course on science and mathematics teaching efficacy of preservice elementary teachers. Journal of Elementary Science Education, 18(2), 1-12. doi: 10.1007/bf03174684
Mulholland, J., Dorman, J. P., & Odgers, B. M. (2004). Assessment of science teaching efficacy of preservice teachers in an
Australian university. Journal of Science Teacher Education, 15(4), 313-331. doi:
10.1023/b:jste.0000048334.44537.86
National Council of Teachers of Mathematics. (1991). Professional standards for teaching mathematics. Reston, VA: Author.
National Council of Teachers of Mathematics. (2000). Principles and standards for school mathematics. Reston, VA: Author.
National Council of Teachers of Mathematics. (2014). Principles to actions: Ensuring mathematical success for all. Reston, VA: Author.
National Research Council. (1996). National science education standards. Washington, DC: National Academy Press. National Research Council. (2012). A framework for K-12 science education: practices, crosscutting concepts, and core
ideas. Washington, DC: National Academy Press.
Next Generation Science Standards Lead States. (2013). Next Generation Science Standards: For states, by states. Washington, DC: National Academies Press.
Pajares, M. F. (1992). Teachers’ beliefs and educational research: cleaning up a messy construct. Review of Educational
Research, 62(3), 307-332. doi:10.3102/00346543062003307
Shroyer, G., Riggs, I., & Enochs, L. (2014). Measurement of science teachers’ efficacy beliefs. In R. Evans, J. Luft, C. Czerniak & C. Pea (Eds.), The role of science teachers’ beliefs in international classrooms: From teacher actions to
student learning (pp. 103-118). Rotterdam, The Netherlands: Sense Publishers.
Siwatu, K. O., & Chesnut, R. C. (2015). The career development of preservice and inservice teachers: Why teachers’ self-efficacy beliefs matter. In H. Fives, & M. G. Gill (Eds.), International handbook of research on teachers’ beliefs (pp. 212-229). New York, NY and Abingdon, UK: Routledge.
Swars, S. L., Daane, C. J., & Giesen, J. (2006). Mathematics anxiety and mathematics teacher efficacy: What is the relationship in elementary preservice teachers? School Science and Mathematics, 106(7), 306-315. doi: 10.1111/j.1949-8594.2006.tb17921.x