The Contamination of Essential and
Non-Essential Heavy Metals In Edible Vegetables
In The South of Ethiopia, Gamo Gofa
Province
Birhane Hidug Desta#1, Fisseha Guesh Gebremeskel*2
Department of Chemistry, College of Natural Sciences, Arba Minch University, Arba Minch, Ethiopia
Abstract
In this study, heavy metals pollution in edible vegetables was investigated from farms near Arba Minch south of Ethiopia. The most important heavy metals in vegetables are Cadmium (Cd), Copper (Cu), Lead (Pb) and Zinc (Zn). In this region, the concentrations of heavy metals in edible vegetables were evaluated. After sample preparation, concentrations of heavy metals in vegetables were determined by atomic absorption spectrometry (AAS). Four different edible vegetables from Arba Minch town i.e., Cabbage, Carrot, Potato, Tomato were sampled. The experimental results in the vegetables particularly the concentrations of Cd, Pb were above the permissible limit of heavy metals as compared to WHO guidelines.The highest and lowest values were as follows: Cd (0.032± 0.0005-0.088± 0.0008) ppm, Cu(1.240± 0.0122–2.480± 0.0959) ppm, Pb (0.235± 0.0025– 0.927± 0.0042) ppm, and Zn (1.541± 0.0029–4.430± 0.0031)ppm.In consequence, the results of this study indicate that could attribute to metals contamination to take place during pre-harvest and post-harvest process. Possible sources during pre-post-harvest include from soil type, fertilizers, pesticides, municipal wastewater and water used for irrigation, while post-harvest sources may include contamination through air pollution and during transport to the market or at the point of sale industrial waste water can cause pollution in well waters and edible vegetables. So, this region is not suitable for cultivation and growing vegetables.
Keywords: Heavy metals, environmental pollution, vegetables, dry ashing process, wet digestion process, Atomic Absorption Spectrometry.
I. Introduction
Food safety is a major public concern worldwide. During the last decades, the increasing demand for food safety has stimulated research regarding the risk associated with consumption of foodstuffs contaminated by pesticides, heavy metals and/or toxins. Food safety issues and potential health risks make this as one of the most serious environmental concerns. Heavy metal accumulation in plants depends upon plant species, and the efficiency of different plants in absorbing metals is evaluated by either plant uptake or soil to plant transfer factors of the metals. Vegetables constitute essential components of the diet, by contributing protein, vitamins, iron, calcium and other nutrients which are
and are particularly toxic. The excessive content of these metals in food is associated with etiology of a number of diseases, especially with cardiovascular, kidney, nervous as well as bone diseases. Other metals such as copper and zinc are essential for important biochemical and physiological functions and necessary for maintaining health throughout life, but if theses metals have excessive concentration above the WHO value, which cause a diseases (5). The health effect of these metals is less studied though a number of people are consuming vegetable day to day in its raw and sauce form that may result the accumulation of trace metals in human body. However, to the extent of assessment done, there is no literature report on the determination of the levels of heavy metals in Arba Minch, Ethiopian vegetables especially cabbage, carrot, potato, tomato. Hence, this research is intended to determine the concentration of trace metals (cadmium, copper, lead and zinc) in edible vegetables that are commonly grown in south of Ethiopia, GamoGofa province.
Heavy metal contamination of vegetables cannot be underestimated as these foodstuffs are important components of human diet. Vegetables are rich sources of vitamins, minerals, and fibers also have beneficial anti-oxidative effective However, intake of heavy metal contaminated vegetables may pose a risk to the human health [6].
Heavy metal contamination of the food items is one of the most important aspects of food quality assurance [7]. Rapid and unorganized urban and industrial developments have contributed to the elevated levels of heavy metals in the urban environments. Emissions of heavy metals from the industries and vehicles may be deposited on the vegetable surfaces during their production, transport and marketing.
The prolonged consumption of unsafe concentrations of heavy metals through foodstuffs may lead to the chronic accumulation of heavy metals in the kidney and liver of humans causing disruption of numerous biochemical processes, leading to cardiovascular, nervous, and kidney and bone diseases [8]. Some heavy metals such as Cu, Zn, Mn, Co and Mo act as micronutrients for the growth of animals and human beings when present in trace quantities, whereas others such as Cd, As, and Cr act as carcinogens [9]. The contamination of vegetables with heavy metals due to soil and atmospheric contamination poses a threat to its quality and safety. Regulations have been set up in many countries and for different industrial set up to control the emission of heavy metals. The uptake of heavy metals in vegetables are influenced by some factors such as climate, atmospheric depositions, the concentrations of heavy metals in soil, the nature of soil on which the vegetables are grown and the degree of maturity of the plants at the time of harvest [10].
The main objective of the present work is to focus on biomonitoring contamination of heavy metals in different vegetables and to establish some recommendations on human diet foodstuff in order to assure a significant improvement in food safety.
A. Objectives of the study
1) General Objective:To determine the level of some selected essential and non-essential heavy metals in commercially available vegetables at Arab Minch town, GamoGofa province.
2) Specific objectives: To determine the levels of some selected essential heavy metals in edible vegetables, to determine the levels of some selected non- essential heavy metals in edible vegetables, to review the sample preparation techniques and to review the quantification methods reported in the scientific literatures for these samples.
B. Statement of Problem
This study is carried out on different types of vegetables to evaluate their quality based on the content of heavy metals. Samples of four vegetables, namely, cabbage, carrot, potato, and tomato are taken from different farmlands and purchased from local markets. The criteria for the selecting the local vegetables is not seasonal.
C. Significance of the study
The analysis is conducted in order to fill the gap in addressing all the existing information from scientific reports on the level of essential and non-essential metals in commercially available vegetables at Arab Minch town, GamoGofa province. This study was expected to have the following outputs.It was enabling the other reviewers to aware of the determination of selected essential and non-essential heavy metals in vegetables; tocreate awareness to the concerning bodies the degree of contaminations of vegetables with heavy metals; andit serves as base line information for other reviewers and further studies.
II. Literature Review
A. Vegetables
TableI. Some common non-seasonal vegetables are described below
S.No. Binomial Name Scientific Name Usage
1 Cabbage Brassica oleracea Leaves, axillarybuds, stems, flowerheads
2 Carrot Daucuscarota Root tubers
3 Potato Solanumtuberosum Root tuber
4 Tomato Solanumlycopesicum Fruits
B. Essential and Non-Essential Metals
The metals required in living organisms are called as essential elements such as K, Mg, Ca, Mn, Fe, Co, Cu, Se and Zn and they are very important for growth and health, on the other hand, some non-essential toxic metals like Cd, Cr, Hg and Pb are toxic. Studies conducted originally, on human and animals show that optimal intake of elements such as sodium, potassium, Magnesium, Calcium, manganese, copper, Zinc and iodine could reduce individual risk factors, including those related to cardiovascular diseases. It is believed that the great majority of these trace elements act as key components of essential enzyme systems or other proteins. For instance, the hemo-protein hemoglobin, which performs vital biochemical functions.
All trace elements or metals are toxic if consumed at sufficiently high levels for long enough periods. For example, 0.1ppm of Se is beneficial while 10ppm may be carcinogenic. The difference between toxic intakes and optimal intakes to meet physiological needs for essential trace elements or metals is great for some elements but is much smaller for others [12].
3) Iron (Fe):Iron has its role in carrying oxygen as a critical component of the homoprotein, hemoglobin, myoglobin and the cytochromes and it is also a cofactor for some enzymes. Its deficiency causes anemia [13].
4) Manganese (Mn) : Manganese is an essential trace element [14] for a number of key enzymes including liver pyruvate carboxylase, arginase, and most notably mitochondrial or Mn dependent superoxide dismutase (MnSOD) one of the key antioxidant in the body. It is called the “maternal mineral” because manganese deficiency in females causes a reduced maternal carrying for her young [15].
5) Copper (Cu): Copper is a nutritionally essential element and is widely distributed in nature [10].Toxicity of copper doesn’t affect seriously the blood and kidneys [16].The deficiency of Cu is associated with increased risk of hypertension [17].
6) Zinc (Zn): Zinc is a cofactor of many enzymes, e.g. super oxide, dismutase, and they assist in the formation of anti-oxidative reactions. Its deficiency increases the risk of hypertension [12]. Deficiency of zinc causes inadequate growth, loss of appetite [18].
7) Cadmium (Cd): Cadmium is a toxic metal with sterilizing, teratogenic, and carcinogenic effect [19]. It may also lead to cardiovascular diseases. It is an inhibitor of enzymes with sulphydryl groups and disrupts the pathway for the oxidative metabolism [20]. Its toxicity affects many target tissues such as appetite and pain centers or in brain, brain, heart, blood vessels, kidneys, and lungs. This toxicity may cause anemia, dry and scaly skin, emphysema, fatigue, hair loss, heart disease, depressed immune system response, hypertension, joint pain, kidney stones or damage, liver dysfunction or damage, loss of appetite, loss of sense of smell, lung cancer, pain in the back and leg[21].
8) Lead (Pb):It is highly toxic to man and animals. Lead toxicity influences brain, heart, kidney, liver, nervous system, and pancreas. It may cause many signs and symptoms such as abdominal pain, anemia, anorexia, anxiety, bone pain, brain damage, confusion, constipation, convulsions, dizziness, drowsiness, fatigue, headaches and hypertension. It also diminishes IQ in children [22].
C. Sample Decomposition Techniques
organic compounds in air at atmospheric pressure and at relatively elevated temperatures (450-550 °C) in a muffle furnace. For tissues high in carbohydrate and oils the ashing aids may be required to achieve complete decomposition of organic matter. Water and other volatile materials are vaporized and organic substances are burned in the presence of air. The resulting ash residue is dissolved in an appropriate acid. The degree of volatilization loss is a limiting factor and depends on the applied temperature, the forms in which the analyte is present in the sample, and the chemical environment in the ashing stage. The useful features of dryashing technique are pre-concentration and digestion. In Pre-pre-concentration there is treatment of large amounts of sample and dissolution of the resulting ash in a small acid volume results in element pre-concentration. In digestion there is complete destruction of the organic matter, which is a prerequisite for some detection techniques, simplification of the sample matrix and the final solution condition as clearness, colorless and odorless. Application to a variety of complex samples, nevertheless dry ashing has some limitations. They are high temperature provokes volatilization losses of some elements, to avoid losses of volatile As, Cd, Hg, Pb and Se, and improve procedure efficiencyashing aids as high purity Mg (NO3)2 and MgO are used.Addition of ashing aids
significantly increases the content of inorganic salts which may be a problem in subsequent determinations of trace elements and contribute to contamination that necessitates careful blank control. It does not ensure dissolution of silicate compounds and consequently of all elements associated with them or it can be encountered during plant analysis after a procedure without elimination of Si by evaporation with HF, poor recoveries for some elements can be observed, particularly traces.Andopen dry ashing exposes samples to air
borne contamination [24].
Wetashing or wet digestion methods involve the use of both heat and mineral acids. Acids that have been used in this procedure include H2SO4, HNO3 and
HClO4 in either in combination or alone [25].
Hydrogen Peroxide is also used to enhance the reaction speed and to ensure complete digestion. Most laboratories have eliminated the use of HClO4due to risk of explosion. Wet digestion can be
carried out in open vessels, in tubes, on a hot plate or in an aluminum heating block or in closed vessels at elevated pressure or digestion bombs with thermal.Main features associated with wet digestion method are much lower temperatures as compared to dryashing procedures, however minimizing volatilization losses or retentions caused by reactions between analytes and vessel materials they may lead to incomplete solubilisationof sample constituents, and co-precipitation of analytes with precipitates
formed by main matrix elements within reactive mixtures.
III. Quantification Techniques of Essential and Non-Essential Heavy Metals in Vegetables
Elemental analysis of the majority of organic and inorganic matrices requires the partial or total dissolution of the sample prior to instrumental analysis.
A. Atomic Absorption Spectroscopy
Atomic Absorption Spectrometry (AAS) is a technique for measuring quantities of chemical elements present in different samples by measuring the absorbed radiation by the chemical element of interest. This is done by reading the spectra produced when the sample is excited by radiation. Atomic absorption methods measure the amount of energy in the form of photons of light that are absorbed by the sample. A detector measures the wavelengths of light transmitted by the sample, and compares them to the wavelengths which originally passed through the sample. A signal processor then integrates the changes in wavelength absorbed, which appear in the readout as peaks of energy absorption at discrete wavelengths. The energy required for an electron to leave an atom is known as ionization energy and is specific to each chemical element. When an electron moves from one energy level to another, a photon is emitted with energy, E [26].
Atoms of an element emit a characteristic spectral line. Every atom has its own distinct pattern of wavelengths at which it will absorb energy, due to the unique configuration of electrons in its outer shell. Three steps are involved in turning a liquid sample into an atomic gas. The first step is desolvation in which the liquid solvent is evaporated and the dry sample remains; the second step is vaporization in whichthe solid sample vaporizes to a gas; and the final step is volatilization in which the compounds that compose the sample are broken into free atoms.
B. Atomic Absorption Instrumentation
To understand the workings of the atomic absorption spectrometer,any absorption spectrometer must have components which fulfill the three basic steps or requirements shown in the following figure 1.
Figure1. Instrumentation of absorption spectrometer components
Light Source: an atom absorbs light at discrete wavelengths. In order to measure this narrow light absorption with maximum sensitivity, it is necessary to use a light source, which emits the specific wavelengths which can be absorbed by the atom. The Hollow Cathode Lamp:the hollow cathode lamp is an excellent, bright line source for most of the elements determinable by atomic absorption. Figure 1 shows how a hollow cathode lamp is constructed. Monochromator:it is used to select the specific wavelength of light which is absorbed by the sample, and to exclude other wavelengths.
Detector and Readout Device: the light selected by the monochromator is directed onto a detector that is typically photomultiplier tube, whose function is to convert the light signal into an electrical signal proportional to the light intensity. The processing of electrical signal is fulfilled by a signal amplifier. The signal could be displayed for readout, or further fed into a data station for printout by the requested format.
C. Principles of Atomic Absorption Spectroscopy
When a beam of light of a given wavelength strikes the sample tube in a spectrophotometer, part of it is absorbed bythe sample, part of it is transmitted to the detector, and part of it is lost through the reflection from the tubes surfaces, refraction or bending by the solution, or scattering from small particles suspended in the sample. When we allow the light of the same given wavelength to pass through a “blank sample” identical to the sample in every way except for the presence of the light absorbing species of interest all of these processes except absorption by the sample occur. Transmittance, T, is the ratio of intensity of light passing through a sample at a given wavelength(Ix) divided by the intensity of light passing through a blank at the same wavelength(Io). i.e.;T =Ix
Io Where as
Ix =
Is the intensity of light passing through a sample, a nd
Io=
Is the intensity of light passing through a blank.
Percent transmittance is merely 100 times the transmittance;% 𝑇 = 100 × 𝑇.
Another parameter of interest in a spectrophotometric experiment is absorbance, A.
𝐴𝑏𝑠𝑜𝑟𝑏𝑎𝑛𝑐𝑒 𝐴 = −𝑙𝑜𝑔𝑇
Both transmittance and absorbance is unit less quantities. As it turns out, the absorbance of a sample can be related rather nearly too some relatively simple parameters through an equation known as the Beer- Lambert law or simply Beer’s equation as:
𝐴 = 𝑎𝑙𝑐
Where Ais absorbance, 𝑙is the path length of light through the sample cell (1 cm in a standard Genisys 20 tube), and 𝑎is the absorptivity constant and c is concentration of the sample.
The absorptivity is the proportionality constant in Beer’s Law, which varies from one light absorbing species to another and has wavelength dependence, which is also different from one light absorbing species to another. Thus, the value of A can be changed by one of the following ways for any given light absorbing species. These are change the wavelength, change the path length, or change the concentration.
The path length is usually fixed at some convenient value through spectrophotometer and sample cell design. Also, the absorptivity is usually specified only at 𝜆𝑚𝑎𝑥, which is the wavelength at which light is most strongly absorbed by the light absorbing species. It is worth noting that at for a species of a given concentration in a cell of given path length the variation of A per unit change in concentration is most dramatic because absorptivity is greatest
at𝜆𝑚𝑎𝑥.Therefore, at 𝜆𝑚𝑎𝑥 the concentration of a light
IV. Materials and Methods
A. Reagents and Chemicals
Nitric acid (HNO3) and Hydrogen peroxide (H2O2)
were used as reagents. Nitrates of Cd, Cu, Pb, and Zn were used to prepare stock solutions (1000 ppm, in 2% HNO3) of the metal ions. Deionized water was
used as diluent for preparing desired working standard the metal ion solutions and to wash the apparatuses.
B. Apparatus and Instruments
Apparatus like digestion flasks, volumetric flasks, measuring cylinders and pipettes, separating funnels and filter papers were used. Instruments such as refrigerator, Digital analytical balance, Atomic absorption spectrometer (AAS), hollow cathode lamps and acetylene gas were used in this study.
9) Cleaning apparatus: Apparatus such as conical flasks, volumetric flasks, pipettes, measuring cylinders were thoroughly washed with distilled water; then soaked in 10 % (v/v) HNO3 solution for
24 hour followed by rinsing several times with de-ionized water. These were finally dried in hot air oven and kept in clean place to avoid contamination until analysis began.
C. Sample collection
10) Vegetable samples: Vegetable samples like
tomato (Solanumlycopesicum), potato
(Solanumtuberosum), carrot (Daucuscarota), and cabbage (Brassica oleracea) were collected from Arba Minch (Sikela) commercial market. These were washed thoroughly with tap water and then again washed with distilled water for the removal of any soil particles. These samples were then stored in polythene plastic bags separately.
D. Sample preparation
The stored vegetable samples were placed in acid washed clean porcelain crucibles and oven dry at 85°C for 48 hours in an oven. The dry samples were grounded and homogenized into fine powder with a grinding device and the powder store in polyethylene bags separately.
E. Digestion of the samples
11) Method: 2g of dried and ground vegetable samples was transferred quantitatively into a 100 mL round bottom flask. These vegetablesamples, nine to twelve amounts in milliliter (mL) of freshly prepared 2:1 mixture of 70% Conc. HNO3 andH2O2were
added. Themixtures swirl gently to homogenize and digested continuously on regulated hot plate for 2:30 hrs at 240°C. The cooled digested samples were filtered and make up to 50mL each in a measuring flask using deionized water. The digestion gives a clear colorless solution under optimized condition. Digestion of a reagent blank is also performed in parallel keeping all digestion parameters the same. All the digested samples will be stored in refrigerator until analysis using AAS [25].
F. Analysis of Samples by AAS
Wave length, lamp current, burner alignment and slit width were optimized for each element. A stock standard solution of 1000 ppm in 2% HNO3 for each
of the selected metals Fe, Zn, Pb and Cd was used for preparing intermediate standard solution of 10 ppm for each. Five working standard solutions were prepared by diluting the 10 ppm intermediate standard solution with deionized water. The plot of absorbance versus standard concentration for each metal ion was drawn as its calibration curve. Concentration of metal in sample was determined by comparing its observed absorbance on the standard curve (Ebbdo, 1998).
G. Validation of the Method
12) Precision: The precision of an analytical procedure is usually expressed as the variance, relative standard deviation and percentage relative standard deviation of a series of measurements (Matusiewicz and kopras, 1997). In this study, the precision of the results was evaluated by percentage relative standard deviation of the results of four vegetable samples (N=4) and three readings for each sample giving a total of twelve measurements for a given bulk sample.
TableII.Optimum instrumental conditions for elemental analysis by AAS
Element Wave length (nm) Flame Detection Limit
Cadmium 228.8 Air-Acetylene 0.001
Copper 324.7 Air-Acetylene 0.010
Lead 283.3 Air-Acetylene 0.030
13) Validation of optimized procedures: Direct determination of the validity towards analysis of the vegetable samples with respect to each of the selected metals (Cd, Cu, Pb and Zn) could not be made possible because of the absence of certified reference materials (CSRM) for these metals. Instead, spiking method on the above (same) digestion procedure was adopted for the same purpose. Accordingly, the efficiency of the optimized procedure was checked by adding different volumes of standard solution containing 0.3ppm of each metal in to 2g of powdered vegetable sample. The spiked samples then digest in the same manner as the original sample. Then each digests will be transferred in to a 50 mL volumetric flask and diluted to the mark with deionized water. Finally, the solutions will be analyzed for metal concentration with AAS. The readings have been recorded.Recovery was calculated using the equation given below as;
% 𝑅 =𝐶𝑠− 𝐶
𝑆 × 100 %
Where, S is concentration equivalent of analyte added to the sample, Cs is metal content of the spiked
sample, C is metal content of non-spiked sample and R is percent recovery.
H. Methods of Data Analysis
Various descriptive statistical procedures (mean, standard deviation, percent relative standard deviation (% RSD), linear regression and correlation analysis) were utilized in this study. All the descriptive statistical procedures were conducted using Excel software and Origin61.exe. The levels of selected heavy metal (Zn, Pb, Cd and Cu) determined in samples of the vegetables is reported as the mean of three measurements with corresponding standard deviation. Linear regression and Correlation analysis are performed for the calculation of slope (m) and correlation coefficient (R) of the regression line of each sample.
V. Results and Discussions
I. Instrumental Operating Conditions
For determinations of metal ion concentration in the studied samples the operating conditions in for AAS of the respective metal ions are presented in table III.
TableIII.Instrumental operating conditions
S.No. Element Wave Length(nm)
Slit width(nm)
Lamp Current(mA)
1 Cd 228.9 0.7 2
2 Cu 324.7 0.7 1
3 Pb 283.2 0.7 1
4 Zn 213.9 0.2 7
J. Optimization of the Digestion Condition
Digestion conditions for the samples using HNO3 and
H2O2 mixtures were assessed by varying volume of
acid mixtures and digestion time. Optimization of the digestion conditions for the composite samples of vegetables powder was indicated in table IV.
TableIV.Different methods tested during optimization of procedures for the sample of tomato, cabbage, carrot and potato powders
S.No. Weight of powder vegetables sample (g)
Volume of 2:1 ratio of (v/v) HNO3 and H2O2 (ml)
Maximum temperature (°C)
Time (min.)
Physical appearance of digest
HNO3 H2O2 Total
volume (ml)
1 2 6 3 9 240 150 Clear and colorless
2 2 8 4 12 240 120 Clear but yellowish
K. Calibration of the Instrument
Calibration curve for each metal was drawn to determine the concentration of metal in thesample solutions. A series of working standard solutions were prepared from the 10 ppmintermediate standard solutions of the respective metals. Plots of absorbance values versus working standard solution concentrations are given in figures 2, 3, 4 and 5 (for calibration curves). The working standard solutions
Figure 2. Plot of absorbance versus working standard solutions of Cadmium ion
Figure 3.Plot of absorbanceversus working standard solutions ofCopper ion
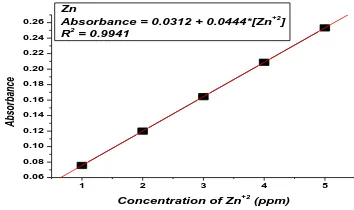
Figure 4.Plot of absorbanceversus working standard solutions ofZinc ion
L. Levels of Selected Heavy Metals in the Cabbage, Carrot, Potato, and Tomato Samples
The levels of concentration of the selected heavy metals Zn, Pb, Cu and Cd determined in the samples of vegetable are reported for each metal as the mean of three measurements along with the corresponding total standard deviation and percent relative standard deviation for the given sample. The results obtained are summarized in table V below.
Figure 5. Plot of absorbance versus working standard solutions of Lead ion
Table V. The levels of concentration of metals (mean ± SD, N =3) in the cabbage, carrot, potato, and tomato sample
Metal Cabbage Carrot Potato Tomato
Conc.(ppm) Conc.(ppm) Conc.(ppm) Conc.(ppm) Cd 0.032±0.0005 0.043±0.0026 0.088±0.0008 0.060±0.0021 Cu 2.480±0.0959 2.413±0.0021 2.195±0.0022 1.240±0.0122 Pb 0.927±0.0042 0.476±0.0017 0.736±0.0015 0.235±0.0025 Zn 1.541±0.0029 2.655±0.0076 4.43±0.0031 1.604±0.0081
TableVI. The tolerance limits of World Health Organization (W.H.O.) of heavy metals: WHO guidelines
Metal Upper limit of concentration (ppm) Cadmium (Cd) 0.010
Copper (Cu) 7.70 Lead (Pb) 0.050 Zinc (Zn) 100
Source: (Admoroti, 1996)
Cadmium is toxic metal with sterilizing, teratogenic and carcinogenic effects. It may also lead to cardiovascular diseases. It is an inhibitor of the
enzymes with suphydryl groups and disrupts the paths for oxidative metabolism [12]. Its toxicity affects brain, heart, blood vessels, kidneys and lungs. United State Department of Agriculture (USDA) limits 0.01 ppm Cd in fruit and vegetable (USDA, 2011). FAO/WHO recommended a maximum limit of 70μg/day (FAO/WHO, 2004). As per the WHO, the maximum permitted level for Cd in vegetables is 0.010 ppm.
The cadmium concentrations in cabbage are 0.032 ± 0.0005 ppm, carrot is 0.043 ± 0.0026 ppm, potato is 0.088 ± 0.0008 ppm and tomato is 0.06 ± 0.0021
1 2 3 4 5
0.06 0.08 0.10 0.12 0.14 0.16 0.18 0.20 0.22 0.24 0.26
Abso
rbance
Concentration (ppm) Cd
Absorbance = 0.024 + 0.043*[Cd+2
]
R2
= 1
1 2 3 4 5
0.02 0.04 0.06 0.08 0.10 0.12
Abso
rbance
Concentration of Cu+2
(ppm) Cu
Absorbance = 0.004 +0.023*[Cu+2
] R2
= 1
1 2 3 4 5
0.02 0.04 0.06 0.08 0.10 0.12 0.14 0.16
Abso
rbance
Concentration of Pb+2 (ppm) Pb
Absorbance = 0.0024 + 0.0288*[Pb+2] R2
= 1
1 2 3 4 5
0.06 0.08 0.10 0.12 0.14 0.16 0.18 0.20 0.22 0.24 0.26
Abso
rbance
Concentration of Zn+2
(ppm) Zn
Absorbance = 0.0312 + 0.0444*[Zn+2
]
ppm. The cadmium is found to be more in potato i.e. 0.088 ppm and its concentrations are decreasing for tomato 0.06 ppm, carrot 0.043 ppm and cabbage 0.032 ppm. In this study, cadmium was found to be more than the permissible detection limits expressed in the table VI, in all the vegetables of cabbage, carrot, potato, and tomato samples.
Figure 6. Graphical representation of Cadmium in each vegetable
Copper is a nutritionally essential element and is widely distributed in nature (Greenwood and Earnshow, 1984). Toxicity of copper doesn’t affect seriously the blood and kidneys (Hajjar and kitchen, 2003). The deficiency of Cu is associated with increased risk of hypertension (Russo et al., 1998; Elinder, 1992). As per the W.H.O., the maximum permitted level for Copper in vegetables is 7.70 ppm. The copper concentrations in cabbage are 2.48 ± 0.0959 ppm, carrot is 2.413± 0 .0021ppm, potato is 2.195 ± 0.0022ppm and tomato is 1.240 ± 0.0122ppm. The copper is found to be more in cabbage i.e. 2.48 ppm and its concentrations are decreasing for carrot 2.413 ppm, potato 2.195 ppm and tomato 1.240 ppm. In this study, copper was found to be less than the permissible detection limits as expressed in the table VI, in all the vegetables of cabbage, carrot, potato, and tomato samples.
Figure 7. Graphical representation of Copper in each vegetable
Lead toxicity adversely affects brain, heart, kidney, liver nervous system and pancreas. It may cause many signs and symptoms such as abdominal pain, anemia, anorexia, anxiety, bone pain, brain damage, confusion, fatigue, headache and hypertension. It also diminishes IQ in children (Taher, 2003).United State Department of Agriculture (USDA) limits 0.05 ppm Pb in fruits and vegetables (USDA, 2011). American Herbal Products Association (AHPA) recommended a maximum limit of 10μg/day for Pb (AHPA, 2009).
FAO/WHO recommended a maximum limit of 300μg/day (FAO/WHO, 2004).
The lead concentrations in cabbage are 0.927 ± 0.0042ppm, carrot is 0.476± 0.0017ppm, potato is 0.736 ± 0.0015ppm and tomato is 0.235 ± 0.0025ppm. The lead is found to be more in cabbage i.e. 0.927 ppm and its concentrations are decreasing for potato 0.736 ppm, carrot 0.476 ppm and tomato 0.235 ppm. In this study, lead was found to be more than the permissible detection limits as expressed in the table VI, in all the vegetables of cabbage, carrot, potato, and tomato samples.
Figure 8. Graphical representation of Lead in each vegetable
Zinc is an essential trace element, performs important biochemical functions and is necessary for maintaining health throughout life. Zinc constitutes about 33 ppm of adult body weight and is essential as constituent of many enzymes involved in a number of physiological functions, such as protein synthesis and energy metabolism. In recent years, zinc has been identified as a mineral that plays important role in the genes and progression of several diseases related in certain manner to oxidative stress. Zinc deficiency resulting from poor diet alcoholism and mal-absorption, causes dwarfism, hypogonadism and dermatitis (Ensminger et al, 1995). Maximum Zn tolerance for human health has been established for edible parts of crop as 20 ppm by Chinese Department of Preventive Medicine (CDPM, 1995). WHO maximum permitted level for Zinc in vegetables is 100 ppm.
The zinc concentrations in cabbage are 1.541 ± 0.0029ppm, carrot is 2.655 ± 0.0076ppm, potato is 4.43 ± 0.0031ppm and tomato is 1.604 ± 0.0081ppm. The zinc is found to be more in potato i.e. 4.43 ppm and its concentrations are decreasing for carrot 2.655 ppm, tomato 1.604 ppm and cabbage 1.541 ppm. In this study, zinc concentrations were found to be present far less than the permissible detection limits as expressed in the table VI, in all the vegetables of cabbage, carrot, potato, and tomato samples.
cabbage carrot potato tomato
0.00 0.02 0.04 0.06 0.08
Co
nc
en
tra
tio
n
Types of vegetables
Figure 9. Graphical representation of Zinc in each vegetable
Generally, the levels of cadmium, copper, lead and zinc concentrations in vegetable samples it may attributed due to variation in sources and processes of contaminations that could attribute to metals
contamination to take place during pre-harvest and post-harvest process. Possible sources during pre-harvest include from soil type, fertilizers, pesticides, municipal wastewater and water used for irrigation, while post-harvest sources may include contamination through air pollution and during transport to the market or at the point of sale.
M. Validation of optimized procedures
The percentage recovery testof samples is given in table VII. The table shows that the recovery results lie within the acceptable range above 80 %. So, good percentage recovery test was obtained for Cadmium, Copper, Lead and Zincfor the potato sample validating that the optimized procedure has had good accuracy.
TableVII. Percentage recovery of cadmium, Copper, Lead and Zinc from spiked samples of potato sample
Spiked Analyte Amount before Addition(ppm) Amountadded (ppm) Amount found (ppm) % Recovery
Cadmium (Cd) 0.088 ±0.0008 0.3 0.483±0.0008 131.67
Copper (Cu) 2.195± 0.0022 0.3 2.464 ± 0.0022 89.66
Lead (Pb) 0.736± 0.0015 0.3 1.099 ± 0.0015 121.30
Zinc (Zn) 4.43± 0.0031 0.3 4.765 ± 0.0031 111.89
VI. Conclusions and Recommendations
A. Conclusion
In this study of trace metals, especially heavy metals are considered to be one of the main sources of pollution in the vegetables since they have significant effect on ecological quality. Small amounts of heavy metals are needed in our environment, diet and actually necessary for good health, but large amount of any of them may cause chronic toxicity. Different heavy metals have different methods of extraction. In order to show this idea, sample preparation techniques have been developed. From these sample preparations techniques, i.e. wet digestion, dry-ashing digestion was studied. These techniques needs low consumption of reagent and time. In addition to that sample quantification techniques which include Atomic absorption spectrophotometry, Graphite furnace atomic absorption spectrophotometry, Ultraviolet visible spectrophotometry and electro analytical methods were reviewed and the most common methods used nowadays for the determination of heavy metals in vegetables sample involve highly sensitive spectroscopic techniques, such as Atomic absorption spectrophotometer (Flame atomic absorption spectrophotometer, Graphite furnace atomic absorption spectrophotometer) and Ultraviolet visible spectrophotometer. Generally, the levels of metals in similar vegetable samples differed among the sampling sites that may be due to variation in sources and processes of contaminations that could attribute to metals contamination to take place during
pre-harvest and post-harvest process. Possible sources during pre-harvest include from soil type, fertilizers, pesticides, municipal wastewater and water used for irrigation, while post-harvest sources may include contamination through air pollution and during transport to the market or at the point of sale.
B. Recommendation
Heavy metals are one component part of vegetables. However, they are harmful for healthy whenever they are toxic when found above the permissible limits. Heavy metals are the most important sorts of contaminant in the environment. As indicated by most researcher most of vegetables were contain toxic heavy metals. In the present study, cadmium and lead were found to be more in concentrations than the given permissible limits and almost follows the same trend increasing the concentrations of cadmium and lead from cabbage to potato but exchanging in carrot and tomato concentrations. But whereas the remaining metals like lead and zinc concentrations were found to be agreeable as they are found to be present below the permissible limits. It is recommended that these types of vegetables should not be cultivated in farms and fields nearby urban areas which have heavy vehicle movements and irrigated with questionable water quality which could be sources of heavy metals contamination.
amount of aerial contamination from the vegetable surface.
Markets establishments for vegetable sale should be away from motor vehicle parking and movement areas, as motor vehicle emissions can be a source of heavy metal contamination in vegetables at road side market.
Usegood agricultural practices under supervision for proper fertilizer application.
Further works should be carried out in the soil samples where the vegetables are grown, irrigation water and compost or fertilizers on the availability of metals to different vegetable, as it could be useful to take remedial measures by regulatory agencies of the town to abate the metal pollution and also restrict the cultivation of vegetables on contaminated soils.
Therefore, from the present study it contains more concentrations of cadmium and lead causes various effects to the human body as mentioned above clearly. Moreover, cabbage, potato,tomato and carrot vegetables were found to be more in concentrations of cadmium and lead.
ACKNOWLEDGEMENT
We thankfully acknowledge the Department of Chemistry, College of Natural Sciences, Arba Minch University, Ethiopia, for providing necessary facilities to carry out this work.
References
[1] G. Brhane, K. Belay, K. Gebremedhin, T. Abraha, T. Aleymayehu, T. Mezegebe and M. Hishe. ISSN 2351-8014 Vol 10 No. 1 Oct, 2014, pp. 246-254.
[2] A. Maleki and M. A. Zarasvand, Heavy metals in selected edible vegetables and estimation of their daily intake in Sanandaj, Iran, J. Med. Scie., Sanandaj, Iran, 39, 2 (2008) 335- 337.
[3] R. k. Sharma, M. Angrawal and F. M. Marshal, Heavy metal in vegetable collected from production and market sites of tropical urban area of India, J. Food and Chem. Toxicol., 47 (2009) 583-591.
[4] M. A. Radwan and A. K. Salama, Market basket survey for some heavy metals in Egyptian fruits and vegetables, Food and Chem. Toxicol., 44 (2006) 1273-1278.
[5] S. R. Khan, Farooq, S. Shahbaz, M. A. Khan and M. Sadique, Health risk assessment of heavy metals for population via consumption of vegetables, J. World App. Scie., 6, 1 (2009) 1602-1606.
[6] Marshall, (2004). Enhancing food chain integrity; quality assurance mechanism for air pollution impacts on fruit and vegetables system, crop post-harvest program, final technical report (R7530).
[7] Radwan,M.A. and Salama,A.K. (2006). Market basket survey for some heavy metals in Egyptian fruit and vegetables.Foodtoxicol: 44:1273-1278.
[8] FAO/WHO, (2004).Evaluation of certain food additives and contaminants. Joint FAO/WHO Expert Committee on Food Additives.WHO Food Additive Series 52.
[9] Feign et al., (1994) D.I. Feign, T.M. Reid, L.A. Loeb. Reactive oxygen species in tumorigenesisCancer research, 54(suppl.) (1994), pp. 18900-1894.
[10] Lake et al., (1984) D.L. Lake, P.W.W. Kirk, J.N. Lester. The fractionation, characterization and speciation of heavy
metals in sewage sludge and sewage sludge amended soils: a review journal of environmental quality, 13 (1984), pp. 175-183.
[11] Ozcan, M., (2005). Determination of mineral contents of Turkish herbal tea ( Salviaaucheri Var. conescens) at different infusion periods. J. Med. Food, 8: 110-112. [12] Tortor, G.T., (1997). Introduction to human body; The
essential of Anatomy andphysicology,4th ed., John Willey and sons, Newyork, pp 472-4 United State Department of Agriculture (USDA), (2011).Foreign Agricultural Services.GlobalAgricultural information Net work. GAIN Report Number: IS1101.
[13] Morison, G.S, (2007). Trace Analysis physical method. John willeyand sons, newyork, p. 67-94.
[14] Kocak, S., Tokusoglu, and O. Aycan, S. (2005). Some heavy metals and trace essential element detection in canned vegetable food stuffs by differential pulse polarography (DPP),Electron. J. Environ. Agric. Food chem. 4,871-878.
[15] Greenwood, N.W, Earnshow, A., (1984). Chemistry of Elements, pergamon, Newyork,Hajjar, I., Kotchen, T., (2003). Regional Variations of blood pressure in the united stateareassociated with regional variations in dietary in takes: NHANES-III data.J.Nutr,133,211-214.
[16] Hajjar, I., Kotchen, T., (2003).Regional Variations of blood pressure in the united state are
[17] associated with regional variations in dietary in takes: NHANES-III data.J.Nutr,133,211-214.
[18] Russo, C., Olivieria, D. Girelli, D.,(1998).Anti Oxidant Status and lipid per-oxidation in patientswith essential hypertension J. Hypertens, 16:1267-1271.
[19] Mardlaw, G.M, Insel, P.M., (1996).Perspective in Nutrition, 3rd ed., Mosby- year book: Boston; PP 524-562.
[20] Kocak, S., Tokusoglu, and O. Aycan, S. (2005). Some heavy metals and trace essential element detection in canned vegetable food stuffs by differential pulse polarogarphy (DPP),Electron. J. Environ. Agric. Food chem. 4,871-878.
[21] Fifield, F.W. and Haines, P.J., (1997). Environmental Analytical chemistry, BalackieAcadamic professional: London,; PP 323-349.
[22] Taher, M.A., (2003). Flame atomic absorption spectrometric determination of trace lead after solid-liquid extraction and pre concentration using 1-(-2-pyridylazo)-2- naphtol.Croat.chem. Acta, ,76,273-277.
[23] Harvey, D., (2000). Modern Analytical Chemistry, McGraw –Hill Companies, Inc. PP: 418.
[24] Sneddon, J.C., Hardway, K., Bobbadi, A.K., (2006). Sample preparation of solid samples for metals determination by atomic spectroscopy, an overview and selected recentapplications. Applied Spectroscopy Reviews, 41: 1-14.
[25] Maria, B. (2002). Sample digestion methods for determination of traces of precious metals by Spectrometric techniques, Anal.Sci, 18,737-750.
[26] Lopez, F.F., Cabrera, C., Lorenzo, M.L., and Lopez, M.C., (2002). Aluminum contents ofdrinking waters, fruit juices and soft drinks: contribution to dietary intake. Sci. TotalEnviron,292:205-213