Published online December 02, 2014 (http://www.sciencepublishinggroup.com/j/ijgg) doi: 10.11648/j.ijgg.20140206.11
Statistical data mining for symbol associations in genomic
databases
Bernard Ycart
1, 2, 3, Frederic Pont
3, 4, 5, 6, Jean-Jacques Fournie
3, 4, 5, 61Université Grenoble-Alpes, Grenoble, France
2Laboratoire Jean Kuntzmann, CNRS UMR5224, Grenoble, France 3Laboratoire d'Excellence TOUCAN, Toulouse, France
4INSERM UMR1037-Cancer Research Center of Toulouse, Toulouse, France 5Université Toulouse III Paul Sabatier, Toulouse, France
6ERL 5294 CNRS, Toulouse, France
Email address:
[email protected] (Bernard Y.), [email protected] (Frédéric P.), [email protected] (Jean-Jacques F.)
To cite this article:
Bernard Ycart, Frederic Pont, Jean-Jacques Fournie. Statistical Data Mining for Symbol Associations in Genomic Databases. International Journal of Genetics and Genomics. Vol. 2, No. 6, 2014, pp. 97-104. doi: 10.11648/j.ijgg.20140206.11
Abstract:
A methodology is proposed to automatically detect significant symbol associations in genomic databases. A new statistical test assesses the significance of a group of symbols when found in several genesets of a given database. To each pair of symbols, a p-value depending on the frequency of the two symbols and on the number of joint occurrences, is associated. All pairs with p-values below a certain threshold define a graph structure on the set of symbols. The cliques of that graph are significant symbol associations, linked to a set of genesets where they can be found. The method can be applied to any database, and is illustrated on the MSigDB C2 database. Many of the symbol associations detected in C2 or in non-specific selections correspond to already known interactions. On more specific selections of C2, many previously unknown symbol associations have been detected. These associations unveal new candidates for gene or protein interactions, needing further investigation for biological evidence.Keywords:
Genomic Databases, Protein-Protein Interaction, Frequent Itemset Searching, P-Value Graph1. Introduction
Large-scale genomic databases have been developed for over a decade as catalogs of genesets [1,2]; a geneset is a list of genes/proteins, the expression level of which was found to be associated to some biological process, cellular component, metabolic function, type of cancer, etc. Examples include the KEGG database [3], MSigDB C2 to C7 [4], and those from the Gene Ontology Project [5]. The contents of genesets will be viewed here as symbols i.e. character strings without a priori biological meaning, and will be distinguished from the gene or proteins they represent.
Parallel to the creation of databases, the question of building a full network of Protein-Protein Interactions (PPIs), or interactome, has also received a lot of attention [6–9]. De Las Rivas and Fontanillo [7] distinguish binary methods that look for pairwise associations, from co-complex methods that detect groups of more than two proteins. One seemingly simple co-complex method consists in listing geneset
intersections in databases. Indeed, finding a given group of symbols in several genesets provides a reasonable heuristic for a possible PPI, to be validated by a subsequent biological study.
itemset algorithms by Agrawal et al [10]: see [11–13] for general reviews, [14] for an application in the context of genomic profiling. However, we argue that algorithms that systematically detect the most frequent sets are not adapted to the present context. Indeed, the most frequent associations involve symbols present in many different genesets: these associations are the most conspicuous and well documented. Associations of relatively unfrequent symbols are potentially more interesting. This poses the problem of assessing the significance of a given intersection.
Contrarily to existing algorithms such as that of Kirouac et al. [9], the method proposed here relies on a purely statistical approach. A new test has been defined: it computes a p-value for each symbol group common to a given collection of genesets. The test takes into account the frequencies of the different symbols in the database: an association of frequent symbols is less significant than an association of rare symbols in the same number of genesets. Considering a given group of symbols, the test statistic is the number of genesets it appears in. Under the null hypothesis of random occurrences, its distribution can be approximated by a Poisson distribution, using classical results on the so called “law of small numbers” [15]. The p-value is computed as a tail probability of the Poisson approximation.
The test is used to define an undirected weighted graph structure for which vertices are symbols: each pair of symbols (edge) is weighted by its p-value in the association test. Thus p-values are viewed as distances between symbols: the more frequent the occurrence of the pair, the lower the p-value, and the closer the two symbols. Using this type of mathematical structure in genomics data mining is not new: see the review by Lee et al. [16]. Once the weights have been calculated, two procedures can be applied. One of them uses pairwise p-values as a dissimilarity to perform a hierarchical clustering of the set of symbols under consideration [17, 18]. The other consists in thresholding the weights to deduce a continuum of unweighted graphs on the set of symbols: a threshold h being chosen, an edge exists between two symbols if the p-value of the pair is smaller than h. It is then natural to consider as significant the maximal cliques of the thresholded graph [19]. Indeed, cliques are groups of symbols such that any two of them are connected in the graph, which is equivalent to saying that any two of them are associated in a significant number of genesets. Algorithmic complexity is a major difficulty here. Clique finding is a NP-hard problem, and listing all cliques of a reasonably dense graph is not feasible in practice beyond a few hundred vertices. In our case, the possibility to adjust the threshold is a crucial feature. The lower the threshold h, the sparser the graph. For a given database, h can be chosen such that the number of neighbors of each symbol (its degree in the graph) is smaller than 100, say. For such a sparse graph, the classical Bron-Kerbosch algorithm can be applied to the neighborood of each symbol [20]. This yields a list of all cliques of the graph. Each clique (significant group of symbols) is then examined to see if it appears in two or more genesets, then possibly completed by other symbols appearing in the same
genesets; lastly, the association p-value of the whole group is computed.
The procedure has been implemented in a R script [21] available online together with files of results. Examples of executions on MSigDB C2 [4] (referred to as C2 thereafter) and five selections from the same are given: see next section and additional files. When genesets cover many diseases or functions, such as those of C2, or even non-specific selections like all cancer-related genesets of C2, the majority of detected associations are compatible with known PPIs. In our view, this supports the intuition that significantly large geneset intersections do contain PPI information. On specific selections of C2, such as for instance genesets related to breast cancer, a majority of detected associations did not correspond to known PPIs. Further investigation should be made to assess their biochemical significance. We are aware that an algorithmic listing of significant associations does not necessarily imply that all listed groups correspond to meaningful PPIs. Such a listing must necessarily be expert-curated for biochemical validation. We are also aware that our specific selections of genesets are too restrictive to be completely meaningful. They are presented here only as an illustration of potential uses, hoping that the method could prove useful to disease-oriented interactomics [8].
2. Results
Results of the in silico experiments that were conducted to assess the interest of the method are reported here. Two points had to be proved. The first point was that the information contained in large geneset intersections was compatible with established interactome knowledge. The second point was that significant geneset intersections such as detected by our method could contain previously unkown PPI information. In order to establish those two points, we have applied the method to C2, and five other databases, obtained by selecting in C2 those genesets with names matching one or more character strings. They will be referred to as C2Blast (character string “blast”), C2Breast (character string “breast”), C2Cancer (any character string related to cancer, such as “tumo”, “carci”, etc.), C2K (character string “KEGG”), C2Lymph (character strings “lymph” or “leuk”).
However high numbers of co-occurrences (as in the case of MAPK1 with some of its neighbors) are still translated into very low p-values.
The choice of a threshold h is left to the user. For statistical reasons, a significance threshold larger than 5% is not appropriate. For algorithmic reasons, a threshold such that the highest degree in the association graph is about 100 should be
selected if possible. For each of the five databases, a threshold was chosen and the detection algorithm was run. The thresholds that have been applied to the six examples are shown on Table 2. The six lists of symbol associations are given as additional text files. The larger the number of genesets, the denser the association graph at a given threshold, thus the lower the threshold should be.
Table 1. For symbols AKT1, GRB2, HRAS, MAPK1, PIK3CA, RAF1, SOS1, COMP, THBS1–4 and database C2, the table gives their frequency, and the number
of neighbors at thresholds h = 10−2 , . . . , 10−10 .
Symbols Frequency Neighbors at threshold h
h = 10-2 h = 10-3 h = 10-4 h = 10-5 h = 10-6 h = 10-7 h = 10-8 h = 10-9 h = 10-10
AKT1 221 70 53 45 31 28 22 16 13 8
GRB2 216 89 63 51 38 28 23 19 16 14
HRAS 224 76 49 33 21 15 14 14 13 12
MAPK1 263 80 52 41 28 21 13 12 11 11
PIK3CA 235 77 60 49 41 34 28 24 20 18
RAF1 186 106 65 46 37 28 21 17 14 12
SOS1 191 92 61 44 31 26 20 19 16 14
COMP 35 724 366 147 59 8 1 1 0 0
THBS1 163 7 0 0 0 0 0 0 0 0
THBS2 86 92 27 9 6 3 2 2 0 0
THBS3 23 213 26 6 2 0 0 0 0 0
THBS4 37 100 13 3 0 0 0 0 0 0
Table 2. Detected associations in C2 and the 5 selections given as examples.
The number of genesets and the threshold at which the detection was made are given as columns 2 and 3. The lists of detected associations were sorted on numeric criteria: number of symbols per association smaller than 10 (column 5), number of genesets larger than 2 (column 6) or both (column 7). The full lists are given as additional text files
Selection genesets h All s<10 g>2 both
C2 4722 10-15 659 500 689 500
C2Blast 57 0.05 265 249 49 49
C2Breast 159 10-2 1337 1044 763 628
C2Cancer 948 10-5 924 828 924 828
C2K 186 10-3 501 404 334 288
C2Lymph 107 10-2 364 325 139 132
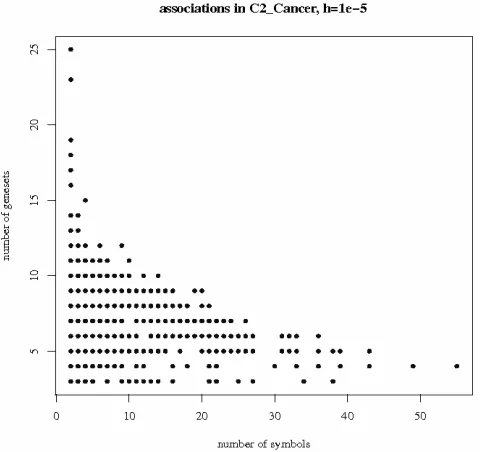
The number of symbols and the number of genesets of each association varies. Fig. 1 shows a scatterplot of both quantities for the 828 associations detected at threshold 10−5 in C2Cancer. Similar plots were obtained on all selections. Associations represented on the bottom right corner correspond to large numbers of symbols common to few genesets. As an example coming from C2Cancer, the two genesets “Acevedo liver cancer up” (973 symbols) and “Acevedo liver tumor vs normal adjacent tissue up” (863 symbols) have 494 symbols in common. Here, the high rate of overlap indicates informational redundancy (the two geneset definitions are almost synonymous). This phenomenon is common to all databases: some of the associations detected by our method are very large groups of symbols, common to a small number genesets. We believe that such large intersections should be interpreted with caution, as the largest overlaps are most likely to result from direct informational redundancy between genesets rather than actual biological associations. On the contrary, associations in the top left corner of Fig. 1 involve fewer symbols common to many genesets. These symbols usually correspond to very common ‘jack-knife’ proteins
(AKTs, COLs, ERKs, MAPKs,…) involved in many different cell functions and biological pathways. As an example, the highest two points on Fig. 1 correspond to pairs of collagens: COL1A1, COL1A2 found together in 25 genesets, and COL1A2, COL3A1 found together in 23 genesets. Actually, the three collagens COL1A1, COL1A2, COL3A1 are found together in 43 genesets of C2. This can hardly be considered as new biological information, but rather as biological redundancy. We shall argue in the discussion section that finding together symbols of the same family in some pathways may be biologically interesting, though not surprising.
Figure 1. Detected associations in C2Cancer: 924 associations detected at
Here is an example of both informational and biological redundancy. LOC652826 is present in 47 genesets of C2 (1151 symbols out of the 21047 of C2 are locations). Out of those 47 genesets, 46 have a name beginning with “reactome”. The intersection of those 47 genesets is made of LOC652826, PSMC6 and 36 other PSMs (proteasomes). Actually, LOC652826 is a synonym of PSMC6. Nevertheless, the pair LOC652826, PSMC6 is detected as significantly associated by our test (P= 5.8×10−38 ) and the intersection of the 47 genesets is identified as a significant association by the algorithm.
Both types of redundancy will be further illustrated by the following associations detected in C2K: AKT1, AKT2, and AKT3 found together in 30 genesets; MAPK1 and MAPK3 found together in 46 genesets; PIK3CA, PIK3CB, PIK3CD, PIK3CG found together in 34 genesets; AKT1, AKT2, AKT3, GRB2, HRAS, MAP2K1, MAPK1, MAPK3, PIK3CA, PIK3CB, PIK3CD, PIK3CG, PIK3R1, PIK3R2, PIK3R3, PIK3R5, RAF1, SOS1, SOS2 found together in 16 genesets. It is not surprising to see homologs 1,2,3 of v-akt murine thymoma viral oncogenes (AKTs) jointly appear in C2K genesets. The same can be said of mitogen-activated protein kinases (MAPKs) and phosphoinositide-3-kinases (PI3Ks). The largest association found in C2K involved 95 symbols, including 22 IFNs (interferons) and 47 ILs (interleukins). They were common to two genesets, “Cytokine cytokine receptorinteraction” “Jak stat signaling geneset”. This corresponds to a typical case of informational redundancy as most cytokine/cytokine receptor interaction trigger intracellular signals which are transduced through Jak/Stat cascades. The second largest association was that of 90 symbols, including 14 ATPs (ATP synthases, H+ transporting), 20 COXs (cytochrome c oxidases), 35 NDUFs (NADH dehydrogenase (ubiquinone)), 4 SDHs (succinate dehydrogenase complex), and 8 UQCRs (ubiquinol-cytochrome c reductase). Those 90 symbols were found in 4 genesets, named “Alzheimers disease”, “Huntingtons disease”, “Parkinsons disease”, and “Oxidative phosphorylation”. By contrast, this association has a higher informative biological significance. The three distinct neurodegenerative diseases do involve neuronal apoptosis, wherein a key step is defective mitochondial respiration, also known as oxidative phosphorylation.
Here is a much less impressive association, still detected in C2K: COMP, THBS1, THBS2, THBS3, THBS4 found together in 3 genesets. It concerns relatively unfrequent proteins: THBS1 appears in 5 genesets, whereas COMP, THBS2, THBS3, and THBS4 do not appear in any other than the 3 genesets they all have in common. Among other interactome databases, we have chosen STRING 9.0 [22] as a reference, and systematically compared symbol associations detected by our method to STRING evidence views. The cartilage oligomeric matrix protein (COMP) is not signaled in STRING as biochemically linked with thrombospondins (THBSs). Yet, finding them together does have a biological interest. Indeed, COMP is not a thrombospondin, yet a close examination of its structure and functions evidences a link not
detected by current algorithms or search robots: the COMP includes a thrombospondin-like domain.
It can be considered that the potentially novel associations are likely to be found among those with a small enough number of symbols, and a large enough number of genesets. Thus the lists can be screened over numerical criteria. An example of screening (number of symbols smaller than 10, number of genesets larger than 2) appears on columns 4 to 6 of Table 2. After numerical screening, the remaining associations were tested in STRING 9.0 [22]. STRING distinguishes evidence of association according to neighborhood, gene fusion, cooccurrence, coexpression, experiments, databases, textmining, homology. We considered that two symbols were connected in STRING if at least one of the 8 links exists, i.e. if there exists at least one edge in the evidence view. The results only reflect the status at the date when comparisons were made. STRING is in constant evolution, and includes new interactions almost daily. Several of the groups found disconnected when the comparison was made, may have been connected since. Among the associations detected in the full database C2 at threshold h = 10−15, nearly all fell under informational and/or biological redundancy. Very few disconnected STRING graphs were detected in that experiment; examples include: PRLHR, DRD5 found together in 12 genesets; UQCRC1, SDHA found together in 23 genesets; ZNF367, UHRF1 found in 24 genesets. In C2K and C2Cancer, a majority of detected associations also corresponded to STRING-connected graphs. In the other three (more specific) selections, a majority corresponded to disconnected, or even empty graphs. Here are two examples of STRING-disconnected associations from C2Breast (many more can be found in the corresponding additional file): ERBB3, MYB found together in 7 genesets; DSC3, KRT14, PDZK1IP1 found together in 6 genesets. Once again, algorithmic detection cannot be considered a proof that ERBB3 (v-erb-2 erythroblastic leukemia viral oncogene homololog 3) and MYB (v-myb myeloblastosis viral oncogene homolog) are functionally related, even though it has been shown that both genes are deregulated by mutations of the transcription factor TWIST in human gastric cancer [23].
were correctly identified as homogeneous clusters.
3. Discussion
As for many other data mining tools, the objective of our method is to algorithmically reduce combinatorial explosion in searching for sizeable intersections from collections of genesets. Unlike existing frequent itemset searching algorithms [11–14], the goal here is not to list all groups of at least so many sets intersecting in so many items. This would output only very frequent symbols, excluding all others. Relatively small intersections of rather unfrequent symbols may be much more significant, and therefore should be enhanced. This is done by selecting intersections on their p-value from a statistical test, rather than on their sizes. Unlike in [9], the association graph that is deduced from testing pairs of symbols is not meant as the representation of an interaction network, but as the basis of a co-complex PPI searching method: the cliques of the graph should be tested as possible interaction candidates. The method can be applied to any database, and we believe that reducing generic databases to more specific genesets can lead to interesting lists of associations, small enough to be expert curated. Indeed, an algorithmically detected association cannot be accepted as biological evidence, but only as a possible candidate, selected on statistical evidence.
Examining the examples of outputs given as additional files, one cannot fail to notice very large intersections of several genesets under similar names. For different reasons, linked to the way they were compiled, largely overlapping genesets have been included in most databases: this can be called ‘informational redundancy’. It can be controlled by algorithmically screening outputs on numerical criteria (e.g. eliminating too large intersections). Also, among detected intersections, many include genes belonging to the same family. The definition of our statistical test enhances significant associations of relatively unfrequent symbols, but does not remove conspicuous associations of very frequent symbols. Previously given examples include AKTs, COLs, MAPKs, PIKs, PSMs, etc. This is part of what could be called ‘biological redundancy’. Indeed it is not suprising to observe two members of the same family jointly appear in many different genesets. But is it completely uninteresting? We do not believe so and detail several arguments below.
Associations involving redundant genes might define a functional group which is highly informative. As an example consider the ‘redundant’ association CD1A, CD1B, CD1C, CD1D, CD1E. These five structurally related glycoproteins have almost similar functions. But for biologists, ‘almost similar’ very often means ‘actually distinct’. Indeed, these five CD1s do mediate seemingly similar but very distinct immunological functions, related altogether to cell surface presentation of non-peptide antigens to T-lymphocytes. In short, CD1A presents a group of mycobacterial glycans, CD1B presents lipids, CD1C presents glycolipids and sulfatides, CD1D presents a ceramide and CD1E does not presents antigens but processes cytoplasmic phospholipids.
Hence an association comprising several of the redundant CD1s is informative of a more global process involving immunity to non protein antigens (the so-called innate immunity). In addition, finding other non-CD1 genes in the same association is quite interesting for a biologist. It turns out that in C2, two genesets contain the five CD1s above, and also MME (membrane metallo-endopeptidase) and DNTT (deoxynucleotidyltransferase, terminal).
We do not believe that associations involving functionally redundant genes necessary lack interest. The presence of ‘redundant’ genes in some detected association does bring an information to the reader, as globally ‘redundant genes’ are never exactly redundant, due to evolutive speciation. In any metazoan genome, duplicated genes with the same initial function always evolve separately, and progressively acquire more specific functions along evolution, time, and selective pressure at the genic level. Hence ‘functional redundancy’ does not mean ‘non-novel’. Four examples will be given in different fields of biology.
Example 1 (evolutionary developmental biology): One could quote the very first Toll genes which still control development in the fly, but were ancestrally duplicated several times leading to ten Toll-Like Receptor genes in the human genome (eleven in the mouse). None of these TLRs does exactly the same as in the original fly: roughly summarizing, they all control inflammation in mammals, although actually none of them does the same thing in this function (see Beutler and Hoffmann’s work on the activation of innate immunity that won them the 2001 Nobel prize in medicine). The same would apply to the conserved and functionally redundant NLR genes. Hence TLRs-comprising associations can be seen as biologically redundant but nevertheless have a different significance according to which TLR members are included.
Example 2 (immunology): Consider two genes from the large subgroup of KLRs: KLRC1 and KLRK1. These two genes mediate the same ligand recognition in the same immune process (regulation of NK cell-mediated lysis of target cells), but they actually transduce opposed signals: KLRK1 activates cell lysis while KLRC1 inhibits it. Their dual presence in a clique would not mean the same thing (regulation of NK activity) than the presence of several of the redundant KLRK-like genes only (activation or inhibition). Actually, KLRC1 and KLRK1 are both present in seven different genesets of C2, together with KLRD1.
Example 3 (neurobiology): Adenosine (dopamine, or other
transducing genes, whereas the two others are coupled, on the converse, to Gi transducing genes. Moreover two ADORAs open ion channels, the two others raise intracellular cAMP. Altogether, these four seemingly functionally redundant adenosine receptor GPCR are actually not so redundant.
Example 4 (pharmacology): Similar points could be made using many other examples. Most of the Ig’s superfamily, of the very large TNFR superfamily, of the GPCR superfamily, of the olfactory receptor (OR) superfamily did evolve by serial duplication/ mutation/ neofunctionalization and functional speciation (among other processes) which led to the presently puzzling functional redundancy in most of the eukaryote genomes. For example genes encoding for the various isoforms of PI3K are grossly depicted as functionally similar isoforms, yet each of these is involved in very different signalling according to the tissues and cell types in which they are expressed, (leading to their very selective targeting for the therapy of specific cancers).
Frequent genes in databases correspond to ‘jack-knife genes’ (MYCs, ERKs, MAPKs, PI3Ks…) which are involved in many different cell functions and biological pathways. Indeed duplication of such genes along evolution has led to gene families with all possible strengths of penetrating phenotypes, from hypomorphics to functionally distinct mutants. Undoubtedly on the long term, gene duplication also drove to speciation of functions and functional divergence, as proposed long ago by S. Ohno [24]. Multifunctional genes evolving from an ancient unique function to multiple neofunctionalization, by various possible evolutive processes (see [25, 26]) are numerous in our genome and represent a major source of ‘functionally redundant’ associations. By contrast, the currently monofunctional genes present duplications and appear in ‘functionally redundant’ associations far less frequently. This observation is not trivial, and links blatantly the significance of biologically redundant associations to molecular evolution (see e.g. [27]).
4. Conclusions
We have defined an algorithm that automatically outputs symbol associations by searching for significant geneset intersections in a database. The method is based on a statistical test, used to define a graph structure among symbols. It has been applied to MsigDB C2 [4] and five databases selected from the same; two of them had little specificity (C2K, C2Cancer), the three others were more specific (C2Apop, C2Blast, C2Breast, C2Lymph). On each database, a list of symbol associations, small enough to be expert-curated, was obtained. The detected associations were compared to STRING evidence views. Out of the associations coming from non-specific databases, a majority had connected graphs in STRING evidence views; this validates the intuitive idea that significant geneset intersections correspond to biologically relevant interactome information. Among specific databases, many detected associations had disconnected STRING graphs; this may be an indication that new interactome information can be
extracted. Therefore, we believe that the proposed method can be added to the data mining tools for searching protein-protein interactions.
5. Methods
5.1. Association Test
The association test will be defined in this section. A basic assumption is that there are no duplicates in genesets: each symbol appears at most once in a given geneset. The distinction between symbol and protein or gene is crucial: it is sometimes the case that two symbols actually correspond to the same gene, even though they are treated here as different (an example has been given in the Results section).
Consider a database made of p genesets of different sizes: the i-th geneset contains li symbols, assumed to be all distinct.
Denote by nj the frequency of symbol number j, i.e. the total
number of genesets it appears in. The assumption of no duplicates implies that the sum of symbol frequencies is equal to that of geneset sizes. Let us denote by N that sum: N is the total number of symbol occurrences in the database. The null hypothesis of our test (lack of information) is that the genesets have been constituted by independently including the different symbols. Under that null hypothesis, the probability that symbol numberj appears in geneset number i can be estimated by (nj×li)/N. Consider a set of k different symbols, labelled
j1,…,jk. If the appearances are assumed to be independent, the probability that the k symbols are found together in geneset i must be:
pi = (li/N)k (nj1×…×njk)
The total number of genesets where the group can be found is the sum over all genesets, of independent Bernoulli random variables with parameter pi: the i-th random variable is 1 if the
group is present in the i-th geneset (which occurs with probability pi ), 0 else. For k large enough and even for large
genesets, the probabilities pi are small. By the law of small
numbers [15], the distribution of the sum of a large number of Bernoulli random variables with small parameters can be approximated by a Poisson distribution, the parameter of which is the sum of all probabilities. The sum of all pi’s can be
interpreted here as the expected number of genesets the group should be found into, if symbol appearances were independent. Let us denote it by λ.
Assume now that the group of symbols j1,…,jk has been found in x different genesets. The p-value associated to this observation is the right tail probability at x (probability to be larger or equal to x) for the Poisson distribution with parameter λ. Observe that λ is proportional to each njh. So
when the frequency of symbols increases, λ increases too, and so does the tail probability for a given number of occurrences. This is why associations of very frequent symbols are considered less significant by the test.
all pairs containing symbol number j must be calculated: here is how the algorithm has been implemented. Firstly, the geneset sizes li , the symbol frequencies nj , the total number of
occurrences N , and the sum of squares Σ(li/N)2 can be
precalculated with negligible cost, using the function table of R. Then the database is reduced to those genesets containing symbol number j, making it much smaller. The reduced database is then analyzed: the symbols it contains are those which can be found together with symbol number j. The number of times they occur in the reduced database is the number of joint occurrences of the corresponding pair in the full database. The function table outputs a table of joint frequencies of pairs, labelled with those symbols paired with symbol number j. Using the precalculations, a table for the corresponding Poisson parameters λ is made and Poisson tail probabilities are calculated at low computing cost. This has been implemented in the function neighbor.symbols from the spa.r script available online. That function is repeatedly applied to all symbols in the function database.graph. Even for the largest databases available to us, its total execution time is of the order of the hour on a PC. The results can be repeatedly used for different graph structures, as will be explained in the next section. They can be automatically saved as a R data file and recalled for future use.
5.2. Association Graph
Once all pairwise p-values have been calculated, they are viewed as a weighted graph structure, symbols being taken as vertices of the graph. Observe that if two symbols cannot be found together in any geneset, the corresponding pairwise p-value is 1. Two symbols with a small pairwise p-value can be seen as neighbors: the smaller the p-value, the closer the neighbors.
Let h be chosen, positive and smaller than 0.05. Those pairwise p-values smaller than h define an undirected graph, called the association graph at threshold h. In that graph, two symbols are joined by an edge if the number of genesets were the pair can be found is significantly high at threshold h. The number of neighbors of a symbol, i.e. its degree in the graph, decreases as the threshold decreases.
For a small threshold h, it is natural to consider the cliques of the association graph at threshold h, i.e. groups of pairwise connected vertices [19, 20]. Any clique containing a given symbol, is necessarily included in the set of neighbors of that symbol. If the number of neighbors is relatively small (smaller than 100, say), then all maximal cliques in the set of neighbors can be listed by the Bron-Kerbosch algorithm in reasonable computer time [20]. The maximal.cliques function of the R package igraph by Csardi and Nepusz [28] was used.
Maximal cliques can then be tested to check whether they appear in a significant number of genesets as a whole. It is natural to complete all detected maximal cliques by those symbols appearing in the same genesets. Once all maximal cliques have been detected and completed, duplicates are eliminated, the association test is applied to each completed clique, and the results are returned as a list (cf. Additional files).
Acknowledgements
All authors acknowledge financial support from Laboratoire d’Excellence TOUCAN (Toulouse Cancer). They are indebted to Christophe Cazaux for the initial idea, and to Nadia Brauner for helpful discussions and references
Additional files
Additional material has been provided as a compressed directory available online: http://ljk.imag.fr/membres/Bernard.Ycart/publis/spa.tgz
References
[1] Schaefer CF: Pathway databases. Ann. N. Y. Acad. Sci. 2004, 1020:77–91.
[2] Cary M, Bader G, Sander C: Pathway information for systems biology. FEBS Lett 2005, 579:1815–1820.
[3] Kanehisha M, Goto S, Kawashima S, Okuno Y, Hattori M: The KEGG resource for deciphering the genome. Nucleic Acid Res. 2004, 32:270–280.
[4] Subramanian A, Tamayo P, Mootha VK, Mukherjee S, Ebert BL, Gillette MA, Paulovich A, Pomeroy SL, Golub TR, Lander ES, Mesirov JP: Gene set enrichment analysis: a knowledge-based approach for interpeting genome-wide expression profiles. Proc. Natl. Acad. Sci. USA 2005, 102(43):15545–15550.
[5] The Gene Ontology Consortium: Gene ontology: tool for the unification of biology. Nat. Genet 2000, 25:25–29.
[6] Jones S, Thornton J: Principles of protein-protein interactions. Proc. Natl. Acad. Sci. USA 1996, 93:13–20.
[7] De Las Rivas J, Fontanillo C: Protein-protein interactions essentials: key concepts to building and analyzing interactome networks. PLoS Comput. Biol 2010, 6(6):e1000808.
[8] Vidal M, Cisick ME, Barabasi AL: Interactome networks and human disease. Cell 2011, 144(6):986–998.
[9] Kirouac DC, Saez-Rodriguez J, Swantek J, Burke JM, Lauffenburger DA, Sorger PK: Creating and analyzing pathway and protein interaction compendia for modelling signal tranduction networks. BMC Systems Biology 2012, 6(29):1–18.
[10] Agrawal R, Imielski T, Swami A: Mining association rules between sets of items in large databases. In Proc. 1993 ACM-SIGMOD International Cofnerence on Management of Data, Volume 22 of SIGMOD Record. Edited by Buneman P, Jajodia S, ACM Press 1993:207–216.
[11] Goethals B: Frequent sets mining. In Data mining and knowledge discovery handbook, LNCS. Edited by Maimon OZ, Rokach L, Springer, Berlin 2005:377–398.
[12] Han J, Cheng H, Xin D, Yan X: Frequent pattern mining: current status and future directions. Data Min. Knowl. Disc. 2007, 15:55–86.
[14] de Graaf JM, de Menezes RX, Boer JM, Kosters WA: Frequent itemsets for genomic profiling. In CompLife05: Computational Life Sciences, Volume 3695 of LNCS, Springer, Berlin 2005:104–116.
[15] Janson S: Coupling and Poisson approximation. Acta Appl. Math. 1994, 34:7–15.
[16] Lee JK, Williams PD, Cheon S: Data Mining in Genomics. Clinics in Laboratory Medicine 2008, 28:145–166
[17] Eisen MB, Spellman PT, Brown PO, Botstein D: Cluster analysis and display of genome-wide expression patterns. Proc. Natl. Acad. Sci. USA 1998, 95(25):14863–14868.
[18] Hussain S, Hazarika G: Enhanced hierarchical clustering for genome databases. Int. J. Comp. Sci. Issues 2011, 4:245–250.
[19] Butenko S, Wilhelm WE: Clique-detection Models in Computational Biochemistry and Genomics. European J. of Operational Research 2006, 173:1–17.
[20] Harley E, Bonner A, Goodman N: Uniform integration of genome mapping data using intersection graphs. Bioinformatics 2001, 17(6):487–494
[21] R Development Core Team: R: A Language and Environment for Statistical Computing. R Foundation for Statistical
Computing, Vienna, Austria 2008, [http://www.R-project.org]. [ISBN 3-900051-07-0].
[22] Szkarczyk D, et al.: The STRING database in 2011: functional interaction networks of proteins, globally integrated and scored. Nucleic Acid Res. 2011, 39:D561–D568.
[23] Feng MY, Wang K, Shi QT, Yu XW, Geng JS: Gene expression profiling in TWIST-depleted gastric cancer cells. Anatomical Record 2009, 292:262–270
[24] Ohno S: Evolution by gene duplication. Springer-Verlag, New York 1970.
[25] Conant GC, Wolfe KH: Turning a hobby into a job; how duplicated genes find new functions. Nat. Rev. Genet. 2008, 9(12):938–950.
[26] Dittmar K, Liberles D: Evolution after gene duplication. Wiley-Blackwell, New York 2010.
[27] Hittinger CT, Carroll SB: Gene duplication and the adaptive evolution of a classic genetic switch. Nature 2007, 449(7163):677–681.