Anthropometric Data
Subinay Datta1, Mrinal Pal1, Anshuman De2
1 Department of Biochemistry, Burdwan Medical College, West Bengal
University of Health Sciences,West Bengal, Pin-713101 India
2 Department of Biochemistry, Malda Medical College, West Bengal University
of Health Sciences,West Bengal, Pin-713101 India
Submitted:3 Sep 2013
Accepted:7 Mar 2014
Abstract
Background: Hypovitaminosis D appears to parallel several cardiovascular and pulmonary
diseases. However, previous findings cannot be considered conclusive, since the association may have been confounded by different anthropometric variables that were not accounted for. The present cross-sectional study was conducted to investigate the association between important explanatory variables and circulation levels of vitamin D.
Methods: A total of 553 individuals attending the metabolic and medical lifestyle management
clinic of the Burdwan district of India were selected from 1289 people by simple random sampling, and information regarding relevant variables and their blood was obtained. Serum 25-hydroxyvitamin (OH) D level and forced expiratory volume in 1 second were measured. Associations between different explanatory variables and circulatory 25(OH) D were analysed in linear regression models.
Results: Of the population studied, 53% had insufficient vitamin D levels, while approximately
9% were vitamin D deficient. Variables that significantly associated with lower 25(OH)D levels were obesity, current smoking, forced expiratory volume 1 and depression.
Conclusion: Lower serum levels of vitamin D were associated with different variables that
should be explored in several diseases before a conclusion of hypovitaminosis D is drawn.
Keywords: vitamin D, confounding variables, vitamin D deficiency, obesity, 25(OH)D
Introduction
The role of vitamin D in calcium and bone homeostasis is well described. In recent years, it has been recognised that, in addition to this classical function, vitamin D modulates a variety of processes and regulatory systems, including host defence, inflammation, immunity, and repair (1). A low level of vitamin D in blood is common, and represents a major health problem. Early in life, vitamin D deficiency causes growth retardation and rickets, while it is well known to accelerate osteopenia and osteoporosis in adults. Accumulating evidence also links a low vitamin D nutritional status to highly prevalent chronic illnesses, including common cancers, autoimmune diseases, infectious diseases, cardiovascular diseases (2–4) and chronic obstructive pulmonary disease (COPD) (5). However, there is a need to examine the causal relationship between levels of vitamin D and different contributory variables. These facts prompted us to study the relationship between important variables, such as age > 50 years, female gender, obesity and underweight, seasonal variation, forced
expiratory volume (FEV)1 or depression and levels
of vitamin D. As 25-hydroxyvitamin (OH) D is the principal circulating vitamin D metabolite, and is recognised as the optimum short-term biomarker of total exposure to vitamin D (6), we measured this metabolite to detect vitamin D status.
Materials and Methods
Study area
The present study was conducted in the Department of Biochemistry of Burdwan Medical College, Burdwan, West Bengal, India, with the collaboration of a metabolic and medical lifestyle management clinic. All participants were recruited from the same geographical area of the northern and southern areas of the Burdwan district.
Selection of participants
had been received. Information regarding age, gender, smoking habits and history of depression were gathered. All participants who had been diagnosed with autoimmune diseases, COPD or cancer in the last 5 years were excluded.
Anthropometric measurements
Weight and height measurements were obtained using standardised techniques (7). Body mass index (BMI) was calculated as weight (kg) divided by the square of height (m2). The
participants were categorised as underweight (BMI < 18.5), normal (BMI 18.5–24.99), overweight (BMI 25.0–29.99) or obese (BMI 30.0 or more), according to the current World Health Organization classification.
Pulmonary function tests
Pulmonary function was measured by trained staff, both pre-and post-inhalation of 0.4 mg salbutamol, using a spirometer (HELIOS 401). As FEV1 is the most reproducible lung function
test parameter, it is the most suitable for the assessment of a large group of people. Spirometric values were post-bronchodilator measurements, and absolute values were expressed as percentage predicted of reference values (8).
Measurement of depression symptomatology
Depressive symptomatology was measured using the Centre for Epidemiologic Studies Depression Scale (CES-D), whereby a positive score of 16 or more defined depression (9).
Collection of samples
Peripheral venous blood was drawn and allowed to coagulate at room temperature for 30–45 min, and was then centrifuged at 2500x g for 15 min. All serum samples were stored at –70 °C until chemical analysis was performed.
Parameters assay
Serum 25(OH) D was estimated by enhanced chemiluminescent assay (ECI) using instrument VITROS ECi (Johnson & Johnson) and a dedicated reagent (10).
Statistical analysis
We performed standard statistical analysis on the data for biochemical analysis using the Statistical Package for Social Sciences (SPSS) 11.5 software for Windows. Serum concentrations of 25(OH)D were normally distributed. Differences in mean 25(OH)D by univariate predictors were examined with parametric tests. We analysed the relationship between study category and levels of
25(OH)D, by both linear and logistic regression, after adjusting for possible confounders, such as season, gender, age, BMI, smoking, and comorbidities. A cut off level for vitamin D deficiency was defined as 20 ng/mL for the logistic model. When building the regression models for the levels of vitamin D among the study population, we used a backward stepwise method for both the linear and logistic models. The following variables were included from the beginning; age, gender, BMI, food habits, FEV1, comorbidity, and CES-D score. Variables
remained in the model if their significance level was less than 0.10. After the first run, all excluded variables were reintroduced one at a time.
Results
The characteristics of the study population
Personal profile and clinical details of the study population are shown in table 1. Data are expressed as numbers (group percentages in parentheses) for categorical variables and mean values standard deviation (SD) for continuous variables. When variables were not normally distributed, median values (Q1–Q3 IQR in parentheses) are given instead (indicated by †); IQR means interquartile range. Pack-years were expressed as the numbers of packs of cigarette smoked per day x the number of years the person has or had smoked. Quit-years were the number of years since a patient had stopped smoking.
Distribution of concentration of serum 25(OH)D among study population
The median serum 25(OH) D level of the study population was 26 ng/mL. On the basis of changes in parathyroid hormone levels and intestinal calcium transport that have been noted, values of 20–30 ng/mL are considered to be vitamin D relatively insufficient (4), while deficient serum levels are < 20 ng/mL (11) and desirable (or sufficient) circulating vitamin D levels are at least 30–40 ng/mL (4,12,13). However, there are suggestions that levels above 40 ng/mL may be necessary for optimal immune functioning and overall health (14–16). In the present study, almost 53% of the population had vitamin D levels in the insufficient range, and approximately 9% were vitamin D deficient (< 20 ng/mL), as shown in figure 1.
Factors associated with 25(OH)D in the study population - univariate analysis
Table 1: Personal profile and clinical details of the study population
Demographic profiles Number (%) ( n = 552) Age (44 ± 7.14)
< 50 years (32 ± 7.83) 282 (51) > 50 years (57 ± 6.31) 270 (49) Gender
Male 319 (58)
Female 233 (42)
BMI (kg/m2) (23.56 ± 5.83)
< 18.5 22 (4)
18.5–24.9 315 (57)
25–30 160 (29)
> 30 55 (10)
Smoking habits
Never 121 (22)
Ex-smoker 188 (34)
Current smoker 243 (44) Pack-years† 39 (30–52)
Quit-years 1 (0–8)
Depression, CES-D score ≥ 16
Yes 28 (5)
Season#
Winter 88 (16)
Spring 116 (21)
Summer 304 (55)
Autumn 44 (8)
Food habits
Vegetarian 265 (48)
Non-vegetarian 287 (52)
#Season was defined as winter (December-March), spring
(April-May), summer (June-September) and autumn (October–November).
*FEV1: Forced expiratory volume in 1 second that is
expressed in % of VC.
Abbreviations: BMI = body mass index; CES-D = Centre for Epidemiologic Studies Depression Scale.
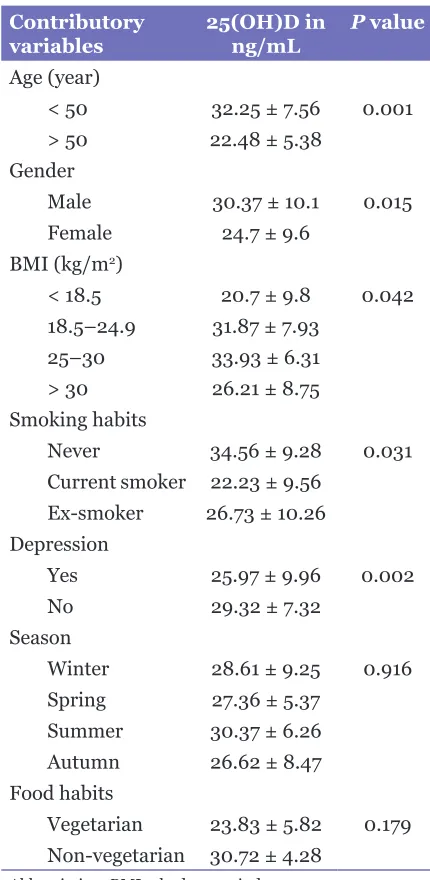
Table 2: Serum concentration of 25(OH)D
in ng/mL, for different confounding variables
Contributory
variables 25(OH)D in ng/mL P value Age (year)
< 50 32.25 ± 7.56 0.001 > 50 22.48 ± 5.38
Gender
Male 30.37 ± 10.1 0.015 Female 24.7 ± 9.6
BMI (kg/m2)
< 18.5 20.7 ± 9.8 0.042 18.5–24.9 31.87 ± 7.93
25–30 33.93 ± 6.31 > 30 26.21 ± 8.75 Smoking habits
Never 34.56 ± 9.28 0.031 Current smoker 22.23 ± 9.56
Ex-smoker 26.73 ± 10.26 Depression
Yes 25.97 ± 9.96 0.002
No 29.32 ± 7.32
Season
Winter 28.61 ± 9.25 0.916 Spring 27.36 ± 5.37
Summer 30.37 ± 6.26 Autumn 26.62 ± 8.47 Food habits
Vegetarian 23.83 ± 5.82 0.179 Non-vegetarian 30.72 ± 4.28
Abbreviation: BMI = body mass index. are shown in table 2. Age > 50 years, female gender,
obesity and underweight, seasonal variation or depression were all associated with significantly lower levels of serum 25(OH)D. Seasonal variation of serum 25(OH)D3 was defined as the difference between winter and summer values (17).
Factors associated with 25(OH)D in the study population – multivariate analysis
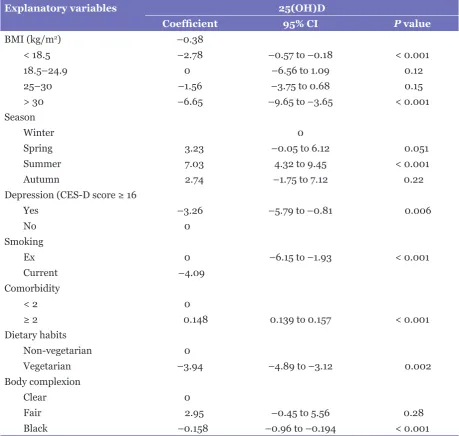
Table 3: Multiple linear regression analysis showing the relationship between baseline predictors and serum levels of 25(OH)D
Explanatory variables 25(OH)D
Coefficient 95% CI P value
BMI (kg/m2) –0.38
< 18.5 –2.78 –0.57 to –0.18 < 0.001
18.5–24.9 0 –6.56 to 1.09 0.12
25–30 –1.56 –3.75 to 0.68 0.15
> 30 –6.65 –9.65 to –3.65 < 0.001
Season
Winter 0
Spring 3.23 –0.05 to 6.12 0.051
Summer 7.03 4.32 to 9.45 < 0.001
Autumn 2.74 –1.75 to 7.12 0.22
Depression (CES-D score ≥ 16
Yes –3.26 –5.79 to –0.81 0.006
No 0
Smoking
Ex 0 –6.15 to –1.93 < 0.001
Current –4.09
Comorbidity
< 2 0
≥ 2 0.148 0.139 to 0.157 < 0.001
Dietary habits
Non-vegetarian 0
Vegetarian –3.94 –4.89 to –3.12 0.002
Body complexion
Clear 0
Fair 2.95 –0.45 to 5.56 0.28
Black –0.158 –0.96 to –0.194 < 0.001
Abbreviations: BMI = body mass index; CES-D = Centre for Epidemiologic Studies Depression Scale; CI = confidence interval; P value is statistically significant (P < 0.05).
levels of 25(OH)D remained reduced in serum, even after adjustment, as shown in tables 3 and 4.
Discussion
Vitamin D deficiency causes the development of imbalanced calcium- and phosphate-homeostasis, as well as the bone diseases osteopenia, osteoporosis, rickets, and osteomalacia, with a subsequently increased fracture risk (18). In order to identify the different important predicting variables of circulating
Figure 1: Bar chart of serum 25(OH)D
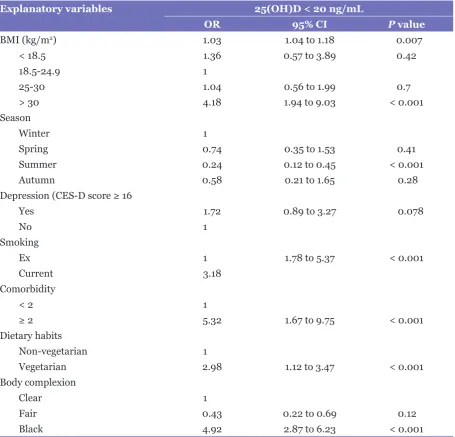
Table 4: Multiple logistic regression analysis showing the relationship between baseline predictors and serum levels of 25(OH)D
Explanatory variables 25(OH)D < 20 ng/mL
OR 95% CI P value
BMI (kg/m2) 1.03 1.04 to 1.18 0.007
< 18.5 1.36 0.57 to 3.89 0.42
18.5-24.9 1
25-30 1.04 0.56 to 1.99 0.7
> 30 4.18 1.94 to 9.03 < 0.001
Season
Winter 1
Spring 0.74 0.35 to 1.53 0.41
Summer 0.24 0.12 to 0.45 < 0.001
Autumn 0.58 0.21 to 1.65 0.28
Depression (CES-D score ≥ 16
Yes 1.72 0.89 to 3.27 0.078
No 1
Smoking
Ex 1 1.78 to 5.37 < 0.001
Current 3.18
Comorbidity
< 2 1
≥ 2 5.32 1.67 to 9.75 < 0.001
Dietary habits
Non-vegetarian 1
Vegetarian 2.98 1.12 to 3.47 < 0.001
Body complexion
Clear 1
Fair 0.43 0.22 to 0.69 0.12
Black 4.92 2.87 to 6.23 < 0.001
Abbreviations: BMI = body mass index; CES-D = Centre for Epidemiologic Studies Depression Scale. vitamin D, we analysed the association of
these variables with 25(OH) D levels. Age is an important predictor of circulating vitamin D levels; we found that aged individuals possessed a lower amount of this vitamin. Vitamin D synthesis occurs in the skin in response to light, but this decreases in efficiency with increasing age (19).
Since the levels of several hormones, including sex hormones, can be modified by vitamin D (20,21) it is not surprising that women had lower levels of vitamin D in serum than did men in the present study. On average, men have 10–15% less fat content than women with the
in men and positive in women (25). In women, DBP was significantly higher than in men, and correlated positively with total 25(OH)D (17).
Adiposity and BMI in non-morbidly obese individuals are also inversely correlated with vitamin D status. A previous study found that the association between adiposity and serum 25(OH) D is greater than that between body weight and BMI (26). This may be because BMI and body weight do not necessarily reflect the percentage of body fat. Athletes and other well-trained people may have a relatively high BMI, and may be considered overweight, or even obese, but they have quite a low total fat mass (27). Outdoor activity may reduce the risk of hypovitaminosis D by 50%, but severely obese people may be outdoors less often, because they have limited mobility (28,29). A possible explanation for obesity-associated vitamin D insufficiency is a decreased bioavailability of 25(OH)D3, as body fat may act as a reservoir for storage of the fat-soluble vitamin D, reducing its bioavailability (23). A negative correlation between serum 25(OH)D levels and magnitude of weight loss in patients after surgical treatment for morbid obesity confirms this theory (24,30). A contributory factor to the low vitamin D status among obese people might be a lower than average exposure to the sun of large body areas. It is assumed that secondary hyperparathyroidism, observed frequently in overweight and obese populations (31), may be the result of low serum 25(OH)D levels.
Season was not a strong predictor of 25(OH) D levels in our study. Vitamin D is a fat-soluble vitamin, so it can be stored in the body and might be minimally affected by seasonal variation. Cigarette smoking is also a potential explanatory variable of vitamin D concentration; we found that concentration was significantly reduced in smokers. Current smokers primarily exhibit increased skin aging induced by smoking (32) and this leads to a reduced capacity for synthesis vitamin D in aging skin (1). Nevertheless, the study could not excluded the racial effect on vitamin D level and further study is needed to confirm the fact.
In accordance with several previous studies, we found an increased prevalence of vitamin D deficiency in participants with depression (29,33) or depressive symptoms (34). This is most likely due to patients with depression typically spending less time outdoors, being careless regarding their food intake and having less physical activity.
After adjustment, it was clearly demonstrated that all the individual variables were separately responsible for a low level of vitamin D level in
the serum of the participants.
Conclusion
Several confounding variables (such as age, gender, food habits, nutritional status, mental status of individual, smoking habits, and lung function) affect circulating levels of vitamin D, and these have strong individual causal relationships with regard to reducing these levels in blood in the normal population. Therefore, the lower serum level of vitamin D that is associated with different variables should be explored before drawing a conclusion of hypovitaminosis D in several diseases.
Acknowledgements
The authors are thankful to Dr Tarashankar Malik of Burdwan Medical College and Hospital for technical support.
Conflict of Interests
None.
Funds
None.
Authors’ Contributions
Conception and design: SD
Analysis and interpretation of the data and final approval of the article: MP
Critical revision of the article for the important intellectual content: SD, MP, AD
Corresponding Author
Dr Mrinal Pal
MBBS (Calcutta University) MD Biochemistry (West Bengal University of Health Sciences)
115 Pirpukur
Kalna Road, Burdwan West Bengal
India, Pin-713101 Tel: +090-0759 3545 Fax: +034-2-266 5577
Email: mrinalpal77@rediffmail.com
References
2. Bouillon R, Bischoff-Ferrari H, Willett W. Vitamin D and health: perspectives from mice and man. J Bone Miner Res. 2008;23(7):974–979. doi: 10.1359/ jbmr.080420.
3. Bouillon R, Carmeliet G, Verlinden L, van Etten E, Verstuyf A, Luderer HF, et al. Vitamin D and human health: lessons from vitamin D receptor null mice. Endocr Rev. 2008;29(6):726–776. doi: 10.1210/ er.2008-0004.
4. Holick MF. Vitamin D deficiency. N Engl J
Med. 2007;357(3):266–281. doi: 10.1056/
NEJMra070553.
5. Janssens W, Lehouck A, Carremans C, Bouillon R, Matheiu C, Decramer M, et al. Vitamin D beyond bones in chronic obstructive pulmonary disease: time to act. Am J Respir Crit Care Med. 2009;179(8):630– 636. doi: /pdf/10.1164/rccm.200810-1576PP.
6. Millen AE, Bodnar LM. Vitamin D assessment in population-based studies: a review of the issues. Am J Clin Nutr. 2008;87(4):1102S–1105S.
7. Deepa M, Pradeepa R, Rema M, Mohan A, Deepa R, Shanthi Rani S, Mohan V. The Chennai Urban Rural Epidemiology Study (CURES): Study design and Methodology ( Urban component ) CURES -1. J Assoc Phys India. 2003;51:863–870.
8. Quanjer PH, Tammeling GJ, Cotes JE, Pedersen OF, Peslin R, Yernault JC. Lung volumes and forced ventilatory flows. Report of the Working Party Standardization of Lung Function Tests, European Community for Steel and Coal. Official Statement of the European Respiratory Society. Eur Respir J Suppl. 1993;16:5–40.
9. Radloff LS. The CES-D Scale: A Self-Report Depression Scale for Research in the General Population. App Psych Meas. 1977;1(3):385–401. doi:10.1177/014662167700100306.
10. Wagner D, Hanwell HEC, Vieth R. An evaluation of automated methods for measurement of serum 25-hydroxyvitamin D. Clin Biochem. 2009;42:1549– 1556.
11. Lips P. Vitamin D deficiency and secondary hyperparathyroidism in the elderly: consequences for bone loss and fractures and therapeutic implications. Endocr Rev. 2001;22(4):477-501. doi: /full/10.1210/ edrv.22.4.0437.
12. Vieth R, Bischoff-Ferrari H, Boucher BJ, Dawson-Hughes B, Garland CF, Heaney RP, et al. The urgent need to recommend an intake of vitamin D that is effective. Am J Clin Nutr. 2007;85(3):649–650.
13. Bischoff-Ferrari HA, Giovannucci E, Willett WC, Dietrich T, Dawson-Hughes B. Estimation of optimal serum concentrations of 25-hydroxyvitamin D for multiple health outcomes. Am J Clin Nutr. 2006;84(1):18–28.
14. Taback SP, Simons FE. Anaphylaxis and vitamin D: A role for the sunshine hormone? J Allergy Clin Immunol. 2007;120(1):128–130.
15. Hollis BW, Wagner CL, Drezner MK, Binkley NC. Circulating vitamin D(3) and 25-hydroxyvitamin D in humans: An important tool to define adequate nutritional vitamin D status. J Steroid Biochem Mol Biol. 2007;103(3–5):631–634.
16. Augusto A, Litonjua, MD. Childhood asthma may be a consequence of vitamin D deficiency. Curr Opin Allergy Clin Immunol. 2009;9(3):202–207. doi: 10.1097/ACI.0b013e32832b36cd.
17. Lagunova Z, Porojnicu AC, Lindberg F, Hexeberg S, Moan J. The Dependency of vitamin D status on body mass index, gender, age and season. Anticancer res. 2009;29(9):3713–3720.
18. Holick MF, Chen TC. Vitamin D deficiency: a worldwide problem with health consequences. Am J Clin Nutr. 2008;87(4):1080S–1086S.
19. MacLaughlin J, Holick MF. Aging decreases the capacity of human skin to produce vitamin D3. J Clin Invest. 1985;76(4):1536–1538. doi: 10.1172/ JCI112134.
20. Reinehr T, de SG, Alexy U, Kersting M, Andler W. Vitamin D status and parathyroid hormone in obese children before and after weight loss. Eur J Endocrinol. 2007;157:225–232. doi: 10.1530/EJE-07-0188.
21. Barrera D, Avila E, Hernandez G, Halhali A, Biruete B, Larrea F, Diaz L. Estradiol and progesterone synthesis in human placenta is stimulated by calcitriol. J Steroid Biochem Mol Biol. 2007;103(3–5):529–532.
22. Gallagher D, Heymsfield SB, Heo M, Jebb SA, Murgatroyd PR, Sakamoto Y. Healthy percentage body fat ranges: an approach for developing guidelines based on body mass index. Am J Clin Nutr. 2000;72(3):694–701.
23. Wortsman J, Matsuoka LY, Chen TC, Lu Z, Holick MF. Decreased bioavailability of vitamin D in obesity. Am J Clin Nutr. 2000;72(3):690–693.
24. Rosenstreich SJ, Rich C, Volwiler W. Deposition in and release of vitamin D3 from body fat: evidence for a storage site in the rat. J Clin Invest. 1971;50:679– 687. doi: 10.1172/JCI106538.
25. Bolland MJ, Grey AB, Ames RW, Horne AM, Mason BH, Wattie DJ, et al. Age-, gender-, and weight-related effects on levels of 25-hydroxyvitamin D are not mediated by vitamin D-binding protein. Clin Endocrinol (Oxf). 2007;67(2):259–264. doi: 10.1111/j.1365-2265.2007.02873.x.
26. Arunabh S, Pollack S, Yeh J, Aloia JF. Body fat content and 25-hydroxyvitamin D levels in healthy women. J Clin Endocrinol Metab. 2003;88(1):157–161. doi: org/10.1210/jc.2002-020978.
28. Florez H, Martinez R, Chacra W, Strickman-Stein N, Levis S. Outdoor exercise reduces the risk of hypovitaminosis D in the obese. J Steroid Biochem Mol Biol. 2007;103(3–5):679–681.
29. Jorde R, Sneve M, Figenschau Y, Svartberg J, Waterloo K. Effects of vitamin D supplementation on symptoms of depression in overweight and obese subjects: randomized double blind trial. J Intern Med. 2008;264(6):599–609. doi: 10.1111/j.1365-27 96.2008.02008.x.
30. Abbasi AA, Amin M, Smiertka JK, Grunberger G, MacPherson B, Hares M, et al. Abnormalities of vitamin D and calcium metabolism after surgical treatment of morbid obesity: a study of 136 patients. Endocr Pract. 2007;13(2):131–136.
31. Janssens W, Bouillon R, Claes B, Carremans C, Lehouck A, Buysschaert I, et al. Vitamin D deficiency is highly prevalent in COPD and correlates with variants in the vitamin D-binding gene. Thorax. 2010;65(3):215–220. doi: 10.1136/thx.2009.120659.
32. Stewart R, Hirani V. Relationship between vitamin D levels and depressive symptoms in older residents from a national survey population. Psychosom Med. 2010; 72(7):608–612. doi: 10.1097/PSY. 0b013e3181e9bf15.