| | 319 © ARCHIVES OF BUDO | SCIENCE OF MARTIAL ARTS
The use of k-means method for assessment of
training and differences in motor abilities indices
in judo contestants at different age
Grzegorz Lech
1ABCDE, Wiesław Chwała
2ABCDE,
Anna Tyka
3BD, Tomasz Pałka
4BD,
Janusz Jaworski
1BD,
Wanda Pilch
5BD, Tadeusz Ambroży
6BD, Dariusz Mucha
4BD1
Department of Theory of Sport and Kinesiology, Institute of Sport Sciences, Faculty of Physical Education and Sport,
University of Physical Education, Cracow, Poland
2
Department of Biomechanics, Faculty of Physical Education and Sports, University of Physical Education, Cracow, Poland
3Department of Recreation and Biological Regeneration, Faculty of Tourism and Leisure, University of Physical Education,
Cracow, Poland
4
Department of Physiology and Biochemistry, Faculty of Physical Education and Sports, University of Physical Education,
Cracow, Poland
5
Department of Physiotherapy, Faculty of Rehabilitation, University of Physical Education, Cracow, Poland
6
Department of Gymnastics and Dance, Institute of Sport Sciences, Faculty of Physical Education and Sport,
University of Physical Education in Cracow, Poland
Source of support: Departmental sources
Received: 09 June 2012; Accepted:
30 June 2015;
Published online:
14 October 2015
ICID: 1182609
Abstract
Background & Study Aim:
Elementary coordinated motor abilities usually exhibit typical stages of development i.e. the progressive stage, relative stabilization and regression. Dynamic development occurs until 16-18 years of age, followed by a long period of relative stabilization that takes until the age of 40 to 50 years. These regularities relate to the population which is not actively involved in physical activity (sports). It remains unknown what is the dynamics of changes in the above abilities in elite judo athletes. The aim of the study was the usefulness of the k-means method (tax-onomy) in identifying the differences in motor abilities indices’ profile in judo contestants at different age.Material & Methods:
Twenty five judo contestants were examined. The selection of the subjects considered their age, competition experience, weight category and sports level.During the final phase of the competitive season laboratory tests were used to measure the level of coordi-nated motor abilities (a battery of computer tests and balance measurement), speed (Wingate test), strength (muscle torque measurements) and endurance (graded exercise test).
Results:
Interpretation of the results revealed that three cadets had a profile and level of motor abilities typical of ju-nior competitors. Level of motor abilities in one cadet was evaluated as corresponding to seju-nior level. One junior athlete exhibited motor abilities typical of cadets’ level. When comparing the methods of determina-tion the differences in the level of motor abilities indices, the method of k-means showed 19 statistically sig-nificant differences. One-way analysis of variance with age as an independent variable revealed statistically significant differences in 16 cases. The statistically significant differences in both methods were found in the same 14 indices. However, only 6 cases showed the same correlation.Conclusions: The method of k-means differentiates the athletes to higher extent than the analysis of variance with age as an inde-pendent variable. This method allows to evaluate motor development (specificity oftraining) in individual athletes.
Key words: combat sports · competition experience · ontogenesis · sports level · taxonomy
Corresponding author: Anna Tyka, Department of Recreation and Biological Regeneration, University of Physical Education, al. Jana Pawła II 78, 31-571 Krakow, Poland; e-mail: [email protected]
Authors’ Contribution: A Study Design B Data Collection C Statistical Analysis D Manuscript Preparation E Funds Collection
I
ntroductIonVariability of motor abilities level in ontogene-sis shows specific patterns. Elementary coordinated motor abilities usually exhibit typical stages of devel-opment i.e. the progressive stage, relative stabilization and regression. In general, it can be concluded from population-based studies [1] that a dynamic devel-opment occurs until 16-18 years of age, followed by a long period of relative stabilization that takes until the age of 40 to 50 years. Anaerobic capacity (speed abilities), determined as a ratio of peak power to body mass unit, i.e. relative peak power (RPP), increases gradually throughout the development period. At the age of 10–12 years, this index is almost twice higher than in 7-year-old children. Progression in RPP maintains until the age of 30 years, followed by a tendency to reduce by 6% on average every 10 years [2-4]. The lowest values of this index are reported in boys before 10 years of age (RPP of 6.7 to 7.2 W.kg-1)
and the highest at the age between 25 and 35 (9.4– 9.8 W.kg-1) [5].
Development of muscular force at the young age is synchronized with somatic development and exhibits a distinct acceleration at the period of growth spurt. Maximum strength abilities can be obtained at the age of 20 to 30 years. After reaching maximum level of strength abilities, it remains steady until 40 to 50 years of age [6] and it declines gradually, depend-ing on physical activity [7]. Almost 50% decrease in strength can be observed above 70 years of age com-pared to its maximum level [8].
Aerobic capacity (endurance skills), where a gen-erally accepted measure is maximal oxygen uptake, does not change considerably during the develop-ment period. Only global levels of maximal oxygen uptake are increased at this age, with the most signif-icant increments occurring until 15 to 16 years of age and then they become lower. The highest increments converge with the peak of the body height’s growth spurt. Next, the oxygen uptake remains steady for sev-eral years and, since 30 years of age, it starts being reduced by ca. 0.75% a year [9-11]. These regularities relate to the population which is not actively involved in physical activity (sports). It remains unknown what is the dynamics of changes in the above abilities in elite judo athletes.
The solution to this problem seems to be relatively easy. It suffices to use a one-way analysis of ance with age as an independent (grouping) vari-able. However, when examining high-level athletes, researchers are often forced to draw conclusions from
a small number of cases. The results of these anal-yses might be misleading because the outliers have significant effect on the mean. At the first stage, it seems to be a more objective approach to group the athletes according to the profile of indices of motor abilities and then to determine intergroup differences. Interpretation of the results at the level of object clas-sification will allow for assessment of training effects, whereas at the level of intergroup differences, it can be used to determine the dynamics of changes in athletes at different age. Comparison of the results obtained from one-way analysis of variance with chronologi-cal age as an independent variable and the method which consists in grouping the subjects according to the level of motor abilities regardless of the age allows for the assessment of the methods used in the study.
The aim of the study was the usefulness of the k-means method (taxonomy) in identifying the dif-ferences in motor abilities indices’ profile in judo con-testants at different age.
The principal aim of the study was to provide answer to the following questions:
• Can the athletes studied be divided into the groups with similar profile of indices of motor abilities? • Are there significant differences between the profiles
of indices of motor abilities typical of each group? • Does the method of k-means produce different
results compared to one-way analysis of variance with age as an independent variable?
M
aterIalandM
ethodsThe subjects were 25 judoists of different age. They were the members of the following clubs: Czarni Bytom, Wisła Kraków, MOSiR Bochnia, Sokół Myślenice, Jordan Kraków and UKS Judo Wolbrom, all situated in southern Poland. The selection crite-ria used in the study included subjects’ chronological age, competition experience, weight category (the two lightest and the heaviest categories were not included) and sports level (each of the subjects had scored at least fifth place in national tournaments). Table 1 presents characteristics of chronological age, training experience and participants’ basic body build indica-tors. The experiment was approved by the Bioethics Committee at the Regional Medical Chamber in Cracow, Poland and given no 42/KBL/OIL/2006.
Examinations in individual age groups (seniors: on 29th and 30th September 2006; juniors: on 9th and 10th November 2007; cadets: on 3rd and 5th May 2008)
Combat sports – the group of
sports disciplines, in which the gist of the competition is the direct clash of two competing athletes They are affiliated to the national and international sports organizations in order to carry out official competition, classification, etc.
Competition experience - skills
acquired through participation in contests
Ontogenesis – development of
an individual organism from the moment of conception to death
Sports level – ranked nationally
or internationally, on the basis of points obtained in the official tournaments
Taxonomy - the branch of
science dealing with methods and principles of classification
Table 1. Chronological age, competitive experience and basic variables of somatic build of study participants
Variable Seniors (1) Juniors (2) Cadets (3)
N
x
± SD min-max Nx
± SD min-max Nx
± SD min-maxAge (years) 7 21.9± 0.99 20-24 10 17.4±0.73 16-18 8 15.4±0.55 15-16
Experience (years) 7 12.6±1.76 10-14 10 8.5±1.18 8-11 8 6.0±0.81 4-7
Body height (cm) 7 180.2±5.39 171-188 10 180.5±3.70 172-185 8 177.1±6.25 170-186
Body mass (kg) 7 82.9±6.62 71.0-92.1 10 85.4±10.45 72.1-101.1 8 71.6±7.50 56.4-82.0
Lean body mass (kg) 7 74.1±6.20 65.6-82.5 10 72.3±5.49 64.6-78.9 8 65.3±6.25 52.2-73.0
Table 2. Basic coordination motor abilities tested in the study
Test No Variable/index Unit
Balance 1 Number of attempts to stand on the beam n Ability to differentiate movements 2 Kinaesthetic differentiation – anticipation pixel
Frequency of movements 3 Hand movements frequency (tapping) n
Reaction time
4 Minimum reaction time (visual stimulus) ms 5 Mean reaction time (visual stimulus) ms 6 Maximum reaction time (visual stimulus) ms 7 Minimum reaction time (auditory stimulus) ms 8 Mean reaction time (auditory stimulus) ms 9 Maximum reaction time (auditory stimulus) ms 10 Minimum complex reaction time ms 11 Mean complex reaction time ms 12 Maximum complex reaction time ms Rhythmization ability 13 Movement rhythmization ms
Speed, accuracy and precision of movements
14 Labyrinth to the left s
15 Labyrinth to the right s
16 Labyrinth to the left / mistakes n 17 Labyrinth to the right / mistakes n
Motor adjustment 18 Difference between the direction to the right and to the left s 19 Difference between the direction to the right and to the left / mistakes n
Visual-motor coordination
20 Optional s
21 Forced / errors n
22 Forced / correct n
23 Eye-hand coordination s
24 Eye-hand coordination / mistakes n
Spatial orientation 25 Optional s
26 Optional /errors n
Reaction to moving objects 27 Forced / correct n
28 Forced / errors n
were scheduled so that the level of motor abilities could be evaluated during the final phase of competitive period of the macrocycle training. They were carried out in two-day cycles in the morning. On the first two-day, the level of coordinated motor abilities was determined and then the Wingate test was carried out. On the second day, the muscle torques were measured and the graded exer-cise test was conducted.
A computer test battery developed by Jaworski et al. [12] was used for the examinations of coordinated motor abilities. A detailed description of the method was pro-vided by the study by Lech et al. [13]. Furthermore, balance was measured using Flamingo Balance Test, according to the Eurofit test battery [14]. Table 2 pres-ents the coordinated motor abilities tested in the study, with their indices and units.
Exercise tests were carried out in the Department of Physiology and Biochemistry at the University School of Physical Education in Cracow, Poland. Biometrical measurements [body height (BH) and body mass (BM)] and structural determinations [fat percentage (PF), fat mass (FM) and lean body mass (LBM)] were also carried out. Speed abilities were
evaluated by means of Wingate test [15]. Table 3 con-tains the results obtained during the above tests.
The muscle torque measurements were carried out in the Department of Biomechanics at the University School of Physical Education in Cracow, Poland. They included measurements of maximum muscle torques in trunk flexors and extensors and shoulder, elbow, hip and knee joints. Based on these values, the authors calculated relative muscle torques (Table 4). Detailed description of this method is contained in the study by Sterkowicz et al. [16].
Evaluation of endurance abilities level was carried out based on the results obtained in the graded exercise test. A detailed description is contained in the studies by Lech et al. [17] and Lech et al. [18]. Table 5 pres-ents the results obtained during the measurement of endurance abilities.
s
tatIstIcala
nalysIsStatistica PL software was used for the analysis of the
results. In order to identify athletes with similar pro-file of motor abilities, of k-means method was used. Table 3. Indices of speed abilities
No. Variable/index Unit
29 TW (total work) J.kg–1
30 RPP (relative peak power) W.kg–1
31 FI (fatigue index) %
32 toPP (time to obtain peak power) s
33 tuPP (time of maintaining peak power) s
34 La (lactate level) after Wingate test mmol·L–1
Table 4. Indices of strength abilities
No. Variable/index Unit
35 EF (elbow flexors) Nm/kg 36 EE (elbow extensors) Nm/kg 37 AF (arm flexors) Nm/kg 38 AE (arm extensors) Nm/kg 39 KF (knee flexors) Nm/kg 40 KE (knee extensors) Nm/kg 41 HF (hip flexors) Nm/kg 42 HE (hip extensors) Nm/kg 43 TF (trunk flexors) Nm/kg 44 TE (trunk extensors) Nm/kg
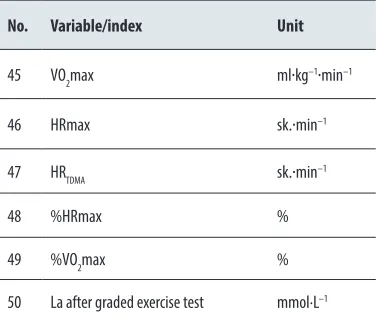
Table 5. Indices of endurance abilities
No. Variable/index Unit
45 VO2max ml·kg–1·min–1
46 HRmax sk.·min–1
47 HRTDMA sk.·min–1
48 %HRmax %
49 %VO2max %
50 La after graded exercise test mmol·L–1
This method allows for ordering and object classifi-cation (taxonomy). It allows for creation of k clusters that differ from each other to highest possible extent. In terms of calculations, the method can be treated as the opposite of the analysis of variance [19]. The sta-tistical analysis in the present study was carried out for k = 3. Group identification was carried out with respect to the number of athletes from individual age groups.
Depending on the distribution and homogeneity of variance, either Kruskal-Wallis F or H tests were used. The differences between the means in individ-ual groups were analysed using Tukey’s HSD test for unequal samples and Mann-Whitney U test. A Bonferroni correction was used in the Mann-Whitney U test: it consisted in dividing the level of significance p = 0.05 by the number of comparisons (Wilcox 1987). Normal distribution was tested by Shapiro-Wilk W test. The homogeneity of variance was verified by means of Levene’s test [20].
r
esultsBased on the cluster analysis (for k = 3), the first clus-ter was composed of 9 juniors and three cadets (called junior group); the second cluster: 7 seniors and one cadet (senior group); the third cluster: 4 cadets and one junior (cadet group). Identification of groups was carried out in consideration for the number of ath-letes from individual age groups. The first cluster was dominated by juniors, the second one by seniors and the third one by cadets. Figure 1 presents a chart for standardized means for each cluster.
Analysis of the differences between the groups of ath-letes in terms of the indices of motor abilities found 19 statistically significant differences. In terms of coor-dinated motor abilities, the differences were found in 6 indices (Table 6). In the case of minimal time or com-plex reaction (index No. 10), Tukey’s procedure allowed for identification of a homogeneous group formed by the values of indices in the first and third clusters.
Comparison of the means reveals that significantly lower mean value of this index occurred in the first and third clusters (better results), whereas it was higher in the second cluster.
Comparison of means for the time of ‘labyrinth to the left’ test (index No. 14) allowed for formation of the following homogeneous groups:
• the first and second clusters, • the second and third clusters.
Based on the above, it was found that the lowest mean value of this index occurred in the first cluster (the best). It differed statistically from the mean for the third cluster, where it was the highest.
Comparison of each pair of mean time of performing the visual-motor coordination (optional) test (index No. 20) revealed that significantly lower means for this index occurred in the first and second (better) clusters whereas higher values were found in the third cluster. The homogeneous groups were formed by the values of indices in the first and second cluster. Figure 1. Standardized means for each cluster
Comparison of next pairs of performance mean time in the spatial orientation test (optional, index No. 25) allowed to identify the homogeneous groups formed by:
• the first and second clusters, • the second and third clusters.
Therefore, it can be concluded that the lowest mean value of index occurred in the first cluster (the best result), whereas the highest value was in the third cluster.
Comparison of individual pairs of means for the number of correct reactions in the test of ‘reaction to moving objects’ (index 27) revealed that significantly higher mean occurred in the first cluster whereas lower values were in the second and third clusters. A homogeneous group was formed by the values of indices in the second and third cluster.
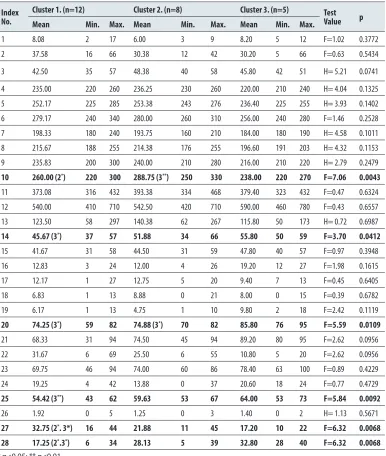
In terms of the number of errors in the test of ‘reac-tion to moving objects’ (index No. 28) using Tukey’s procedure it was found that significantly lower means occurred for the first cluster whereas higher values Table 6. Mean indices of basic coordinated motor abilities in groups of judoathletes with similar motor abilities profile
Index No.
Cluster 1. (n=12) Cluster 2. (n=8) Cluster 3. (n=5) Test Value p Mean Min. Max. Mean Min. Max. Mean Min. Max.
1 8.08 2 17 6.00 3 9 8.20 5 12 F=1.02 0.3772
2 37.58 16 66 30.38 12 42 30.20 5 66 F=0.63 0.5434
3 42.50 35 57 48.38 40 58 45.80 42 51 H= 5.21 0.0741 4 235.00 220 260 236.25 230 260 220.00 210 240 H= 4.04 0.1325 5 252.17 225 285 253.38 243 276 236.40 225 255 H= 3.93 0.1402 6 279.17 240 340 280.00 260 310 256.00 240 280 F=1.46 0.2528 7 198.33 180 240 193.75 160 210 184.00 180 190 H= 4.58 0.1011 8 215.67 188 255 214.38 176 255 196.60 191 203 H= 4.32 0.1153 9 235.83 200 300 240.00 210 280 216.00 210 220 H= 2.79 0.2479
10 260.00 (2*) 220 300 288.75 (3**) 250 330 238.00 220 270 F=7.06 0.0043
11 373.08 316 432 393.38 334 468 379.40 323 432 F=0.47 0.6324 12 540.00 410 710 542.50 420 710 590.00 460 780 F=0.43 0.6557 13 123.50 58 297 140.38 62 267 115.80 50 173 H= 0.72 0.6987
14 45.67 (3*) 37 57 51.88 34 66 55.80 50 59 F=3.70 0.0412
15 41.67 31 58 44.50 31 59 47.80 40 57 F=0.97 0.3948
16 12.83 3 24 12.00 4 26 19.20 12 27 F=1.98 0.1615
17 12.17 1 27 12.75 5 20 9.40 7 13 F=0.45 0.6405
18 6.83 1 13 8.88 0 21 8.00 0 15 F=0.39 0.6782
19 6.17 1 13 4.75 1 10 9.80 2 18 F=2.42 0.1119
20 74.25 (3*) 59 82 74.88 (3*) 70 82 85.80 76 95 F=5.59 0.0109
21 68.33 31 94 74.50 45 94 89.20 80 95 F=2.62 0.0956
22 31.67 6 69 25.50 6 55 10.80 5 20 F=2.62 0.0956
23 69.75 46 94 74.00 60 86 78.40 63 100 F=0.89 0.4229
24 19.25 4 42 13.88 0 37 20.60 18 24 F=0.77 0.4729
25 54.42 (3**) 43 62 59.63 53 67 64.00 53 73 F=5.84 0.0092
26 1.92 0 5 1.25 0 3 1.40 0 2 H= 1.13 0.5671
27 32.75 (2*. 3*) 16 44 21.88 11 45 17.20 10 22 F=6.32 0.0068
28 17.25 (2*.3*) 6 34 28.13 5 39 32.80 28 40 F=6.32 0.0068
* p<0.05; ** p<0.01
were found in the second and third clusters. A homo-geneous group was formed by the values of indices in the second and third cluster.
Comparative analysis of mean values of speed indices revealed statistically significant differences (Table 7) in three cases.
When comparing individual pairs of means for total work (index No. 29) it was found that the higher value existed in the second cluster, whereas the significantly lower value was in the first and third clusters that formed a homogeneous group.
In the case of maximum anaerobic power (index No. 30), Tukey’s procedure allowed for creation of the following homogeneous groups: the first and third clusters and the second and third clusters.
Comparison of the means reveals that the highest value of this index occurred in the second cluster
whereas the lowest values were found in the first cluster.
When comparing individual pairs of means for the blood lactate levels after Wingate test (index No. 34), t the highest mean was found in the second cluster, whereas the lowest one in the first and third clusters. The values of these indices in the first and third clus-ters formed a homogeneous group.
In terms of peak muscle torques in elbow extensors (index No. 36), Tukey’s procedure was employed for formation of the following homogeneous groups: the first and sec-ond clusters and the secsec-ond and third clusters (Table 8).
Comparison of means revealed that the highest value of this index occurred in the first cluster, whereas the lowest value was found for the third one.
When comparing individual pairs of means of peak muscle torques in arm extensors (index No. 38), it Table 7. Mean values of speed ability indices in the groups of judo athletes with similar motor abilities profile
Index No.
Cluster 1. (n=12) Cluster 2. (n=8) Cluster 3. (n=5)
Test Value p Mean Min. Max. Mean Min. Max. Mean Min. Max.
29 267.67 (2*) 260.00 276.00 278.13 (3**) 264.00 298.00 257.20 248.00 269.00 F=10.20 0.0007
30 11.21 (2*) 10.20 12.26 12.16 10.71 13.61 11.16 10.43 11.66 F=4.25 0.0276
31 42.53 32.63 52.38 43.58 35.51 56.65 46.98 40.76 51.85 F=0.87 0.4325 32 3.74 2.15 5.13 4.31 3.06 4.97 4.48 3.55 5.37 F=1.85 0.1813 33 3.50 2.35 4.92 3.17 2.22 4.20 3.53 2.51 4.75 F=0.46 0.6358
34 13.40 (2*) 11.30 15.10 15.41 (3*) 13.04 18.21 13.04 10.90 14.10 F=5.06 0.0156
Table 8. Mean muscle torques in the groups of judo athletes with similar motor abilities profile
Index No.
Cluster 1. (n=12) Cluster 2. (n=8) Cluster 3. (n=5)
Test Value p Mean Min. Max. Mean Min. Max. Mean Min. Max.
35 1.22 0.94 1.51 1.14 0.83 1.41 0.96 0.79 1.18 F=3.00 0.0703
36 0.94 ( 3*) 0.74 1.32 0.77 0.62 0.99 0.72 0.58 1.00 F=5.17 0.0144
37 1.62 1.27 1.90 1.70 1.24 2.14 1.51 1.09 2.00 F=0.77 0.4734
38 1.11 (2#) 0.92 1.32 1.70 (3#) 1.33 2.20 1.18 1.05 1.31 H= 16.44 0.0003
39 1.60 1.21 1.84 1.34 0.94 1.77 1.47 1.18 1.89 H=3.58 0.1672 40 3.77 2.96 4.49 3.52 2.32 4.30 3.10 2.54 3.96 F=2.75 0.0859
41 1.52 (2*. 3*) 0.55 2.33 2.01 1.82 2.34 2.07 1.77 2.40 F=5.69 0.0102
42 3.49(2#) 2.22 5.07 4.78 4.30 5.21 3.70 2.61 4.88 H= 8.30 0.0158
43 1.81 (2#) 1.11 3.51 3.02 2.87 3.13 2.38 1.27 3.54 H= 8.25 0.0161
44 4.27 (2#) 3.23 6.97 5.92 (3#) 5.12 6.50 3.98 3.26 4.93 H= 11.88 0.0026
For multiple comparisons using Mann-Whitney U-test; # significant differences at p<0.016
was found that the highest mean occurred in the sec-ond cluster, whereas the significantly lower mean was observed in the first and third clusters. The values of the indices from the first and third clusters formed a homogeneous group.
It was found for the strength of hip flexors (index No. 41) that lower value of this index occurred in the first cluster, whereas the higher values were observed in the second and third clusters which formed a homogeneous group.
Considering hip extensors (index No. 42) and trunk flexors (index No. 43), the multiple comparisons allowed for formation of the following homoge-neous groups:
• the first and third clusters, • the second and third clusters.
Therefore, the highest mean occurred in both cases in the second cluster whereas its lower values were found in the first one.
The highest mean value of maximal muscle torques in trunk elbow (index No. 44) was found in the sec-ond cluster. The significantly lower means occurred in the first and third clusters. The first and third clusters formed a homogeneous group.
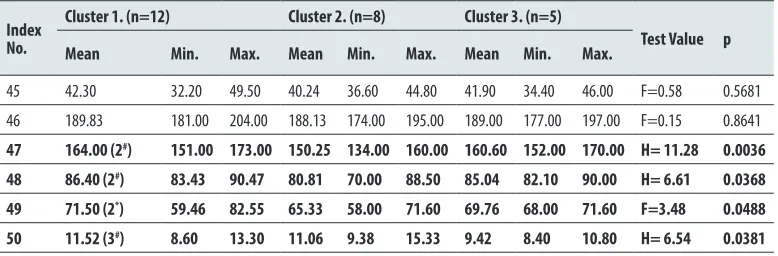
Comparative analysis of mean values of indices of endurance abilities revealed statistically significant differences in four cases (Table 9). In the case of heart rate at decompensated metabolic acidotic threshold (index No. 47), percentage of heart rate at decom-pensated metabolic acidotic threshold (index No. 48) and percentage of VO2max at decompensated meta-bolic acidotic threshold (index No. 49), it was found based on the multiple comparisons that homogeneous
groups were formed by the indices in the first and third clusters and in the second and third clusters.
When comparing the means it was found that the highest levels of these indices occurred in the first (better) cluster, whereas the lowest (worse) was in the second cluster.
Comparison of individual pairs of means for the levels of lactic acid concentration after the graded exercise test (index No. 50) allowed for creation of the follow-ing homogeneous groups:
• the first and second clusters, • the second and the third clusters.
The highest mean occurred in the second cluster. It differed statistically significantly from the mean in the third cluster, where it was the lowest.
d
IscussIonThe studies considering various aspects of motor abil-ities of judo contestants have been conducted in the past [21]. Both individual components, as well as a wide range of motor skills of combat sports athletes have been tested. Somatotype and body composition were assessed most frequently [22-24] also maximal torque [25], isometric grip strength [26-27], dynamic strength [25, 28], muscle power [29-30], muscular endurance [31], anaerobic profile [32-33], aerobic profile [34-35] have been examined.
Particularly valuable seem to be the research works based on the meta-analysis (consisting of various studies). However, while the general profile of motor abilities among highly qualified judo competitors has been well characterized, there is no significant work on diversity within the category of weight and sex
Table 9. Mean indices of endurance abilities in the groups of judo athletes with similar profile of motor abilities
Index No.
Cluster 1. (n=12) Cluster 2. (n=8) Cluster 3. (n=5)
Test Value p Mean Min. Max. Mean Min. Max. Mean Min. Max.
45 42.30 32.20 49.50 40.24 36.60 44.80 41.90 34.40 46.00 F=0.58 0.5681 46 189.83 181.00 204.00 188.13 174.00 195.00 189.00 177.00 197.00 F=0.15 0.8641
47 164.00 (2#) 151.00 173.00 150.25 134.00 160.00 160.60 152.00 170.00 H= 11.28 0.0036
48 86.40 (2#) 83.43 90.47 80.81 70.00 88.50 85.04 82.10 90.00 H= 6.61 0.0368
49 71.50 (2*) 59.46 82.55 65.33 58.00 71.60 69.76 68.00 71.60 F=3.48 0.0488
[21]. The contestants can also represent varied profiles of motor abilities within the same age group.
Conducting the assessment of motor levels among contestants, based on a wide range of variables, should be done under strict methodological principles pre-sented by Hopkins et al. [36] and with the principles of reliability developed by Hopkins [37].
A multidimensional taxonomy, method used in this study belongs to exploratory techniques specifically designed to identify the systems existing in multi-dimensional data sets. For statistical analysis in the previous studies, factor analysis has been used [38-39]. Taxonomy analysis of k-means has not been used so far to identify multidimensional systems in judo. Due to the possibilities provided by this type of analysis, it can be a very useful tool for statistical studies used in the meta-analysis.
Interpretation of the results at the level of object clas-sification revealed that three cadets (objects No. 18, 19 and 21) had profile and level of motor abilities typical of juniors. In terms of the level of motor abilities, one cadet (object No. 23) was included into the group of seniors. One junior (object No. 17) was included into the group of cadets. In conclusion, 4 out of 8 cadets were included into older age groups. Particularly in the case of the athlete No. 23 (who is a non-athlete at present), this points to ‘early specialization’ observed in the practice of training.
In conclusion of the analysis of intergroup differences in indices of motor abilities, it should be noted that cadets showed the worst results in: performing the ‘labyrinth to the left’ test, time of visual-motor coor-dination (optional) test, time of spatial orientation (optional) test, relative peak power, maximal muscle torques in elbow extensors, maximal muscle torques in hip, maximal muscle torques in trunk flexors and lactic acid levels in blood after graded exercise test.
Juniors had the best results in terms of: time of per-forming ‘labyrinth to the left’ test, time of perper-forming spatial orientation (optional) test, number of correct reactions and number of errors in ‘reaction to mov-ing objects’ test, maximal muscle torques in elbow extensors, heart rate at decompensated metabolic aci-dotic threshold, percentage heart rate at decompen-sated metabolic acidotic threshold, % of VO2max at decompensated metabolic acidotic threshold and lac-tic acid levels in blood after graded exercise test. The
worst results were observed only in one case (maxi-mal muscle torque in hip flexors).
In seniors, the highest means were found in: total work, relative peak power, lactic acid level in blood after Wingate test, peak muscle torques in arm exten-sors, hip and trunk extensors. The worst results in this group were obtained for: minimum time of complex reaction, heart rate, percentage heart rate and per-centage VO2max at decompensated metabolic aci-dotic threshold.
While comparing the methods of determining the differences in motor abilities indices, the k-means method revealed 19 statistically significant differences. During one-way analysis of variance with age as an independent variable (unpublished results), statisti-cally significant differences were found in 16 cases.
Statistically significant differences in both meth-ods were found for 14 the same indices. However, the same correlation was found only in 6 cases. This concerned the time of performing spatial orientation (optional) test, level of lactic acid after the test of speed abilities, maximal muscle torques in arm exten-sors, hip extensors and trunk extensors and percentage of maximum heart rate at the threshold of anaero-bic changes.
Statistically significant differences in the first of the discussed methods occurred only in the case of the time of performing ‘labyrinth to the left’ test, time of visual-motor coordination (optional) test, peak power and maximal muscle torques in elbow exten-sors and hip flexors, whereas in the second method the significant differences were found for: balance, time to obtain peak power (toPP) and maximal mus-cle torques in elbow flexors.
c
onclusIonsThe method of k-means differentiates the subjects to higher extent compared to the analysis of variance with age as an independent variable. Its application allows the evaluation of motor development in indi-vidual athletes.
c
oMpetIngInterestsThe authors declare they have no competing interests.
1. Szopa J, Mleczko E, Żak S. Podstawy antropomo-toryki. Warszawa-Kraków: Wydawnictwo Naukowe PWN; 1996 [in Polish]
2. Makrides L, Heigenhauser GJ, McCartney N et al. Maximal short term exercise capacity in healthy sub-jects aged 15-70 years. Clin Sci 1985; 69(2): 197-205 3. Inbar, O, Bar-Or O. Anaerobic characteristics in male children and adolescents. Med Sci Sports Exerc 1986; 18(3): 264-269
4. Klimek AT.Dynamika zmian wybranych parametrów układu oddechowego i krążenia w odpowiedzi na wysiłki interwałowe u chłopców przed i popokwi-taniowej fazie rozwoju. Rozprawa doktorska. AWF Kraków; 1995 [in Polish]
5. Inbar O, Bar-Or O, Skinner JS. The Wingate Anaerobic Test. Champaign (IL): Human Kinetics; 1996
6. Booth F, Wedden S, Tseng BS. Effect of aging on human skeletal muscle and motor function. Acta Physiol Scand 1994; 5: 556-560
7. Harries UJ, Bassey EJ. Torque-velocity relationships for the knee extensors in women in their 3rd and 7th decades. Eur J Appl Physiol 1990; 60: 187-190 8. Viitasalo JT, Era P, Leskinen AL et al. Muscular
strength profiles and anthropometry in random sam-ples of men aged 31 to 35, 51 to 55 and 71 to 75 years. Ergonom 1985; 28: 1563–1574
9. Klimek A. Przebudowa czynności ustrojowych limitujących efektywność wysiłku fizycznego dziecka w okresie rozwoju. AWF Poznań: Monografie 1981; (196) [in Polish]
10. Klimek AT, Cempla J, Pilch W. Exercise-induced changes in pre-and post-pubertal boys, Biol Sport 1998; 15(3): 151-156
11. Dencker M, Thorsson O, Karlsson M et al. Daily physical activity and its relation to aerobic fitness in children aged 8–11 years. Eur J Appl Physiol 2006; 96(5): 587-592
12. Jaworski J, Lyakh V, Wieczorek T. Własna propo-zycja zestawu testów komputerowych do pomiaru wybranych koordynacyjnych zdolności motoryc-znych. International Scientific Conference; Spała; 2007 [in Polish]
13. Lech G, Jaworski J, Lyakh V et al. Effect of the level of coordinated motor abilities on performance in junior judokas. J Hum Kinet 2011; 30: 93-106
14. Committee of Experts on Sports Research. EUROFIT: Handbook for EUROFIT Tests of Physical Fitness. 2nd. Council of Europe Publishing and Documentation Service: Strasbourg; 1993 15. Bar-Or O. The Wingate anaerobic test: An update
on methodology, reliability and validity. Sports Med 1987; 4(6): 381-394
16. Sterkowicz S, Grzegorz L, Chwała W et al. Muscle strength in young judo contestants vs. untrained sub-jects. Arch Budo 2011; 7(3): 179-184
17. Lech G, Tyka A, Pałka T et al. The physical capacity and the course of fights and the ports level of judo juniors. Arch Budo 2010; 6(1): 1-6
18. Lech G, Pałka T, Sterkowicz S et al. Effect of physi-cal capacity on the course of fight and level of sports performance in cadet judokas. Arch Budo 2010; 6(3): 123-128
19. Stanisz A. Przystępny kurs statystyki. Tom III, Analizy wielowymiarowe. StatSoft Polska: Kraków; 2007 [in Polish]
20. Stanisz A. Przystępny kurs statystyki. Tom I. StatSoft Polska: Kraków; 1998 [in Polish]
21. Franchini E, Del Vecchio FB, Matsushigue KA et al. Physiological profiles of elite judo athletes. Sports Med 2011; 41(2): 147-166
22. Callister R, Callister RJ, Staron RS et al. Physiological characteristics of elite Judo athletes. Int J Sports Med 1991; 12: 196-203
23. Sbriccoli P, Bazzucchi I, Di Mario A et al. Assessment of maximal cardiorespiratory perfor-mance and muscle power in the Italian Olympic judoka. J Strength Cond Res 2007; 21 (3): 738-744 24. Burke LM, Cox GR. Nutrition in combat sports.
In: Kordi R, Maffulli N, Wroble RR, et al., editors. Combat sports medicine. London: Springer, 2009: 1-20)
25. Fagerlund R, Hakkinen H. Strength profile of Finnish judoists: measurement and evaluation. Biol Sport 1991; 8 (3): 143-149
26. Claessens ALM, Beunen G, Lefevre J et al. Body structure, somatotype, and motor fitness of top-class Belgian judoists. In: Day JAP, editor. Perspectives in kinanthropometry. Champaign (IL): Hum Kin, 1984: 155-163
27. Thomas SG, Cox MH, LeGal YM, et al. Physiological profiles of the Canadian National Judo
Team. Can J Sport Sci 1989; 14 (3): 142-147 28. Tumilty DM, Hahn AG, Telford RD. A
phys-iological profile of well-trained male judo players. In: Watkins J, Reilly T, Burwitz L, editors. VIII Commonwealth and International Conference on Sport, Physical Education, Dance, Recreation and Health 1986. London: E & F.N: 3-10
29. Krstulovic S, Zuvela F, Katie R. Biomotor systems in elite junior judoists. Coll Anthropol 2006; 30 (4): 315-321
30. Sertic H, Segedi I, Molanovic D. Anthropological and fitness status of Croatian judoists. Arch Budo 2006; 2 (1): 24-27
31. Komi PV. Strength and power in sport. Oxford: Blackwell Science Ltd, 2003
32. Green S, Dawson B. Measurement of anaero-bic capacities in humans: definitions, limitations and unsolved problems. Sports Med 1993; 15 (5): 312-327
33. Degoutte F, Jouanel P, Filaire E. Energy demands during a judo match and recovery. Br J Sports Med 2003; 37 (3): 245-249
34. Muramatsu S, Horiyasu T, Sato Si et al. The relation-ship between aerobic capacity and peak power during intermittent anaerobic exercise of judo athletes. Bull Assoc Sci Study Judo 1994; 8: 151-160
35. Borkowsky J, Faff J, Starczewska-Czapowska J. Evaluation of the aerobic and anaerobic fitness in judoists from the Polish national team. Biol Sport 2001; 18: 107-111
36. Hopkins WG, Marshall SW, Batterham AM et al. Progressive statistics for studies in sports medicine and exercise science. Med Sci Sports Exerc 2009; 41 (1): 3-12
37. Hopkins WG. Measures of reliability in sports. Sports Med 2000; 30(1): 1-15
38. Wolska B, Jagiełło W, Smulski W. Factor structure of physical efficiency in female judo competitors at various stages of long-standing training. Arch Budo 2010; 6(1):25-31
39. Sterkowicz-Przybycień K, Ambroży T. Sexual dimor-phism in anthropometric and fitness measurements of top ju-jitsu contestants. J Combat Sports Mar Arts 2013; 4(2):145-151
r
eferencesCite this article as: Lech G, Chwała W, Tyka A et al. The use of k-means method for assessment of training and differences in motor abilities indices in judo contestants
at different age. Arch Budo 2015; 11: 319-328