Review
Accelerating Live Single-Cell
Signalling Studies
Sam Cooper
1,2,* and Chris Bakal
1The dynamics of signalling networks that couple environmental conditions with cellular behaviour can now be characterised in exquisite detail using live single-cell imaging experiments. Recent improvements in our abilities to introduce
fluorescent sensors into cells, coupled with advances in pipelines for quantify-ing and extractquantify-ing squantify-ingle-cell data, mean that high-throughput systematic analyses of signalling dynamics are becoming possible. In this review, we consider current technologies that are driving progress in the scale and range of such studies. Moreover, we discuss novel approaches that are allowing us to explore how pathways respond to changes in inputs and even predict the fate of a cell based upon its signalling history and state.
Live Single-Cell Imaging Leads the Way
In response to changing environmental conditions, cells often veer from equilibrium and undertake systems-wide changes to promote homeostasis at the cell, tissue, and organism levels. These changes include decisions to proliferate, differentiate, or commit apoptosis. The
‘self-optimisation’process underpinning these changes requires the continuous integration of spatial and temporal information from numerous sources and relaying this information to downstream effectors, via signalling networks [1,2]. Decades of biochemical studies have identified key players in these signalling networks and their interactions. However, most experiments have been performed using techniques that average over populations and/or are destructive. Such methods have largely alluded to, but not quantitatively described, the encoding of information in signalling dynamics, notably by applying external stimuli with varying temporal patterns[2–4]. However, without real-time measurements of signalling activity in single cells, the true dynamics of information flow within cells, and the heterogeneity of behaviour within populations, have remained largely concealed.
The advent of live single-cell imaging approaches now facilitates collecting data describing signalling network activity at sampling rates high enough to study the dynamics of information transfer in living cells[5–9]. This emergingfield has seen rapid development in the number of measurable signalling elements[10], the length of time that dynamics can be analysed over
[11], and the throughput of condition testing[12]. Analysis of these data is giving unprec-edented insights into the fundamental systems whose emergent behaviour leads to robust fate changes [1,13,14]. With this understanding, ‘designer’ therapeutic interventions
[13,15,16]and synthetic multicellular behaviours are now on the horizon[17]. Yet, major technical challenges still exist in converting live single-cell imaging data into biological conclusions.
In this review, we provide an overview of the current and emerging technologies that are now bringing us into an age where high-throughput live single-cell studies in human cells are possible. Additionally, we provide insights into the signalling fundamentals that these higher-throughput analyses are uncovering and how this knowledge is, in turn, driving further
Trends
Major advances in the speed, and ease, with which we can tag proteins, and design reporters for their activity, are driving a surge in live single-cell studies.
The throughput of live single-cell stu-dies is currently limited by challenges in tracking and data extraction. Adopting approaches used in multiple object tracking has led to great progress in this area.
Live single-cell studies coupled with a range of technologies are allowing us to probe signalling networks, shedding new light upon the dynamics of how cells process information and under-take decisions regarding their fate.
1
The Institute of Cancer Research, 237 Fulham Road, London, SW3 6JB, UK
2
Department of Computational Systems Medicine, Imperial College London, South Kensington Campus, London, SW7 2AZ, UK
*Correspondence:
technological progress, thus bringing closer the possibility of large-scale data-driven models and maps of dynamic cellular signalling networks.
Expanding the Traceable Genome
Improvements in Protein-Tagging Systems
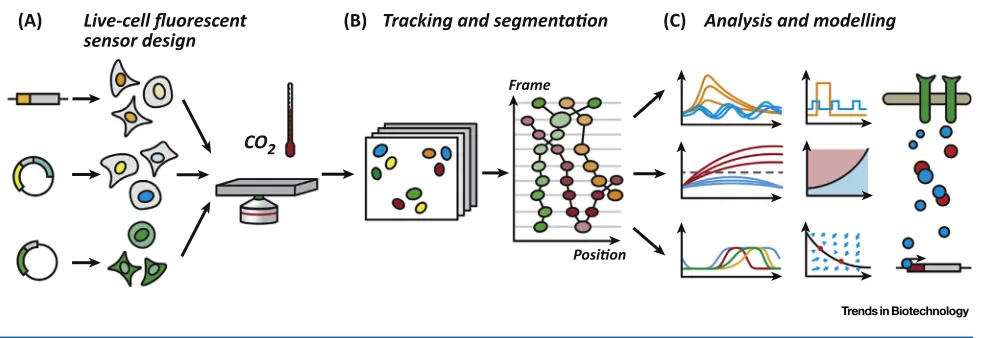
Central to live-cell imaging studies is the design offluorescent reporters and‘tags’to measure signalling behaviour (Figure 1, Key Figure). Until recently, stable overexpression offluorescent reporters represented the primary means of tracking protein levels in live single cells[18]. However, in these cell lines, the tagged protein is under the control of an artificial promoter, which could result in artificial dynamics. Proteins can now be efficiently tagged withfluorescent markers at their endogenous locus to determine their levels and localisation over time, under transcriptional control of their natural promoter (Figure 2A). Following pioneering studies (Box 1), the number of tagged proteins and reporters has expanded greatly[10]. In fact, in yeast, the relative ease of gene editing has allowed most of the proteome to be tagged[19]. This tagging has led to a dynamic analysis of the response of the yeast proteome to multiple stimuli, yielding a systematic inference of signalling protein function[20].
Technologies are emerging in metazoan cells that facilitate ever higher-throughput tagging of proteins, for example, through the generation of large libraries of tagged proteins[21,22]. In a notable study, random integration of tags, where afluorescent coding regionflanked by splice sites is integrated into the genome via a retrovirus, allowed nearly 1000 proteins to be tagged
[23,24]. By automatically characterising protein behaviour following the application of DNA-damaging agents, Cohenet al.gained a systems-wide understanding of state changes in the DNA damage response. Moreover, the authors found the RNA helicase DDX5 to be a major antiapoptotic factor, demonstrating the strength of this approach in characterising in great detail the dynamic response of cells to drugs.
Glossary
Cyclin-dependent kinase (CDK):a kinase that, when bound to cyclin, activates downstream transcription factors to mediate cell cycle progression.
Dynamic programming:an optimisation method to solve problems where many consecutive decisions need to be optimised over. Here, only the optimum path leading up to a decision is ever considered. For example, tofind the optimum path between two huts over a narrow mountain pass, you do not need to consider all combinations of paths before and after the pass, only the best path to the pass from the first hut, and the best path from the pass to the second hut.
ERK:a kinase in the Ras-ERK pathway. This pathway converts information about extracellular conditions into transcriptional events. For example, extracellular growth factors bind to receptor kinases, which activate Ras and, ultimately, ERK; the activation of downstream transcription factors then promotes proliferation.
Förster resonance energy transfer (FRET):an imaging technique in which a donor molecule is excited with a high-energy photon, and the transfer of energy from this donor molecule excites a photon in the acceptor molecule. When this photon relaxes, light is emitted at a lower wavelength. Both the donor and the acceptor have to be in close proximity for this to occur. Hidden Markov models: mathematical models of systems in which the state of the system is not exactly known, but exists with a certain probability, which depends on observations of the state and states before it.
K-nearest neighbour:an algorithm that searches for some number‘k’of the nearest neighbours to a given point; in cell tracking, this algorithm would search for the k nearest cells to the cell in the previous frame. Kalmanfilter:a technique for determining the behaviour of unknown variables over time given a set of noisy measurements. Iteratively, the future values of the variables are predicted based on a model; these predictions are then updated at the next time point based on noisy measurements, and new variables are predicted. Importantly,
Box 1. Seminal Studies of Single-Cell Signalling Dynamics
Work exploring the dynamics of signalling within single cells has revealed fascinating insights into how cells regulate their fate and survive in ever-changing conditions. For example, early live-cell imaging studies facilitated modelling of gene regulatory networks in bacterial cells[89]and demonstrated how synthetic circuits could be designed[90]. Moreover, by using pairwise combinations offluorescent reporters, Suelet al. revealed that different temporal dynamics of positive and negative feedback results in a system where cells stochastically transition into a temporally defined period of competence[182_TD$DIFF][91].
In mammalian cells, landmark studies showed both the NFkB pathway, important in stress and immunity, and the p53 pathway, involved in DNA-damage sensing, to have oscillatory behaviour[5,6,92]. Here, tagging both p53 and its inhibitor MDM2 in a single-cell line showed that these oscillations were due in part, to the participation of p53 in a negative feedback loop with MDM2[5]. Meanwhile, tagging of NFkB and its inhibitor IkBa demonstrated that
transcription of IkBa resulted in a negative feedback loop with NFkB. Together, these results demonstrate that oscillatory signalling dynamics may emerge in signalling pathways where negative feedback exists.
Finally, experiments looking at the kinase ERK found that both sustained and pulsatile activation were important in growth factor responses[183_TD$DIFF][93]. Moreover, cells modulate the frequency of ERK pulses to transmit information[94]. Albeck et al.also showed that downstream targets of ERK integrate the oscillating signal over time, suggesting that cells also decode information multiplexed in frequency-modulated ERK signals[94]. Live single-cell imaging studies have long been applied to the study of calcium signalling dynamics, using thefluorescent protein aequorin[95]. Interestingly, Hannanta-Anan and Chow recently used optogenetic control of calcium to show that the immune-related transcription factor NFAT integrates calcium signalling overtime, meaning this mechanism of temporal integration is likely not limited to ERK signalling[96].
the combination of the prediction and the measurement assigns a more accurate value to the variable than either could alone. In cell tracking, the location of a cell is an important unknown variable. Nuclear factor kappa-light-chain enhancer of activated B cells (NFkB):this term refers to a family of proteins that regulates transcription, especially during immune and stress responses. Most single-cell studies have described the dynamics of a prototypical NFkB family member called RelA, or p65.
Optimisation:given a function or equation, numerical optimisation seeks to maximise the value output by the function by changing parameters. Global optimisation approaches deal with cases where there may be many local optima, analogous tofinding the biggest mountain in a mountain range. Rho-GTPase:proteins that are active when bound to GTP. Intrinsic catalysis of GTP to GDP then inactivates these proteins. Rho family GTPases are key regulators of cytoskeletal organisation, especially during cell morphogenesis and motility.
Segmentation:an image analysis term for marking out a specific region of an image, such as a certain colour or intensity.
Major advances in genome engineering via CRISPR/Cas9[25]are now expediting targeted endogenous gene tagging in metazoan cells. Recently, for example, Stewart-Ornsteinet al.
demonstrated the creation of a toolkit, termed‘eFlut’, for tagging proteins using the CRISPR/ Cas9 system withfluorescent reporters[26]. Leonettiet al.also developed an approach to higher-throughput tagging [27]. This study used a split GFP system, whereby GFP is separated into a small and large fragment, and proteins tagged with the small fragment subsequently fluoresce upon binding the large fragment [28]. The size of the small GFP fragment meant that Kamiyama et al. could use commercial CRISPR/Cas9 systems to integrate the small GFP fragment into genomic DNA [29]; this enabled them to tag 48 human proteins[27]. Importantly, eFlut and the split-GFP approach can use fluorescent proteins with different spectral characteristics, bringing large-scale multiplexed live-cell experiments closer.
To measure the activity of signalling enzymes, such as kinases and GTPases, specific reporters must be used. Systems based onFörster resonance energy transfer(FRET, seeGlossary) are currently the furthest developed of these[30] (Figure 2B). Notably, following early work studyingRho-GTPase signalling in live single cells[31], spatiotemporal analysis of multiple FRET reporters, synchronised to protrusion formation, has offered fascinating insights into how Rho GTPases regulate the actin cytoskeleton[32,33]. Similar to protein tagging, FRET toolkits have been developed that allow systematic construction of reporters. For example, Fritzet al.
developed a toolkit to generate and optimise FRET reporters of protein activity, demonstrated for reporters ofERKand RhoA activity[34].
However, limitations in both the signal:noise ratio and the number of channels that can be simultaneously quantified have driven the search for alternatives to FRET to measure signalling activity[35]. Specifically, efforts to measure cell cycle phase length andcyclin-dependent kinase(CDK) activity led to the development of reporters that translocate out of the nucleus upon phosphorylation[11,36,37]. Moreover, Regotet al.used this principle to develop kinase translocation reporters (KTRs;Figure 2C). Importantly, the authors harnessed the fact that KTRs use only a single imaging channel to simultaneously introduce and measure reporters for JNK, ERK, and p38 activity[35]. Such multiplexing can yield enormous amounts of information about how signalling pathways dynamically interact with one another, representing an impor-tant step forward in thefield.
Capturing the Dynamics of Gene Regulatory Networks
Protein signalling networks often mediate long-term state changes by regulating transcription. To understand the dynamic crosstalk between signalling and transcriptional regulation, net-works will be critical to gaining a systems-wide understanding of cellular informationflow and how it effects changes in cell state.
nucleus. Therefore, the nuclear:cytoplasmic Cas9-GFP ratio acts as a high signal:noise readout of mRNA level, which is demonstrated nicely for GAPDH mRNA[43].
Recent studies have also examined epigenetic regulation in live single cells. For example, Stelzeret al.introduced afluorophore downstream of promoters known to be regulated by methylation. By showing that DNA methylation of a target site is carried over to the promoter for the fluorescent reporter, the authors developed a measure of DNA methylation [44]. This allowed the timing of a key demethylation event that occurs in the process of reprogramming somatic cells into induced pluripotent stem cells to be pinpointed, which had been previously masked by populational heterogeneity[44]. Also looking at epigenetic regulation, Bintuet al. developed a reporter for studying chromatin regulator dynamics in live cells [45]. Here, chromatin regulators are under tetracycline-inducible (TetR) targeting to the promoter of a
fluorescent reporter. Upon chromatin regulators localising to the promoter, the reporter is silenced. Therefore, this method allows measurement of how quickly a chromatin regulator can silence a promoter. Combining protein tags and these reporters will allow us to study how signalling pathways impact longer-term changes to transcriptional regulatory networks.
Advances in Cell Tracking and Analysis
The drive for both higher-throughput live-cell studies and longer imaging time-series is leading to progress in the design and implementation of automated cell tracking algorithms, which are central to higher-throughput live single-cell imaging studies (Figure 1B). Thefields of computer-aided cell tracking andsegmentation are now well developed[46], and software for cell tracking has been compared for the first time [47]. However, major challenges remain in automating cell tracking and integrating tracking algorithms into data analysis pipelines[48].
Towards High-Fidelity Automated Cell Tracking
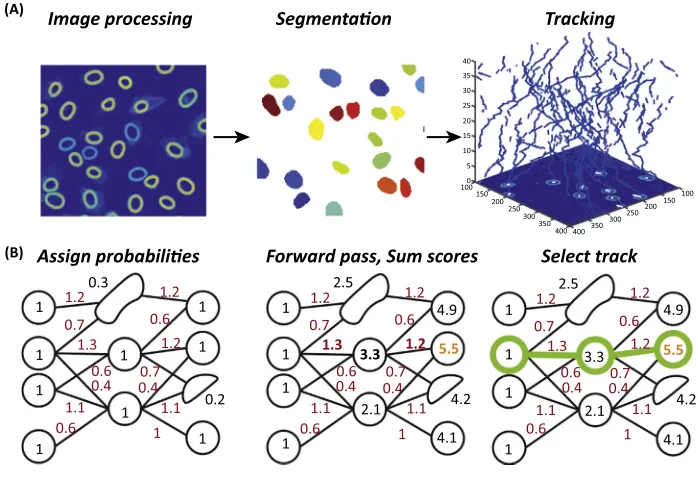
Generally, automated algorithms separate the cell tracking problem into two stages: (i) detec-tion and segmentadetec-tion of cells; and (ii) construcdetec-tion of tracks linking these detecdetec-tions over the
Key Figure
A Live Single-Cell Imaging Workflow
(A) Live-cell fluorescent sensor design
(B) Tracking and segmentaon (C) Analysis and modelling
CO2
Frame
Posion
period of imaging (Figure 3A). In the linking step, most algorithms either look for physical overlap between cell nuclei from one frame to the next or useK-nearest neighbour methods to minimise the movement and/or changes between segments in subsequent images, with rules handling events such as mitosis and death[46]. These algorithms are often successful in tracking separable cells imaged at high frequency. However, high cell densities and large movements frequently lead to detection errors. One way to combat this problem is to image more frequently, but high-frequency imaging limits throughput and can lead to phototoxicity problems[49].
To study live single cells in higher throughput and over longer time periods, there is a pressing need to develop algorithms capable of handling lower-frequency imaging rates and accounting for errors in cell segmentation[50]. Towards this end,optimisationapproaches, now the gold standard in thefield of multiple object tracking[51], are being applied to tracking in molecular biology. Such methods use a cost function to accurately quantify the quality of tracks over the time-series. Cost functions generally penalise large movements or gaps in tracks, while rewarding small movements and continuous tracks. An algorithm then seeks to globally optimise the cost function. Global optimisation approaches, as opposed to frame-to-frame linking, now dominate single particle tracking, as demonstrated in a recent objective
(A) Protein tagging (B) (C) Kinase translocaon reporter
Promoter acvity reporter
FP
FP
Donor Protein
Donor:FRET
rao Nuclear:Cytoplasmicrao
Promoter Acceptor
Nuclear import Nuclear export Resonance
transfer
Intensity, Texture
FRET Reporter
FP
FP
FP FP
NLS NES NLS NES
P P
RPE-1 cells mRuby-PCNA tag MCF10-A cells ERK FRET reporter ** RPE-1 cells CDK2 translocaon reporter
comparison of single particle tracking methods[52]. Here, multiple hypothesis testing and
Kalmanfilteringapproaches gave strong results, although no single optimisation method was best.
For cell tracking, Biseet al.[53]used a similar approach to that used by previous groups[54]to successfully track single particles. In these methods, track fragments arefirst generated, and then connections (including operations, such as merging, splitting, and mitosis) between these fragments are optimised via adynamic programmingapproach (Figure 3B). Winteret al. used a similar optimisation approach for tracking neuronal progenitor cells[55], and Magnus-sonet al. developed a probabilistic, dynamic programming approach, which globally optimises tracks over the entire time course[56,57]. Notably, this software performed best in a recent benchmark test [47], demonstrating the power of global optimisation approaches to cell tracking.
Beyond dynamic programming approaches to optimising cell tracks, a rapidly developing trend in image analysis is the use of large neural networks, or deep learning strategies[58], recently applied to object tracking[59]. Such approaches have also been applied to the segmentation and detection of cells for high-throughput screens[60]. Thus, thefield is now open to the application of such methods for live-cell tracking, where levels of quality that can currently only be reached by manual tracking may be achievable.
Cell Tracking in Pipelines
The accuracy of automated algorithms is currently below what is required for long-term tracking
[48]; thus, there is still a need for solutions that use efficient manual correction. A recent study
(A)
(B)
Image processing Segmentaon Tracking
Assign probabilies Forward pass, Sum scores Select track
40 35 30 25 20 15 10 5 0 100
150 200
250 300
350 400 400350
300250 200150
100
1
1
1
1
1 1
1 1
1
1 1 1
1 0.3
0.2
2.1
3.3 3.3
4.9
4.1 4.2
2.5 2.5
1
1
1
1
2.1
4.9
4.2
4.1 1.2
1.1
1.1 1.1 1.1 1.1 1.1
1.2 1.2
1.2 1.2 1.2 1.2 1.2
0.7 0.7 0.7
0.7 0.7 0.7
0.4 0.4
0.4 0.4 0.4 0.4
0.6 0.6
0.6 0.6
0.6 0.6
0.6
0.6 0.6
1.3 1.3 1.2 1.3
1 1 1
5.5 5.5
[49]highlighted this problem and presented a tool for automatic segmentation, with subse-quent manual tracking, or the option to import and amend tracks from other tools. Moreover, building on successful optimisation-based tracking, Winter et al. presented software that includes cell segmentation, automated tracking, and manual correction as an integrated package [61]. Beyond tracking itself, effectively identifying patterns in temporal data, and using these patterns tofilter out tracking errors, can also improve accuracy. Towards this, Held
et al.usedhidden Markov modelsdescribing nuclear morphology dynamics over mitosis to
select accurately tracked mitotic events[62]. Using this method, Schmitzet al.characterised how 675 different small interfering (si)RNA depletions affected mitotic progression[63]. In summary, integrating correction and improvedfiltering into tracking pipelines offers a ready solution to high-accuracy tracking where automated algorithms fall short.
Exploring Signalling Networks
Probing Signal Transmission
Transmitting information through signalling networks requires changing the activity levels of signalling elements, or nodes, in the network[12]. Many properties of signalling pathways can be characterised by using live-cell reporters to systematically quantify the response of signalling networks to varying inputs (Figure 1C). Importantly, live single-cell methods allow behaviours that would otherwise be masked in population-averaged experiments to be characterised, a key example being oscillations.
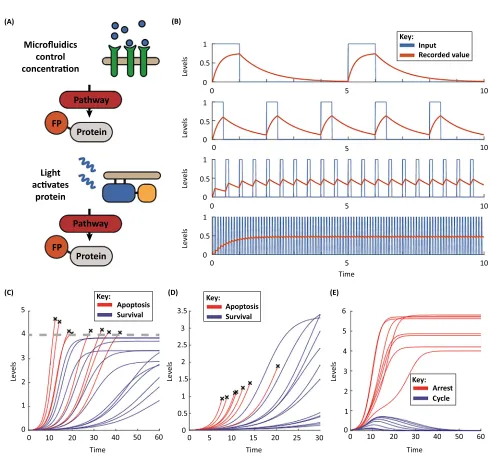
Microfluidic devices represent one of the major technologies facilitating experiments on signal transmission dynamics (Figure 4A) [64]. Such devices can quickly and accurately control external concentrations in chambers where live-cell imaging can be performed. In a key study of the yeast HOG pathway, which responds to osmolar shock, Hersen et al.developed a microfluidic device to rapidly change osmolarity[65]. By varying the frequency of osmolarity change, and by determining when the downstream transcriptional activity stopped matching input changes and instead began integrating the signal, the authors characterised the maxi-mum rate (or bandwidth) that the pathway can operate at (Figure 4B). Hansen and O’shea also utilised microfluidics to study the bandwidth of the Msn2 pathway, involved in the yeast stress response[66,67]. Here, studying the behaviour of a large number of downstream targets of the Msn2 transcription factor demonstrated that the pathway can preferentially express four different types of gene depending on Msn2 translocation amplitude and dynamics, showing that cells may multiplex large amounts of information into a single pathway[68].
Following seminal work on the stress response factornuclear factor kappa-light-chain enhancer of activated B cells(NFkB), showing it to have oscillatory dynamics (Box 1), Kellogg and Tay used a microfluidics approach to determine that NFkB oscillations display digital activation, where differing frequencies of activation induce early, intermediate, and late genes downstream[69,70]. Moreover, these oscillations can become entrained at specific frequency ratios with oscillating external stimuli, leading to enhancement of specific transcrip-tion factors[71]. While Zambranoet al.did not observe natural entrainment[72], both groups did observe three different transcription regimes, thus demonstrating that oscillations in transcription factor dynamics can create varying responses depending on input timing and frequency.
Optogenetics, where gene activity is engineered to be controlled by light-sensitive proteins, is another rapidly developing technology being used to study signalling pathway dynamics (Figure 4A) [73]. Following innovative early experiments looking at the dynamics of ERK activation that showed it to have oscillatory, all-or-nothing activation (Box 1), Toettcher
et al. used optogenetic control of upstream Ras to study how varying the frequency of
(A)
(C) (D) (E)
(B)
Microfluidics control concentraon
Pathway
Pathway Protein
Protein FP
FP Light acvates
protein
Apoptosis Apoptosis
Survival Survival
0
0 10 20 30 40 50 60
1 2 3 4 5
Time Time Time
Time
Le
ve
ls
Le
ve
ls
Le
ve
ls
Le
ve
ls
Le
ve
ls
Le
ve
ls
Le
ve
ls
Arrest Cycle 3.5
3
2.5
2
1.5
1
0.5
0
0 5 10 15 20 25 30 0
1 2 3 4 5 6
0 10 20 30 40 50 60
0 5 10
10 5
0 0
1
0.5
0 0 0.5
1
5 10
10 5
0 1
0.5
0
1
0.5
0
Input Recorded value
Key:
Key:
Key:
Key:
frequencies) as the optical input stimulus, the authors established the fastest rate of signalling change that ERK can respond to. The authors also identified two groups of protein that responded to either transient or sustained Ras-ERK signalling, by monitoring Ras-ERK target phosphorylation levels, therefore demonstrating that variations in the dynamics of Ras-ERK signalling can lead to divergent responses. In an exciting new development, Hiratsukaet al. observed propagation of ERK pulsesin vivo[74]. The authors found that, in normal epithelial tissue, ERK pulses stochastically arose in single cells and spread locally, while in wound healing, sustained ERK waves propagated through tissue. These results suggest that the divergent responses to ERK dynamics identified with optogeneticsin vitrohave a key role in modulating the effects of ERK dynamicsin vivo.
Optogenetics have also been used to study the decision between commitment to stem or differentiated fates. Imayoshiet al. observed oscillatory behaviour in three genes (Ascl1,Hes1, andOlig2) that control neural progenitor differentiation into three respective lineages. Therefore, changes in the oscillatory regimen of one of these genes into sustained activity predict differentiation[75]. By optogenetically controlling Ascl1, the authors of this study showed that oscillations of Ascl1 are required for proliferation, and sustained activity induces differentiation, while unstimulated cells quiesce, meaning that cells can multiplex multiple fate outcomes into a single signalling pathway. Shimojoet al.engineered mice with progenitors that had optically controllable Dll1, another differentiation factor[76]. Here, the authors observed that sustained activity led to differentiation, while optical stimulation of oscillations maintained a proliferative state and severely impacted the neural development of the mice. As such, live single-cell imaging studies, coupled with technologies allowing us to map input spaces, are shedding new light on how information is transferred and integrated into decision making in a variety of cellular processes.
Predicting Cell Fate
A key goal in cell biology is to understand how changes to signalling input result in systems-wide effects that impact the fate of a cell, such as the decision to commit apoptosis. Live single-cell imaging studies are currently unique in relating the history of the signalling dynamics of a single-cell to its future fate (Figure 1C). Importantly, this paradigm allows researchers to study and modify the dynamic systems that underpin fate decisions.
For example, [184_TD$DIFF]following previous studies of how cells undertake the decision to commit apoptosis in response to the TNF-related apoptosis-inducing ligand (TRAIL)[185_TD$DIFF][8,77,78], Roux
et al.used a live single-cell FRET reporter for caspase protease activity to determine at what point caspase activity exceeds that required for apoptosis[186_TD$DIFF][79]. The ability to measure the dynamics of caspase 8 (C8) activity revealed that the maximum C8 activity reached, as opposed to total C8 activity over time, best predicted the apoptotic outcome (Figure 4C)
[187_TD$DIFF]
[79]. The authors hypothesised that degradation of active C8 meant that its activity was not cumulative and, therefore, by inhibiting proteasomal degradation, C8 activity would become cumulative and TRAIL killing enhanced. The authors experimentally validated this and, thus, demonstrated synergy between TRAIL and inhibition of proteasomal degradation in killing cells.
damage in the postmitotic pulse led to cell killing, while cells in the oscillatory phase were resistant, which is perhaps the result of IAP upregulation[188_TD$DIFF][80]. Studying p53, Porteret al.used a live single-cell approach to show that p53 targets with a short mRNA half-life track p53 dynamics over time, whereas those with a long mRNA half-life act to integrate p53 activity over time[191_TD$DIFF][82]. Therefore, these studies provide mechanistic insight into how p53 targets, such as those modulating the apoptotic decision, respond differently to p53 dynamics.
Studying cell cycle regulation, Spenceret al.demonstrated, using a CDK2 reporter, that CDK2 activity levels shortly after mitosis predict whether a cell will proliferate or quiesce[11]. This prediction was made possible by the live-cell reporter revealing the formation of two stable subpopulations shortly after mitosis. One population had low CDK2 activity and entered quiescence, while the other displayed high CDK2 activity and continued to proliferate[11]. The formation of subpopulations requires the signalling system to have two stable states, a network property known as‘bistability’(Figure 4E). In a further study, Overtonet al.modelled this system and found that double-negative feedback between CDK2 and the CDK inhibitor p21 underpinned this bistability[192_TD$DIFF][83]. Also studying cell cycle progression, Barret al. integrated data from live-cell reporters of p27 and CDK2 to show that bistability emerges in the cell cycle between the G1 and S phase states due to double-negative feedback between the CDK inhibitor p27 and CDK2. Mathematical modelling showed that activity of the protein Emi1 ensures that transition from the G1 state to S phase state only normally occurs in the forward direction. Experimental depletion of Emi1 caused cycles of DNA re-replication, demonstrating the importance of Emi1 in maintaining the forward direction of the cell cycle[36]. In comple-mentary work, Cappell et al. combined live single-cell imaging of G1–S progression with carefully timed perturbation experiments to show that Emi1 activity marks the point of irrevers-ible S phase entry[84]. Overall, these studies show that, by studying the dynamics of signalling in single cells over time, we can use the history of the signalling of a cell to predict the future fate of the cell, and use this understanding to alter the fate of a cell, or even modify the underlying network to generate otherwise unseen behaviours.
Concluding Remarks and Future Directions
The experiments and work considered in this review highlight how live single-cell imaging studies are rapidly changing our view of cell signalling. No longer can we consider signalling as simple linear pathways of activation or inhibition. Instead, it is a complex, dynamic, nonlinear process of information integration and processing. In addition to taking steps to perform live single-cell studies in vivo [74,85], the field now appears to be moving from characterising individual motifs to understanding emergent properties of larger signalling networks, such as checkpoint control[86,87], or decisions to differentiate (see Outstanding Questions)[75,76]. In line with this development, major advancements in our understanding of signalling will come from integrating multiple reporters into single-cell lines, such as in pairwise combination with each other. Additionally, the ability to combine live single-cell imaging data with single-cell sequencing data will also lead to fascinating insights. For example, by combining novel techniques allowing genomic events to be identified in the history of a cell population[88]with live single-cell imaging data, we may be able to pin down the signalling changes that occur around the genesis of cancer. In conclusion, the acceler-ating rate at which live single-cell studies are being performed will no doubt lead to novel discoveries that will ultimately allow us to understand how the dynamics of signalling factors contribute to the behaviour of systems as a whole and how the dysregulation of signalling network dynamics underpins disease.
[193_TD$DIFF]
Acknowledgements
We thank Alexis Barr and Stefan Heldt for comments and advice on the manuscript. We also thank John Albeck for providing the FRET image used inFigure 2B, and Jorg Mansfeld for the cell line used in the image inFigure 2A. S.C. is
Outstanding Questions
Can we harness machine learning to fully automate the data extraction pro-cess, and even synthesise knowledge, novel hypotheses, and experiments?
Are signalling dynamics in single cul-tured cells predictive of single cell sig-nallingin vivo?
Can we integrate live single-cell imag-ing data with other data modalities, such as sequencing and mass spec-trometry, to improve our understand-ing of how changes to signallunderstand-ing dynamics affect cells and organisms at a systems-wide level?
supported by the NIHR Imperial BRC, and the STRATiGRAD graduate training program. C.B. is funded by a BBSRC
Strategic LoLa grant (BB/MM00354X/1) and a Cancer Research UK Programme Foundation Award (C37275/1A20146).
References
1. Spiller, D.G.et al.(2010) Measurement of single-cell dynamics.
Nature465, 736–745
2. Kholodenko, B.N. (2006) Cell-signalling dynamics in time and space.Nat. Rev. Mol. Cell Biol.7, 165–176
3. Marshall, C.J. (1995) Specificity of receptor tyrosine kinase sig-naling: transient versus sustained extracellular signal-regulated kinase activation.Cell80, 179–185
4. Murphy, L.O.et al.(2002) Molecular interpretation of ERK signal duration by immediate early gene products.Nat. Cell Biol.4, 556–564
5. Lahav, G.et al.(2004) Dynamics of the p53-Mdm2 feedback loop in individual cells.Nat. Genet.36, 147–150
6. Nelson, D.E.et al.(2004) Oscillations in NF-kappaB signaling control the dynamics of gene expression.Science306, 704–708
7. Cai, L.et al.(2008) Frequency-modulated nuclear localization bursts coordinate gene regulation.Nature455, 485–490
8. Albeck, J.G.et al.(2008) Quantitative analysis of pathways con-trolling extrinsic apoptosis in single cells.Mol. Cell30, 11–25
9. Cohen-Saidon, C.et al.(2009) Dynamics and variability of ERK2 response to EGF in individual living cells.Mol. Cell36, 885–893
10.Gaudet, S. and Miller-Jensen, K. (2016) Redefining signaling pathways with an expanding single-cell toolbox.Trends Biotech-nol.34, 458–469
11.Spencer, S.L.et al.(2013) The proliferation-quiescence decision is controlled by a bifurcation in CDK2 activity at mitotic exit.Cell
155, 369–383
12.Selimkhanov, J.et al.(2014) Systems biology. Accurate informa-tion transmission through dynamic biochemical signaling net-works.Science346, 1370–1373
13.Kolchet al.(2015) The dynamic control of signal transduction networks in cancer cells.Nat. Rev. Cancer15, 515–527
14.Purvis, J.E. and Lahav, G. (2013) Encoding and decoding cellular information through signaling dynamics.Cell152, 945–956
15.Naderi, A.et al.(2011) Synergy between inhibitors of androgen receptor and MEK has therapeutic implications in estrogen receptor-negative breast cancer.Breast Cancer Res.13, R36
16.Sturm, O.E.et al.(2010) The mammalian MAPK/ERK pathway exhibits properties of a negative feedback amplifier.Sci. Signal.3, ra90
17.Markson, J.S. and Elowitz, M.B. (2014) Synthetic biology of multicellular systems: new platforms and applications for animal cells and organisms.ACS Synth. Biol.3, 875–876
18.Giepmans, B.N.G.et al.(2006) The fluorescent toolbox for assessing protein location and function.Science312, 217–224
19.Huh, W.-K.et al.(2003) Global analysis of protein localization in budding yeast.Nature425, 686–691
20.Chong, Y.T.et al.(2015) Yeast proteome dynamics from single cell imaging and automated analysis.Cell161, 1413–1424
21.Hein, M.Y.et al.(2015) A human interactome in three quantitative dimensions organized by stoichiometries and abundances.
Cell163, 712–723
22.Poser, I.et al.(2008) BAC TransgeneOmics: a high-throughput method for exploration of protein function in mammals.
Nat. Methods5, 409–415
23.Sigal, A.et al.(2006) Dynamic proteomics in individual human cells uncovers widespread cell-cycle dependence of nuclear proteins.Nat. Methods3, 525–531
24.Cohen, A.A.et al.(2008) Dynamic proteomics of individual cancer cells in response to a drug.Science322, 1511–1516
25.Cong, L. et al.(2013) Multiplex genome engineering using CRISPR/Cas systems.Science339, 819–823
26.Stewart-Ornstein, J. and Lahav, G. (2016) Dynamics of CDKN1A in single cells defined by an endogenousfluorescent tagging toolkit.Cell Rep.14, 1800–1811
27.Leonetti, M.D.et al.(2016) A scalable strategy for high-through-put GFP tagging of endogenous human proteins.Proc. Natl. Acad. Sci. U. S. A.113, E3501–E3508
28.Cabantous, S.et al.(2005) Protein tagging and detection with engineered self-assembling fragments of green fluorescent protein.Nat. Biotechnol.23, 102–107
29.Kamiyama, D.et al.(2016) Versatile protein tagging in cells with splitfluorescent protein.Nat. Commun.7, 11046
30.Oldach, L. and Zhang, J. (2014) Genetically encodedfluorescent biosensors for live-cell visualization of protein phosphorylation.
Chem. Biol.21, 186–197
31.Pertz, O.et al.(2006) Spatiotemporal dynamics of RhoA activity in migrating cells.Nature440, 1069–1072
32.Machacek, M.et al.(2009) Coordination of Rho GTPase activities during cell protrusion.Nature461, 99–103
33.Martin, K.et al.(2016) Spatio-temporal co-ordination of RhoA, Rac1 and Cdc42 activation during prototypical edge protrusion and retraction dynamics.Sci. Rep.6, 21901
34.Fritz, R.D.et al.(2013) A versatile toolkit to produce sensitive FRET biosensors to visualize signaling in time and space.Sci. Signal.6, rs12
35.Regot, S.et al.(2014) High-sensitivity measurements of multiple kinase activities in live single cells.Cell157, 1724–1734
36.Barr, A.R.et al.(2016) A dynamical framework for the all-or-none G1/S transition.Cell Syst2, 27–37
37.Hahn, A.T.et al.(2009) Quantitative analysis of cell cycle phase durations and PC12 differentiation usingfluorescent biosensors.
Cell Cycle8, 1044–1052
38.Bao, G.et al.(2009) Fluorescent probes for live-cell RNA detec-tion.Annu. Rev. Biomed. Eng.11, 25–47
39.Tyagi, S. (2009) Imaging intracellular RNA distribution and dynamics in living cells.Nat. Methods6, 331–338
40.Paige, J.S.et al.(2011) RNA mimics of greenfluorescent protein.
Science333, 642–646
41.Ouellet, J. (2016) RNAfluorescence with light-up aptamers.Front Chem.4, 29
42.O’Connell, M.R.et al.(2014) Programmable RNA recognition and cleavage by CRISPR/Cas9.Nature516, 263–266
43.Nelles, D.A.et al.(2016) Programmable RNA tracking in live cells with CRISPR/Cas9.Cell165, 488–496
44.Stelzer, Y.et al.(2015) Tracing dynamic changes of DNA meth-ylation at single-cell resolution.Cell163, 218–229
45.Bintu, L.et al.(2016) Dynamics of epigenetic regulation at the single-cell level.Science351, 720–724
46.Meijering, E.et al.(2012) Methods for cell and particle tracking.
Methods Enzymol.504, 183–200
47.Maška, M.et al.(2014) A benchmark for comparison of cell tracking algorithms.Bioinformatics30, 1609–1617
48.Coutu, D.L. and Schroeder, T. (2013) Probing cellular processes by long-term live imaging–historic problems and current solu-tions.J. Cell Sci.126, 3805–3815
49.Hilsenbeck, O.et al.(2016) Software tools for single-cell tracking and quantification of cellular and molecular properties.Nat. Bio-technol.34, 703–706
50.Coutu, D.L. and Schroeder, T. (2013) Probing cellular processes by long-term live imaging–historic problems and current solu-tions.J. Cell Sci.126, 3805–3815
51.Milan, A.et al.(2016)MOT16: a benchmark for multi-object tracking. arXiv1603.00831
52.Chenouard, N.et al.(2014) Objective comparison of particle tracking methods.Nat. Methods11, 281–289
54.Jaqaman, K.et al.(2008) Robust single-particle tracking in live-cell time-lapse sequences.Nat. Methods5, 695–702
55.Winter, M.et al.(2011) Vertebrate neural stem cell segmentation, tracking and lineaging with validation and editing.Nat. Protoc.6, 1942–1952
56.Magnusson, K.E.G. and Jaldén, J. (2012) A batch algorithm using iterative application of the Viterbi algorithm to track cells and construct cell lineages. In2012 9th IEEE International Symposium on Biomedical Imaging (ISBI), pp. 382–385, IEEE
57.Magnusson, K.E.G. (2015) Global linking of cell tracks using the Viterbi algorithm.IEEE Trans. Med. Imaging34, 911–929
58.Girshick, R.et al.(2014) Rich feature hierarchies for accurate object detection and semantic segmentation. InProceedings of the IEEE Conference on Computer Vision and Pattern Recogni-tion, pp. 580–587, IEEE
59.Ma, C.et al.(2015) Hierarchical convolutional features for visual tracking. InProceedings of the IEEE International Conference on Computer Vision, pp. 3074–3082, IEEE
60.Kraus, O.Z.et al.(2016) Classifying and segmenting microscopy images with deep multiple instance learning.Bioinformatics32, i52–i59
61.Winter, M.et al.(2016) LEVER: software tools for segmentation, tracking and lineaging of proliferating cells.Bioinformatics32, 3530–3531
62.Held, M.et al.(2010) CellCognition: time-resolved phenotype annotation in high-throughput live cell imaging.Nat. Methods
7, 747–754
63.Schmitz, M.H.A.et al.(2010) Live-cell imaging RNAi screen identifies PP2A-B55alpha and importin-beta1 as key mitotic exit regulators in human cells.Nat. Cell Biol.12, 886–893
64.Bennett, M.R. and Hasty, J. (2009) Microfluidic devices for mea-suring gene network dynamics in single cells.Nat. Rev. Genet.10, 628–638
65.Hersen, P.et al.(2008) Signal processing by the HOG MAP kinase pathway.Proc. Natl. Acad. Sci. U. S. A.105, 7165–7170
66.Hansen, A.S. and O’shea, E.K. (2015) Limits on information transduction through amplitude and frequency regulation of tran-scription factor activity.Elife4, e06559
67.Hao, N. and O’shea, E.K. (2012) Signal-dependent dynamics of transcription factor translocation controls gene expression.Nat. Struct. Mol. Biol.19, 31–39
68.Hansen, A.S. and O’shea, E.K. (2016) Encoding four gene expression programs in the activation dynamics of a single tran-scription factor.Curr. Biol.26, R269–R271
69.Tay, S.et al.(2010) Single-cell NF-kappaB dynamics reveal digital activation and analogue information processing.Nature466, 267–271
70.Kellogg, R.A.et al.(2014) High-throughput microfluidic single-cell analysis pipeline for studies of signaling dynamics.Nat. Protoc.9, 1713–1726
71.Kellogg, R.A. and Tay, S. (2015) Noise facilitates transcriptional control under dynamic inputs.Cell160, 381–392
72.Zambrano, S.et al.(2016) NF-kB oscillations translate into func-tionally related patterns of gene expression.Elife5, e09100
73.Zhang, K. and Cui, B. (2015) Optogenetic control of intracellular signaling pathways.Trends Biotechnol.33, 92–100
74.Hiratsuka, T.et al.(2015) Intercellular propagation of extracellular signal-regulated kinase activation revealed byin vivoimaging of mouse skin.Elife4, e05178
75.Imayoshi, I.et al.(2013) Oscillatory control of factors determining multipotency and fate in mouse neural progenitors.Science342, 1203–1208
76.Shimojo, H.et al.(2016) Oscillatory control of Delta-like1 in cell interactions regulates dynamic gene expression and tissue morphogenesis.Genes Dev.30, 102–116
77.Albeck, J.G.et al.(2008) Modeling a snap-action, variable-delay switch controlling extrinsic cell death.PLoS Biol.6, 2831–2852
78.Spencer, S.L.et al.(2009) Non-genetic origins of cell-to-cell variability in TRAIL-induced apoptosis.Nature459, 428–432
79.Roux, J.et al.(2015) Fractional killing arises from cell-to-cell variability in overcoming a caspase activity threshold.Mol. Syst. Biol.11, 803
80.Paek, A.L.et al.(2016) Cell-to-cell variation in p53 dynamics leads to fractional killing.Cell165, 631–642
81.Chen, S.-H. et al. (2016) Schedule-dependent interaction between anticancer treatments.Science351, 1204–1208
82.Porter, J.R.et al.(2016) p53 pulses diversify target gene expres-sion dynamics in an mRNA half-life-dependent manner and delineate co-regulated target gene subnetworks.Cell Syst.2, 272–282
83.Overton, K.W.et al.(2014) Basal p21 controls population het-erogeneity in cycling and quiescent cell cycle states.Proc. Natl. Acad. Sci. U. S. A.111, E4386–E4393
84.Cappell, S.D.et al.(2016) Irreversible APC(Cdh1) inactivation underlies the point of no return for cell-cycle entry.Cell166, 167–180
85.Hirata, E.et al.(2015) Intravital imaging reveals how BRAF inhibi-tion generates drug-tolerant microenvironments with high integrin b1/FAK signaling.Cancer Cell27, 574–588
86.Skotheim, J.M.et al.(2008) Positive feedback of G1 cyclins ensures coherent cell cycle entry.Nature454, 291–296
87.Araujo, A.R.et al.(2016) Positive feedback keeps duration of mitosis temporally insulated from upstream cell-cycle events.
Mol. Cell64, 362–375
88.Frieda, K.L.et al.(2016) Synthetic recording andin situreadout of lineage information in single cells.Nature541, 107–111
89.Rosenfeld, N.et al.(2005) Gene regulation at the single-cell level.
Science307, 1962–1965
90.Elowitz, M.B. and Leibler, S. (2000) A synthetic oscillatory network of transcriptional regulators.Nature403, 335–338
91.Süel, G.M.et al.(2006) An excitable gene regulatory circuit induces transient cellular differentiation.Nature440, 545–550
92.Nelson, G.et al.(2002) Multi-parameter analysis of the kinetics of NF-kB signalling and transcription in single living cells.J. Cell Sci.
115, 1137–1148
93.Shankaran, H.et al.(2009) Rapid and sustained nuclear-cyto-plasmic ERK oscillations induced by epidermal growth factor.
Mol. Syst. Biol.5, 332
94.Albeck, J.G.et al.(2013) Frequency-modulated pulses of ERK activity transmit quantitative proliferation signals.Mol. Cell49, 249–261
95.Woods, N.M.et al.(1986) Repetitive transient rises in cytoplasmic free calcium in hormone-stimulated hepatocytes.Nature319, 600–602