http://www.sciencepublishinggroup.com/j/ijls doi: 10.11648/j.ijls.20180101.13
Dividend Policy and Stock Price to the Company Value in
Pharmaceutical Company’s Sub Sector Listed in Indonesia
Stock Exchange
Supitriyani
Department of Accounting, Sekolah Tinggi Ilmu Ekonomi (STIE) Sultan Agung, Pematangsiantar, Indonesia
Email address:
vitrivino@yahoo.co.id
To cite this article:
Supitriyani. Dividend Policy and Stock Price to the Company Value in Pharmaceutical Company’s Sub Sector Listed in Indonesia Stock Exchange. International Journal of Law and Society. Vol. 1, No. 1, 2018, pp. 16-23. doi: 10.11648/j.ijls.20180101.13
Received: November 6, 2017; Accepted: November 28, 2017; Published: December 24, 2017
Abstract:
The formulation of this research problem is how the dividend policy, stock price, the value of the company and leverage at Sub Sector of Pharmaceutical company listed in Indonesia Stock Exchange are described, and how the influence of dividend policy and stock price to the value of the company with leverage as moderating variable in Sub Sector of Pharmaceutical company listed in Indonesia Stock Exchange simultaneously or partially. The research method used in this paper is library research. The Object is a Sub-Sector of Pharmaceutical Company listed in the Indonesia Stock Exchange from 2014 to 2016 which published its audited financial statements successively during the year of research and has never experienced a negative net income position and consistently distributed dividends during the research year, totaling of 5 companies. The data used is qualitative and quantitative data, and data collection techniques by way of documentation. The technique of data analysis uses classical assumption, qualitative and quantitative descriptive analysis. The results of the study can be summarized as follows: 1) There are 5 years of companies whose dividend policy is below average, there are 4 years of companies whose stock price is below the average and 3 years of companies whose value is below average, 2) Results regression testing is Y = 1,702 + 1,211 X1+ 1,989 X2 which can be interpreted that there is positive influence between dividend policy and stock price to the value of the
Sub Sector of Pharmaceutical company listed in Indonesian Stock Exchange period 2014 until 2016. The strength of relationship of the three variables is medium (r = 0,597). The coefficient of determination is 35.6%, and the remaining 64.4% is explained by other factors. From the results of processing and data calculation, the author concludes that the dividend policy and stock price affect the value of the company in Sub-Sector of Pharmaceutical company listed in the Indonesia Stock Exchange simultaneously or partially and dividend policy and stock price affect the value of the company with leverage as a moderating variable at the Pharmaceutical Sub-sector listed in the Indonesia Stock Exchange simultaneously or partially. Therefore, investors and potential investors should pay attention to the dividend policy and stock price before investing because they are very influential in determining the value of the company and investors and potential investors should pay attention to internal and external factors of the company.
Keywords: Dividend Policy, Stock Price, The Value of Company, Leverage
1. Introduction
Basically, investors measure the performance of the company based on the ability of the company in managing resources owned to generate profits so that the value of the company will rise. Dividend policy and stock price have been considered as important factors in determining the value of the company, this is because the dividend policy and stock price of the company is the most objective and clear enough to describe the value of the appropriate company in a company.
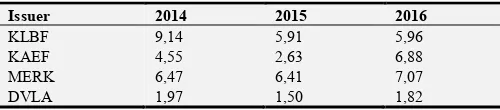
The following is presented in Table 1 of the company's average value data proxied by Price Book Value (PBV) at Sub-Sector of Pharmaceutical company listed in the Indonesia Stock Exchange for the period 2010-2016.
Table 1. Average the value of the company.
Issuer 2014 2015 2016
KLBF 9,14 5,91 5,96
KAEF 4,55 2,63 6,88
MERK 6,47 6,41 7,07
Issuer 2014 2015 2016
TSPC 3,15 1,84 1,93
Average (PBV) 5,06 3,66 4,73
Source: Data Processed.
From Table 1 above, it can be seen that the average PBV value fluctuates. This can be seen in the 2014 PBV which reached 5.06. This table has decreased in 2014 and 2015. But in the year 2016 the value of PBV average increased. With the fluctuation of the value of the company, the author is interested to examine the influence of other variables such as dividend policy and stock price. There are many companies listed in the Indonesia Stock Exchange with varying types of operations, however the author limits the study only to companies that are relatively similar in the Sub-Sector of Pharmaceutical company. Therefore, the author conducted a study entitled "Influence of Dividend Policy and Stock Price to the Value of the Company in Sub Sector of Pharmaceutical Company Listed in Indonesia Stock Exchange."
1.1. Formulation of the Problems
a. How is the dividend policy, stock price, the value of the company and leverage at Pharmaceutical Sub Sector Company listed in Indonesia Stock Exchange described?
b. How is the effect of policy and stock price on the value of the company in Sub-Sector of Pharmaceutical Company listed in Indonesia Stock Exchange simultaneously or partially analyzed?
c. How is the influence of dividend policy and stock price to firm value with leverage as moderating variable in Sub-Sector of Pharmaceutical company listed in Indonesia Stock Exchange simultaneously or partially analyzed?
1.2. Research Purposes
a. To know the description of dividend policy, stock price, the value of the company and leverage at Sub-Sector of Pharmaceutical Company listed in Indonesia Stock Exchange.
b. To know and analyze the influence of dividend policy and stock price to the value of the company at company of Pharmaceutical Sub Sector listed in Indonesia Stock Exchange simultaneously or partially.
c. To know and analyze the influence of dividend policy and stock price to the value of the company with leverage as moderating variable at Sub-Sector of Pharmaceutical Company listed in Indonesia Stock Exchange simultaneously or partially.
1.3. Research Method
The location or place of research is conducted in Sub-Sector of Pharmaceutical Company listed in Indonesia Stock Exchange, Jl. Jend. Sudirman Kav 52-53 South Jakarta 12190 by accessing www.idx.co.id. In this study the population is Sub-Sector of Pharmaceutical Company listed in the
Indonesia Stock Exchange from 2014 to 2016 which published their audited financial statements successively during the year of research, never having negative net profit position during the research year and consistently distributing dividends during the study period. Of these criteria there are 5 Sub-Sectors of Pharmaceutical Companies that are used as research objects.
The research design used in the writing of this thesis is Library Research. The Data collection techniques by the author in this study is in the form of documentation. The type of data used in this study is the type of qualitative and quantitative data. The results of the data obtained will be tested by the classical assumption test and analyzed descriptively both qualitatively and quantitatively.
2. Theoretical Review
2.1. Financial Statements
Financial statements are tools that can be used to determine the condition of the company. According to Harrison, et. al. (2012: 2), financial statements are business documents that companies use to report the results of their activities to various user groups, which may include managers, investors, creditors, and regulatory agents. Instead, the parties use the information reported to make decisions, such as whether to invest in or lend money to the company.
The purpose of the financial statements according to PSAK 1 (revised 2009) in Martani, et. al. (2012: 9), is to:
a. Provide information regarding the financial position, performance, and changes in the financial position of an entity that is beneficial to a large number of users in economic decision-making.
b. Show what management has done (stewardship) and responsibility of resources entrusted to it.
c. Meet the needs of most users.
d. Provide financial effects from past events.
2.2. Financial Statement Analysis
One way that can be done to assess the company's performance is to see from the analysis of its financial statements. According to Subramanyam and John (2010: 4), financial statement analysis is an application of analytical tools and techniques for general purpose financial statements and related data to generate useful estimates and conclusions in business analysis. Analysis of financial statements is one way to determine the performance of companies within a period (Kasmir, 2010: 66).
2.3. Financial Ratios
Then the comparable numbers can be numbers in a period or periods. According to Sudana (2011: 20), there are 5 types of financial ratios, namely leverage ratio, liquidity ratio, activity ratio, profitability ratio, and market value ratio.
2.4. Dividend Policy
According to Astuti (2004: 145), the dividend policy involves the decision to divide the profits or arrange to be reinvested within the company. According to Rudianto (2009: 309), the types of dividends are cash dividend, property dividend, script dividend or debt dividend, stock dividend and liquidation dividend.
2.5. Stock Price
According to Sudana (2011: 87), shares are one of the alternative sources of long-term funds for a company. Companies that require long-term funds in the form of equity can obtain it through the issuance of shares, either sold through Private Placement or Initial Public Offering (IPO). Stock prices have changed up or down from one time to another. The change depends on the strength of demand and supply, if a share is over-demanded, then the price tends to rise. Conversely, if there is an excess supply, then the stock price tends to fall.
2.6. The Value of the Company
According to Keown, et. al (2004: 470), the value of the firm is the market value of the outstanding debt and equity securities of the company. The price that the prospective buyer is willing to pay is defined as the market price of the company itself.
Maximizing the value of a company is very important for a company, because it also means to maximize shareholder’s wealth that is the main goal of the company. According to Horne and John (2012: 3), the factors that affect firm value are investment decisions, funding decisions, and asset management decisions.
2.7. Leverage
According to Sugiono (2009: 67), leverage is a ratio that measures how far the financial needs of the company are financed by loan funds. According to Kasmir (2010: 122), the types of leverage ratios are Debt Assets Ratio (Debt Ratio), Debt Equity Ratio, Long Term Debt to Equity Ratio, Time Interest Earned (TIE), and Fixed Charge Coverage.
2.8. Influence of Dividend Policy and Stock Price to the Value of the Company
In Astuti (2004: 145) dividend Policy is the decision to share the profit or hold it for reinvestment inside the company. The dividend policy concerns the use of profits which are the rights of shareholders. The policy of determining how much profit will be obtained by shareholders.
Profits obtained by shareholders will determine the welfare of shareholders which is the main objective of the company,
given that the main purpose of the company is to maximize shareholder value. The greater the dividend distributed to the shareholders, the better the company will be considered. And conversely the smaller the dividends are distributed to the shareholders, the company will be considered in a state of no good.
One way to increase the value of a company is the company's ability to pay dividends to shareholders. In Bird-in
The Hand Theory, according to Brigham and Joel (2001: 67),
firm value will be maximized by a high dividend payout ratio because investors consider that cash dividends are less risky than potential capital gains. The amount of dividends distributed to shareholders will be an attraction for shareholders as investors are more likely to like dividends compared to Capital Gains because dividends are certain. The amount of dividend will affect the stock price. If the dividend paid is high, then the stock price tends to be high so it will increase the value of the company, if the dividend paid is low to the shareholders, then the stock price tends to be low so it will decrease the value of the company.
Based on Signaling Theory, info published as an announcement will provide a signal for investors in making investment decisions. If the announcement contains a positive value, then it is expected that the market reacts at the time the announcement is received. The market reaction is indicated by changes in the volume of stock trading. At the time the info is announced and all market participants have received the info, market participants first interpret and analyze the info as a good signal (good news) or bad signal (bad news).
Syamsuddin (2004: 38), states that the shareholders and prospective shareholders pay attention to the level of profit, both now and in the future. This is important because the level of profit will affect the stock price they have. The prospective shareholders are interested in large PBV, as this is one indicator of the success of a company.
The higher the value of PBV, the greater the profit provided by the company to shareholders. Sales growth reflects the company's prospects and future value of the company. If the growth of stock price is high expected the profitability of the company increases and the prospect of the company will be better. Thus the greater the profits earned by the company, will encourage the increase in stock prices and if the stock price rises then the value of the company will also be high.
3. Discussion
3.1. Analysis
a. Classic Assumption Test
In the classical assumption test is used to determine whether or not there are violations contained in multiple linear regression models that have been made. The classical assumption tests used in this research are:
1) Normality Test
Table 2. Kolmogorov-Smirnov Test.
DER DPR RHS PBV
N 15 15 15 15
Normal Parametersa, b
Mean .4275 .4803 .9780 4.4820
Std. Deviation .21986 .34484 .54622 2.49325
Most Extreme Differences
Absolute .261 .221 .086 .183
Positive .261 .221 .086 .176
Negative -.174 -.194 -.062 -.183
Kolmogorov-Smirnov Z 1.011 .858 .332 .710
Asymp. Sig. (2-tailed) .259 .454 1.000 .695
Source: Result of data processing by SPSS.
2) Heteroscedasticity Test
The detection test of whether or not heteroscedasticity in this research is done by looking at the presence of a particular pattern (wavy, widened, and narrowed) on the scatterplot graph between the predicted value of the dependent variable (*ZPRED) with the independent variable (*SRESID). Results of heteroscedasticity testing after data transformation can be seen in Figure 1.
(Source: Result of data processing by SPSS)
Figure 1. Heteroscedasticity Test.
3) Autocorrelation Test
According to Suliyanto (2011: 125), autocorrelation test aims to determine whether there is a correlation between members of a series of observation data are described by time (times-series) or space (cross section). In this study, the autocorrelation test was performed by using Durbin-Watson test which can be seen in Table 3.
Table 3. Result of Autocorrelation Test.
Model Std. Error of the Estimate Durbin-Watson
1 2.31910 1.651
(Source: Result of data processing by SPSS)
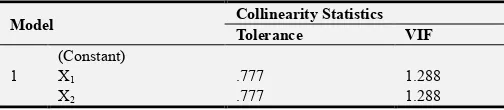
4) Multicollinearity Test
Multicollinearity test results showed no independent variable has Tolerance value less than 0.10 which means there is no correlation between independent variables whose value is more than 95%. The calculation of Inflation Factor (VIF)
value is also no more than 10, so it can be concluded that there is no multicollinearity between the independent variables in the regression model used. This can be seen in Table 4.
Table 4. Result of Multicollinearity Test.
Model Collinearity Statistics Tolerance VIF
1
(Constant)
X1 .777 1.288
X2 .777 1.288
(Source: Result of data processing by SPSS)
b. Qualitative Descriptive Analysis of First Hypothesis Description of Dividend Policy in Sub-Sector of Pharmaceutical Company Listed in Indonesia Stock Exchange 2014 - 2016 period is known the average value is at 0.48. This shows that companies registered in Pharmaceutical Sub-sector are able to distribute dividend of Rp 0.48.
Stock Price Preview on Sub-Sector of Pharmaceutical Company Listed in Indonesia Stock Exchange 2014 - 2016 period is known the average value of stock price is at 0.98. This shows that the average stock price of Mining Sector Companies listed in the Indonesia Stock Exchange is Rp 0.98. Description of The value of the company at Sub-Sector of Pharmaceutical Company Listed in Indonesia Stock Exchange 2014 - 2016 period, the average value is at 4.48. This shows that the average value of the Company's Pharmaceutical Sub-Sector Listed in the Indonesia Stock Exchange is Rp 4.48. c. Quantitative Descriptive Analysis Of Second Hypothesis 1) Multiple Linear Regression Analysis
Multiple linear regressions are used to analyze the relationship between independent variables on the dependent variable. The model used to perform multiple linear regression analysis is: Y = b0 + bX1 + bX2 (Simbolon, 2013: 239)
Multiple linear regressions testing in this study using SPSS (Statistical Product and Service Solution) can be presented in Table 5.
Table 5. Multiple Linear Regression.
Model Unstandardized Coefficients
B Std. Error
1
(Constant) 2.487 1.318
X1 -1.058 2.040
X2 2.560 1.288
(Source: Result of data processing by SPSS)
Based on the result of analysis with SPSS program in Table 5 above, the model of multiple regression equation is as follows:
Y = 2.487 – 1.058 X1 + 2.560 X2
2) Correlation Coefficient and Coefficient of Determination Here is the result of SPSS data processing to show the correlation coefficient in Table 6.
Table 6. Correlation Coefficient and Determination Test.
Model R R Square Adjusted R Square
1 .508a .258 .135
(Source: Results of Data Processing by SPSS)
Correlation analysis is used to determine the degree of linear relationship between one variable with other variables. The value of r is also called the correlation coefficient. From Table 5 above, the result of R is 0,508. Thus it can be said that the correlation or the relationship between the dividend policy and stock price to the value of the company in Sub-Sector of Pharmaceutical Company listed in the Indonesia Stock Exchange is moderate.
While the coefficient of determination r2 in essence measure how far the ability of the model in explaining the dependent variation. The small value of r2 means the ability of dividend policy and stock price to explain the value of the company is very limited. A value close to one means the independent variables provide almost all the information needed to predict the variation of the dependent variable.
Based on Table 5 it can be seen that the r square value is 0.258 which means that the value of the company can be explained dividend policy and stock price equal to 25.8%, at Pharmaceutical Sub Sector Company, while 74.2% is explained by other variables not included in model this research.
3) Hypothesis Testing
The hypothesis tested in this study is simultaneous test (F test) and partial test (t test), as follows:
a) Simultaneous Test (Test F)
The statistical test F basically shows whether all the independent variables included in the regression model have a mutual influence on the dependent variable. The approximate result of the F count value in this study is presented in Table 7.
Table 7. Result of F Test.
Model Sum of
Squares Df Mean Square F Sig.
1
Regression 22.490 2 11.245 2.091 .166b
Residual 64.539 12 5.378
Total 87.028 14
(Source: Results of Data Processing by SPSS)
Because F count 2.091 <Based on Table 7, the F test results shown show that the F count is 2.091 and the F table value is 3.74 and the significance level is 0.166> 0.05 then H0 is
accepted, which means that dividend policy and stock price have no a significant effect to the value of the company in Sub-Sector of Pharmaceutical Company listed in Indonesia Stock Exchange.
b) Partial Test (t test)
The statistical t test is performed to test the effect between independent and dependent variable with assumption that variable is considered constant. According Suliyanto (2011:
45), the value of t arithmetic is used to test whether the variable significantly affect the dependent variable or not. A variable will have a significant effect if the value of t arithmetic variable is greater than the value of t table.
In this test two-tailed t test is used because the proposed hypothesis has not shown the direction, that is there is influence (does not show the influence of positive or negative). Using a two-tailed t test, the 95% confidence level, alpha 5% or 0.05 and n = 15 then the degrees of freedom are df of alpha divided by 2 = 0.05: 2 = 0.025 and n-2 = 15-2 = 13, from table t it can be seen that the table number of 2.16037 for variable X1, obtained t count for the dividend policy is -0.519. Since t
<t-table or 0.519 <2.16037, then H0 is accepted. In another
way, the level of significance obtained from the SPSS data processing in Table 5 shows the significance level of 0.613> 0.05 then it can be said that H0 is accepted, it means the
dividend policy has no significant effect on the value of the company in Sub Sector Pharmaceutical listed in the Stock Exchange Indonesia.
Also obtained t table number of 2. 16037 for variable X2,
obtained t count for stock price is 1.988. Because t count> t table or 1.988<2.0345, then H0 is accepted. In another way, the
level of significance obtained from the SPSS data processing in Table 5 shows the significance level of 0.070>0.05 then it can be said that H0 is accepted, meaning the stock price no
significantly influence the value of the company in Sub-Sector of Pharmaceutical Company listed in Indonesia Stock Exchange.
The result of t test in this research can be seen in Table 8.
Table 8. Result of t Value.
Model
Unstandardized Coefficients
Standardized
Coefficients t Sig. B Std. Error Beta
1
(Constant) 2.487 1.318 1.886 .084
X1 -1.058 2.040 -.146 -.519 .613
X2 2.560 1.288 .561 1.988 .070
(Source: Results of Data Processing by SPSS)
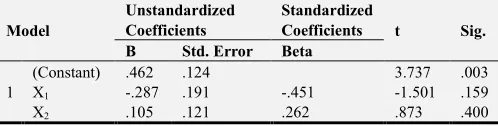
d. Quantitative Descriptive Analysis of the Third Hypothesis The third hypothesis is tested by using the multiple linear regression analysis test and residual test. The moderating variable in this research is the leverage measured by using Debt to Equity Ratio (DER). The use of moderating variables is intended to prove the hypothesis that dividend policy and stock price influence on firm value with leverage as moderating variable. The result of statistical analysis of the second hypothesis can be seen in Table 9.
Table 9. Result of Regression of Second Hypothesis.
Model
Unstandardized Coefficients
Standardized
Coefficients t Sig. B Std. Error Beta
1
(Constant) .462 .124 3.737 .003
X1 -.287 .191 -.451 -1.501 .159
X2 .105 .121 .262 .873 .400
a. Dependent Variable: M
Based on multiple linear regression equation between dividend policy variable and stock price to moderating variable (leverage) yields equation of first model as follows:
M = 0.462 - 0.287 X1 + 0.105 X2 + e
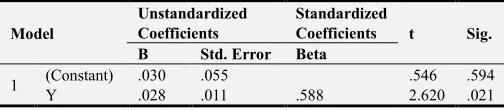
The results of multiple linear regressions are then performed residual test to determine whether the leverage measured by using Debt to Equity Ratio is a moderating variable. The residual test results in this study can be seen in Table 10.
Table 10. Result of Residual Test.
Model
Unstandardized Coefficients
Standardized
Coefficients t Sig. B Std. Error Beta
1 (Constant) .030 .055 .546 .594
Y .028 .011 .588 2.620 .021
a. Dependent Variable: AbsRes_1
(Source: Result of Data processing by SPSS)
Based on Table 10, the residual equation between the cooperative growth variable to the residual absolute value of the moderating variable (working capital) yields the equation of the residual test model as follows:
| e | = 0.030 + 0.028 Y
The result of analysis of residual test in Table 10 can be seen that the variable of the value of the company has significant level> 0.05 and the value of positive parameter coefficient, so it can be concluded that leverage variable is not a moderating variable because from result of research obtained significance number equal to 0.021< 0.05 which is standard normal significance. Therefore, H2 which states dividend policy and
stock price influence to firm value with leverage as moderating variable in Sub-Sector of Pharmaceutical Company Listed in Indonesia Stock Exchange accepted.
3.2. Evaluation
a. Evaluation of Dividend Policy in Sub-Sector of Pharmaceutical Company Listed in Indonesia Stock Exchange.
From the results of research, the average dividend policy on Sub-Sector of Pharmaceutical Company Listed in Indonesia Stock Exchange 2014 - 2016 is at 0.480. This shows that companies registered in Pharmaceutical Sub-sector are able to distribute dividend of Rp. 0.480.
In this study, values above the average dividend policy is in 2015. This proves that firms that year have the ability to pay higher dividends for better welfare to shareholders. And the value of dividend policy below the average are in 2014 and 2016. This indicates that companies in the year were less able to distribute high dividends and less able to provide welfare to shareholders. From the above description it can be concluded that the high dividend policy is obtained from the high level of corporate profits so as to attract investors to buy shares in the company and give wealth to shareholders and prospective shareholders.
b. Evaluation of Stock Price at Sub-Sector of Pharmaceutical Company Listed in Indonesia Stock Exchange.
From the result of research, the average stock price of Sub-Sector of Pharmaceutical Company Listed in Indonesia Stock Exchange 2014 - 2016 is at 0.98. This indicates that the average stock price of Mining Sector Companies listed in the Indonesia Stock Exchange is Rp 0.98.
In this study, the value of stock prices above the average was in 2014. This proves that the stock price of companies in the year more favored by investors than in other years. The below average stock price value is also obtained in 2015 and 2016. This proves that stock prices in companies in the year were less attractive to investors, resulting in lower stock prices than in other years. Higher stock prices will be better for the company because stock prices can attract investors to buy shares in the company.
c. Evaluation of The Value of the Company in Sub-Sector of Pharmaceutical Company Listed in Indonesia Stock Exchange.
From the result of research, the average value of Registered Sub-Sector of Pharmaceutical Company listed in Indonesia Stock Exchange 2014 - 2016 period is at 4.48. This shows that the average value of the Company's Pharmaceutical Sub-Sector Listed in the Indonesia Stock Exchange is Rp 4.48.
In this study, the company's value above the average is in 2014 and 2016. This proves that the value of the companies in the year more favored by investors than in other years. The company's value below the average is also obtained in 2015. This proves that the company's value in companies in the year is less than the maximum. The higher the company's value will be the better for the company because it can attract investors to invest funds in the company
d. Evaluation of the Influence of Dividend Policy and Stock Price to The Value of the Company in Sub-Sector of Pharmaceutical Company Listed in Indonesia Stock Exchange.
Based on the results of linear regression testing above, it is known that the dividend policy of stock price has a positive influence on stock prices. It can be seen from regression equation that is Y = 2.487 – 1.058X1 + 2.560 X2. The effect is
1.058 which means that every 100% dividend increase will be followed by the increase of the value of the company equal to 105.8% and vice versa and the number 2.560 means that every 100% stock price increase will be followed by the value of the company increase equals to 256%.
From result of the determination obtained result that stock price can be explained by profitability that is equal to 25.8% and rest 74.2% explained by other variable not included in this research model.
dividend and the stock price of a company, the greater the investor's expectation to get the yield from the stock it has, so the greater the likelihood that the stock price will increase, which will increase the value of the company.
e. Evaluation of the Effect of Dividend Policy and Stock price on The value of the company with Leverage as Moderating Variable in Sub-Sector of Pharmaceutical Company Listed in Indonesia Stock Exchange.
The residual equation between the cooperative growth variable to the residual absolute value of the moderating variable (working capital) yields the equation of the residual test model as follows:
| e | = 0.030 + 0.028 Y
Result of analysis of residual test can be seen that variable of the value of the company have significant level> 0.05 and coefficient value of positive parameter, so it can be concluded that leverage variable is not moderating variable because from research result obtained significance number equal to 0,021> 0,05 which is normal standard of significance. Therefore, H2
which states dividend policy and stock price influence to firm value with leverage as moderating variable in Sub-Sector of Pharmaceutical Company Listed in Indonesia Stock Exchange accepted.
4. Conclusions and Suggestions
4.1. Conclusions
a. The average rate of dividend policy proportioned to the House of Representatives produced by the Sub-Sector of Pharmaceutical company Listed in the Indonesia Stock Exchange is 0.480. This means that the company uses an average of Rp 0.480.
b. The average stock price level as of December 31 generated by the Sub-Sector of Pharmaceutical company Listed in the Indonesia Stock Exchange is 0.98.
c. The average level of the value of the company generated by the Sub-Sector of Pharmaceutical company Listed in the Indonesia Stock Exchange is 4.48.
d. The dividend policy and stock price have an effect on the value of the company, it can be seen from the result of regression test which shows positive sign in the following equation: Y = 2.487 – 1.058 X1 + 2.560 X2, it
means the higher the value of dividend policy and stock price hence the value of the company increase.
e. Through the calculation of F test with the degree of significance used is 0.05 concluded that H0 is accepted,
which means that the dividend policy and stock price no significantly influence the value of the company in Sub-Sector of Pharmaceutical Company listed in Indonesia Stock Exchange.
f. Through the calculation of t test with the degree of significance used is 0.05 concluded that for X1, H0 is
accepted, which means that the dividend policy and stock price does not significantly affect the value of the
company in Sub-Sector of Pharmaceutical company listed in the Indonesia Stock Exchange partially and for X2, H0 is accepted, which means that dividend policy
and stock price have no significant effect to the value of the company at Sub-Sector of Pharmaceutical Company which listed in Indonesian Stock Exchange partially g. The result of analysis of residual test can be seen that
dividend policy and stock price influence to firm value with leverage as moderating variable in Sub Sector Pharmaceutical Company Registered in Indonesian Stock Exchange accepted.
h. Through correlation coefficient analysis, it is known that there is a moderate relationship between dividend policy and stock price to the value of the company in Sub-Sector of Pharmaceutical Company listed in Indonesia Stock Exchange is 0,508. While the coefficient of determination in the amount of 0.258 which means that the company's value can be explained dividend policy and stock price of 25.8% in Sub-Sector of Pharmaceutical company listed in the Indonesia Stock Exchange, the rest of 74.2% explained by other variables that are not included in this study
4.2. Suggestions
a. For investors and prospective investors it is advisable to first analyze the level of dividend policy and stock price before investing because dividend policy and stock price are very influential in determining the value of the company. This can be seen from companies that after observed the dividend policy rate and stock prices are also very low. And also must consider other factors that influence both internal and external such as the announcement of corporate financial statements, investment announcements, announcements from the government, and politics.
b. With regard to the limitations of the authors, this study still has weaknesses and has not been able to reveal all the variables that can affect the value of the company in Sub-Sector of Pharmaceutical Company Listed in the Indonesia Stock Exchange. As input for further research:
a) Preferably the study period may be longer, eg 10 years. With a longer term of research will provide maximum results of the research.
b) It is also desirable to conduct research using other variables besides dividend policy and stock price
References
[1] Astuti, D. (2004). Corporate finance management. Surabaya: Ghalia Indonesia.
[2] Brigham, E F. and Joel F. H, (2001). Financial management. 8th edition, book 1, Jakarta: Erlangga.
[4] Kasmir. (2010). Introduction to financial management, first edition, second print. Jakarta: Prenada Media Group.
[5] Keown, et. al. (2004). Financial management: Basic principles and applications, ninth edition, volume one. Jakarta: Index of Gramedia Group.
[6] Martani, et al. (2012). Intermediate financial accounting based on PSAK. Jakarta: Salemba Empat.
[7] Rudianto. (2009). Introduction to accounting. Jakarta: Erlangga.
[8] Subramanyam, K. R and John J. W. (2010). Financial statement analysis: Financial statement analysis, book one, edition ten. Jakarta: Salemba Empat.
[9] Sudana, I M. (2011). Corporate financial management: Theory and practice. Jakarta: Erlangga.
[10] Sugiono, A. (2009). Corporate financial management theory and practice, Jakarta: Erlangga.