Newton-Raphson Load-Flow Analysis in Complex form with UPFC
S.K.Salma Sulthana
1, M.Naga Jyothi
2M.Tech Scholar, EEE Dept, VNR VJIET, Telangana, India Assistant Professor, EEE Dept, VNR VJIET, Telangana, India
Abstract: The important implication of complex-variable Newton-Raphson load flow analysis is that reduction in memory access is achieved by the complex-variable Newton-Raphson method. This significant reduction in memory access achieved will lead to the advantage of substantial reduction in computing time which will increase the efficiency. In addition complex-variables offer a flexible and direct approach for modelling of UPFC. This paper develops a Newton-Raphson load flow analysis formulation which includes UPFC.A brief analysis on load flow calculation methods and UPFC is presented. Proposed system is simulated for IEEE 30 BUS system using Mi-Power software.
Keywords — Load flow analysis, Newton-Raphson method, complex functions and variables, FACTS devices.
I. INTRODUCTION
Load flow studies are limited to the transmission system, which involves bulk power transmission. Load flow studies are important in planning and designing future expansion of power systems. The study gives steady state solutions of the voltages at all the buses, for a particular load condition. Different steady state solutions can be obtained, for different operating conditions, to help in planning, designing and operation economic scheduling and exchange of power between utilities. Load flow analysis is to find the magnitude and phase angle of voltage at each bus and real and reactive power in each transmission line. The load flow problem consists of finding the power flows (real and reactive) and voltages of a network for given bus conditions. Because of the non linearity of the algebraic equations, describing the given power system, their solutions are obviously, based on the iterative methods only.
The iterative methods are as follows:
1) Gauss-Seidal method
2) Newton-Raphson method
3) Fast-coupled and method
4) Fast De-coupled method
ADVANTAGES OF LOAD FLOW ANALYSIS :
By performing load flow analysis we can reduce the transmission loss and voltage of each bus can be determined and the line flow losses can be known. The load flow problem consists of finding the real and reactive power flow and voltages of a network for given bus. The purpose of load flow analysis is to find the magnitude and phase angle of
voltage at each bus and real and reactive power flow each in transmission line.
Though the load flow analysis obtains the voltage magnitude and phase angle at each bus the important point to be observe is that the magnitude of the bus voltage are required to be held within a specified limit. Once the bus voltage magnitude and phase angle are computed using load flow analysis the real and reactive power flows through each transmission line. The real and reactive power supplied by a bus in a power network are expressed in terms of non-linear form. So therefore we require iterative methods for solving these non-linear equation.
II. NEWTON-RAPHSONMETHODINCOMPLEX
FORM
NR method gives the solution of non-linear simultaneous equations in rectangular or polar form. Time taken for the one iteration is high. Number of iterations required to get the convergent criteria are limited as 3.5 and does not depend on number of buses. Total time taken to get the convergent criteria is less. The selection of slack bus does not affect the convergent criteria. NR method is applicable for large power system applications.
The power system is a large interconnected system where various buses are interconnected by a transmission line. At any bus complex power is injected into the bus by generators and complex power is drawn by the loads. The complex power injected into the bus is equal to the sum of the complex power flows out of the bus via a transmission line.
Three-phase network can be represented by bus admittance equation system in matrix form as follows
Load flow equations: Power at bus P
S
p =V
p*I
p (1)S
p =P
p-jQ
p (2)P
p-jQ
p=V
p*(3)
P
p-jQ
p=*Y
pqV
q (4)NR method in Rectangular coordinates:
V
p=E
p+jF
p (5)Y
pq=G
pq-jB
pq (6)V
q=E
q+jF
p (7)1) SLACK BUS
voltage magnitude and phase angle are the specified parameters.The unknown parameters are the real and reactive power. In load flow analysis the network equations are solved by consedering generation and demand without the line loss
Generation=Demand+Losses
Pp=Ppg-Ppd (8)
Qp=Qpg-Qpd (9)
Where Pg is generation power and Pd is demand power.
The active and reactive power demand at node K the complex equation is formed as
Rk=S-(Pks+JQks) (10)
The complex residual function Rk*is given by as follows
Rk*=Sk*-(Pks-JQks) (11)
Rk and Rk* are the complex functions of complex variables and provide two independent equations for each load node. Based on partial derivates of Rk and Rk*with respect to V and V* the jacobian matrix elements in complex form corresponding to each load node are formed.
2) GENERATOR BUS :
It is also known as PV bus. In this generator bus P and V are specified quantites and Q and phase angle are unknown quantities.The synchrnous generator controlling the terminal voltage and real power supplied to the bus and this terminal voltage is kept constant by adjusting the feild current in the generator. The synchrnous generator work most efficiently at full capacity and the rest of the real power.When node K is a generator node the sum of RK. and RK* gives the residual function RKG .
RKG .= RK+ RK *
(12)
The residual function Ek for a generator node K is formed using voltage magnitude.
Ek=lVkl2-lVksl2 (13)
Guass seidel method is one of the common methods employed for solving power flow equations.
Advantages:
Simplicity in technique
Small computer memory requirement
Less computational time per iteration
Disadvantages:
Slow rate of convergence resulting in larger number of iterations
Increase in the number of iterations with increase in the number of buses
Newton Raphson Method:
Newton-Raphson method is the sophisticated and important method for solving power flow studies particularly
for the complex power systems. Newton Raphson method is based on Taylor’s series and partial derivatives.
Advantages:
Newton Raphson method needs less number of iterations to reach convergence, takes less computation time
More accurate and not sensitive to the factors such like slack bus selection, regulation transformers etc. and the number of iterations required in this method is almost independent of system size.
Disadvantages:
More calculations involved in each iteration and require large computation time per iteration and large computer memory
Difficult solution technique (programming is difficult)
III.MODELLINGOFFACTSDEVICES
Flexible AC Transmission Systems or FACTS device allows the flexible and dynamic control of power system. FACTS device is static equipment used for the AC transmission of electrical energy. It is meant to enhance controllability and to increase power transfer capability.
Examples of FACTS controllers for enhancing power system control:
1) Static Synchrnous Compensator (STATCOM) 2) Static VAR Compensator (SVC)
3) Unified Power Flow Control (UPFC) 4) Inter-phase power flow control (IPFC) 5) Static Synchrnous Series Controller (SSSC)
Classification:
Depending on the type of connection to the network FACTS devices can be divided into 4 types they are:
1) Serial controllers 2) Derivation controllers 3) Serial to Serial controllers 4) Serial- Derivation controllers
Benefits of FACTS DEVICES : 1) Increases system reliability 2) Increases power system stability
3) Increases dynamic and transient grid stability and reduction of loop flows.
environmental, right-of-way and Cost problems that are major hurdles for power transmission Network expansion.
Hence, there is interest in better utilization of available power system capacities by installing new devices such as Flexible AC Transmission Systems FACTS devices can be an alternative to reduce the flows in heavily loaded lines. Results in increased load ability, loss system , improved stability of the network, reduced cost of production and till filled requirement by controlling the power flows in the network. Variable series capacitors, phase shifters and unified power flow controllers will be utilized to change the power flow in the lines by changing their parameters to achieve various objectives.
FACTS devices provide new control facilities, both in steady state power flow control and dynamic stability control. The possibility of controlling power flow in an electric power system without generation rescheduling or topological changes can improve the performance considerably. The increased interest in FACTS devices is essentially due to two reasons.
Firstly, the recent development in high power electronics has made these devices cost effective and secondly, increased loading of power systems, combined with deregulation of power industry, motivates the use of power flow control as a very cost effective means of dispatching specified power transactions. It is important to ascertain the location for placement of these devices because of their considerable costs.
IV.UNIFIEDPOWERFLOWCONTROL(UPFC):
The UPFC is the most versatile and complex power electronic equipment that has emerged for the control and optimization of power flow in electrical power transmission systems. The UPFC was devised for the real time control and dynamic compensation of AC transmission systems.
Alternatively it can independently control both the REAL and Reactive power flow in the line unlike all other controllers.
UPFC is a combined series and shunt connected a controller which is a combination of STATCOM and SSSC which are coupled via a common D.C link to allow bi-directional flow of real power between series output terminals of SSSC and the shunt output terminals of the STATCOM and are controlled to provide real and reactive series compensation. The active power for the series unit (SSSC) is obtained from the line itself via the shunt unit (STATCOM).
Fig1 : Schematic diagram of UPFC
OPERATING PRINCIPLE OF UPFC
The UPFC is the most versatile and complex of the FACTS devices, combining the features of the STATCOM and the SSSC. The main reasons behind the wide spreads of UPFC are its ability to pass the real power flow bi-directionally maintaining well regulated DC voltage, work ability in the wide range of operating conditions etc .The basic components of the UPFC are two voltage source inverters (VSIs) sharing a common dc storage capacitor, and connected to the power system through coupling transformers. One VSI is connected to in shunt to the transmission system via a shunt transformer, while the other one is connected in series through a series transformer.
The DC terminals of the two VSCs are coupled and this creates a path for active power exchange between the converters. Thus the active supplied to the line by the series converter can be supplied by the shunt converter as shown in figure. The UPFC can be used to control the flow of active and reactive power through the transmission line and to control the amount of reactive power supplied to the transmission line at the point of installation.
inverter will exchange active and reactive power with the line. The reactive power is electronically provided by the series inverter, and the active power is transmitted to the dc terminals.
The shunt inverter is operated in such a way as to demand this dc terminal power from the line keeping the voltage across the storage capacitor Vdc . The UPFC has many possible operating modes: Var control mode, automatic voltage control mode, direct voltage injection mode, phase angle shifter emulation mode, line impedance emulation mode and automatic power flow control mode
The UPFC can also provide simultaneous control of all basic power system parameters, transmission voltage, impedance and phase angle. The net real power absorbed from the line by the UPFC is equal only to the losses of the inverters and their transformers. The remaining capacity of the shunt inverter can be used to exchange reactive power with the line so to provide a voltage regulation at the connection point.
V. RESULTSOFSIMULATIONS
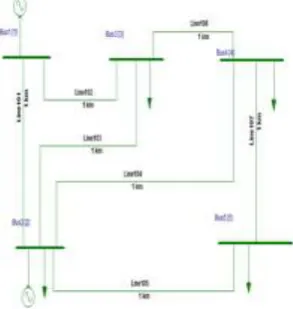
IEEE 5 Bus System:
Consider the IEEE 5 Bus system for the newton-raphson load flow analysis in complex form, which the results are listed below
Fig 2: IEEE 5 bus system
IEEE 30 Bus system:
Fig 3: IEEE 30 bus system FROM
NODE TO
NODE
FORWARD LOSS %LOA DING
MW MVAr MW MVAr
1 2 88.82 2
-8.587 1.4091 -2.4348 84.2%
1 3 40.72 3
1.157 1.1920 -1.8554 38.4%
2 3 24.70 9
3.547 0.3519 -3.2365 24.7%
2 4 27.94 9
2.962 0.4417 -2.9645 27.5%
2 5 54.83 8
7.342 1.1258 0.1774 52.8%
3 4 18.86 5
-5.203 0.0356 -1.9899 19.1% 4 5 6.331 -2.285 0.0307 -5.1177 6.8%
Area Wise Distribution Description
Values
MW Generation 169.545 MW MVAR Generation 22.570 MVAr
MW Load 165.000 MW MVAR Load 40.000 MVAr MVAR Compensation 0.0000
The Above Figure Shows the construction of IEEE 30Bus system using MIPOWER Software in which by maintaining all the buses limits, Transmission line limits, generator limits, load limits. By keeping all the constraints in limits this 30 bus system is been constructed.
This 30Bus system which it will be consisting of 30Buses, 41 Transmission lines, 6 generators, 20Loads. The system is divided into two areas such that, the generation is more than the local load demand in area1 and generation is less than the local load demand in area2. This indicates that the power flow direction is from area1 to area2. The algebraic sum of power flow gives the active power transfer from area1 to area2. It is observed to be 23.627MW.
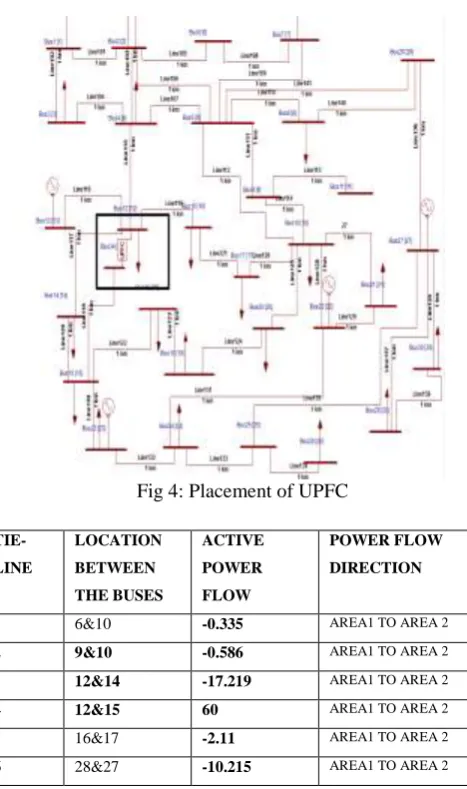
Case (1): Placement of UPFC Between 12 to 15 Buses
Fig 4: Placement of UPFC
Now, when the UPFC is implemented in the tie-line between the buses 12 & 15, the power flow through this line is
enhanced from 23.627MW to 29.538MW. The Active power transferred from area1 to area2 is obtained from the algebraic sum of power flows through all the tie-lines at this value.
Case (2): Placement of UPFC Between 16 to 17 Buses
Fig 5: Placement of UPFC
Now, when the UPFC is implemented in the tie-line between the buses 16 & 17, the power flow through this line is enhanced from 23.627MW to 24.204MW. The Active power transferred from area1 to area2 is obtained from the algebraic sum of power flows through all the tie-lines at this value
Case (3): Placement of UPFC Between 9 to 10 Buses
Now, when the UPFC is implemented in the tie-line between the buses 9 & 10 the power flow through this line is enhanced from 23.627MW to 26.417MW. The Active power transferred from area1 to area2 is obtained from the algebraic sum of power flows through all the tie-lines at this value
TIE-LINE
LOCATION
BETWEEN THE BUSES
ACTIVE
POWER FLOW
POWER FLOW
DIRECTION
1 6&10 0.514 AREA1 TO AREA 2
2 9&10 0.889 AREA1 TO AREA 2
3 12&14 4.101 AREA1 TO AREA 2
4 12&15 3.419 AREA1 TO AREA 2
5 16&17 22 AREA1 TO AREA 2
6 28&27 -6.729 AREA1 TO AREA 2
TIE-LINE
LOCATION
BETWEEN
THE BUSES
ACTIVE
POWER
FLOW
POWER FLOW
DIRECTION
Fig 6: Placement of UPFC
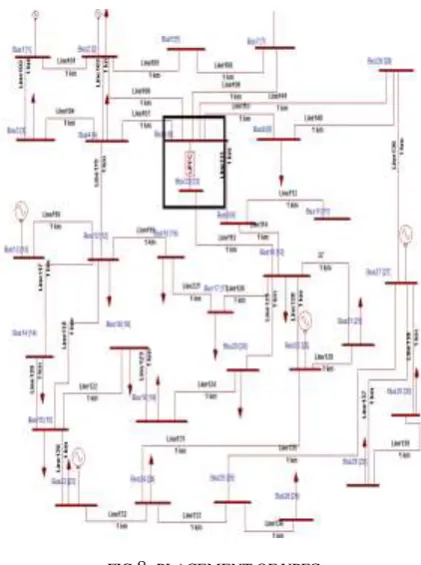
Case (4): Placement of UPFC Between 12 to 14 Buses
Now, when the UPFC is implemented in the tie-line between the buses 12 & 14 the power flow through this line is enhanced from 23.627MW to 26.162MW. The Active power transferred from area1 to area2 is obtained from the algebraic sum of power flows through all the tie-lines at this value
Fig 7: Placement of UPFC
Case (5): Placement of UPFC Between 6 to 10 Buses
FIG 8: PLACEMENT OF UPFC
Now, when the UPFC is implemented in the tie-line between the buses 6 & 10 the power flow through this line is enhanced from 23.627MW to 24.418MW The Active power transferred from area1 to area2 is obtained from the algebraic sum of power flows through all the tie-lines at this value
TIE-LINE
LOCATION
BETWEEN THE
BUSES
ACTIVE
POWER
FLOW
POWER FLOW
DIRECTION
1 6&10 -9.101 AREA1 TO AREA 2 2 9&10 35 AREA1 TO AREA 2 3 12&14 4.417 AREA1 TO AREA 2 4 12&15 7.628 AREA1 TO AREA 2 5 16&17 -0.287 AREA1 TO AREA 2 6 28&27 -10.94 AREA1 TO AREA 2
TIE-LINE
LOCATION
BETWEEN THE BUSES
ACTIVE
POWER FLOW
POWER FLOW
DIRECTION
CONCULSION
By performing load flow analysis using NEWTON-RAPHSON method the results obtained are accurate. MI-POWER software is executed to incorporate the UPFC model in NR method. To determine the steady state performance of the UPFC in the load flow studies a IEEE 5 and IEEE-30 bus systems has considered. From the analysis by Newton-Raphson method has simple calculations and is easy to execute, In Newton-Raphson approach the number of buses does not depends upon the number of iterations.
A MI-POWER program has executed to incorporate the steady-state mathematical model of UPFC in the conventional NR power flow algorithm. The steady state effect of UPFC has shown in different system. It is shown that when UPFC is incorporated in between two buses ′ the active and reactive power loses are reduced. It is also shown that not only the power losses are reduced, the voltage profile of the every bus also improved after incorporate UPFC.
REFERENCES
1) N. G. Hingorani, “Power Electronics in Electric Utilities: Role of Power Electronics in Future Power Systems”, Proceedings of the IEEE, Vol.76, NO. 4, pp 481-482, April 1988.
2) N. G. Hingorani, “Flexible AC transmission,” IEEE Spectra, vol. 30, no. 4, pp. 40–45, April 1993.
3) N.G.Hingorani and L.Gyugyi, “Understanding FACTS: concepts and technology of Flexible ac transmission systems”, IEEE Press, NY, 1999.
4) Hingorani, N.G., “High power electronics and flexible AC transmission system”, IEEE Power Eng. Reo, July 1988.
5) K.R.Padiyar, “FACTS Controllers in power transmission and distribution”, New Age International Publishers, 2007.
6) Abdul Haleem, Ravireddy Malgireddy, “Power Flow Control with Static Synchronous Series Compensator (SSSC)”, International Conference on Science and Engineering (ICSE), 2011, ISBN: 978-981-08-7931
TIE-LINE
LOCATION
BETWEEN THE
BUSES
ACTIVE
POWER
FLOW
POWER FLOW
DIRECTION