http://www.sciencepublishinggroup.com/j/ijfsb doi: 10.11648/j.ijfsb.20170204.17
Effect of Cooking Methods and Ripening Stages on the
Nutritional Compositions of Plantain (
Musa Paradisiaca
)
Agbemafle Robert
*, Aggor-Woananu Samira Elsie, Dzameshie Hayford
Department of Laboratory Technology, College of Agriculture and Natural Sciences, School of Physical Sciences, University of Cape Coast, Cape Coast, Ghana
Email address:
ragbemafle@ucc.edu.gh (A. Robert)
*
Corresponding author
To cite this article:
Agbemafle Robert, Aggor-Woananu Samira Elsie, Dzameshie Hayford. Effect of Cooking Methods and Ripening Stages on the Nutritional Compositions of Plantain (Musa Paradisiaca). International Journal of Food Science and Biotechnology. Vol. 2, No. 4, 2017, pp. 134-140. doi: 10.11648/j.ijfsb.20170204.17
Received: March 22, 2017; Accepted: April 5, 2017; Published: December 28, 2017
Abstract:
The effect of stage of ripening and cooking methods (boiling, roasting and frying) on the nutritional compositions of plantain (Musa spp.) were studied. Plantain fruits (Musa spp.) at the unripe (deep green), semi-ripe (yellow green) and fully ripe (deep yellow) stages of ripeness were analyzed for proximate, total sugar and mineral compositions, after boiling, roasting and frying alongside the uncooked (raw) fruits as control. Proximate and mineral compositions of the plantain flours were determined by standard AOAC methods. Total sugar contents of the plantain flours were determined using the volumetric method (Lane-Eynon method) described by Pearson’s compositions and analysis of foods. Result showed that ash, protein, fat, fibre, carbohydrate and total sugar contents ranged from 6.04% to 22.70%, 1.54% to 4.52%, 3.25% to 4.83%, 0.07% to 16.02%, 1.26% to 5.57% and 57.12% to 86.27%, 4.06% to 14.14% respectively. The mineral contents were 17.07 to 28.44 mg/100g, 4.92 to 9.36 mg/100g, 364.80 to 487.55 mg/100g, 0.10% to 0.39% and 0.16% to 0.42% for iron, zinc, potassium, magnesium and calcium respectively. On the whole, the result showed that roasting and boiling of semi-ripened and unripened plantain best conserved its nutrients.Keywords:
Boiling, Roasting, Frying,Proximate Composition, Fiber, Carbohydrate1. Introduction
Plantain (Musa spp.) is a perennial crop used as a source of starchy staple for millions of people in West and Central Africa and it is cultivated in many tropical and sub-tropical countries of the world [1, 2]. In West and Central Africa and the Caribbean, plantain is of great economic and nutritional significance. It generates considerable income for smallholders who produce them in compound farms either in mixtures or sole plots. Nearly 90% of the total plantain produced worldwide (63 million tonnes) are consumed locally in the producing countries leaving merely 10% for export [3], and only a very small proportion is processed to storable products [4]. Plantain can be eaten boiled, roasted, grilled or fried. When not yet ripe, it contains lots of starch, its skin remains green and it has a neutral taste. Plantain may be consumed unripe (green), yellow green or fully ripe (yellow) after cooking [5].
deficiency of zinc has been implicated in poor growth, hypogonadism and anaemia [11].
Plantains unlike bananas which are conventionally consumed raw as dessert are mostly eaten after cooking. Boiling, steaming, roasting and deep-frying are the major cooking methods employed in plantain fruit utilization. It is unfortunate that the extent to which the composition of plantain is affected by the various ripening stages and heat processing methods are not known. Knowledge on how the ripening stages and cooking methods affect the level of the composition could help establish the best cooking method and the ripening stage that maintain the integrity of the components. The objective of this study was to assess the effect of three cooking methods employed in cooking plantain (boiling, roasting and frying) and control (raw fruit) at three ripening stages ( dark green, yellowish green and fully-ripe yellow) on the proximate and some minerals compositions of the plantain as food.
2. Materials and Methods
2.1. Study Area
The study was conducted on a plantain plantation at Abura Dunkwa in the Abura-Asebu-Kwamankese District, Central region of Ghana. The district covers a total area of 380 square kilometers.
2.2. Experiment Design
The study was carried out on one variety of plantain (Apantu) and also three cooking methods (boiling, roasting and frying) and ripening stages (deep-green, yellow-green and deep-yellow) were observed. The experiment was a 4 x 3 factorial in completely randomized design (CRD). Factor A was the cooking methods: boiling, frying, roasting and the no-cooking (raw) fruit as control. Factor B was stages of fruit ripeness, which are deep green (harvest stage greenness), yellowish green stage and the deep yellow stage following the ten ripening stages described by Baiyeri (2005).
2.3. Sample Collection and Treatment
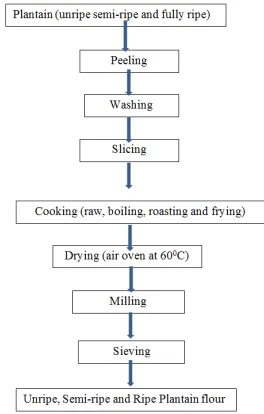
A bunch of mature plantain was randomly selected from a commercial plantation located within the study area. A total of 30 fingers of plantain were randomly selected, of which 10 were dark green, 10 yellowish green and the other 10 fully-ripened. The plantain fingers were peeled and cut into equal size and subjected to boiling, roasting and frying while some portions were left uncooked (control). The plantain samples were then chopped into smaller pieces and were placed in the oven pre-set at 60°C for 24 hours to dry off the moisture. After oven drying, the samples were ground into powder with the aid of a pestle and mortar (porcelain mortar) prior to analysis. The analysis was carried out in the School of Agriculture Research Laboratory, University of Cape Coast Ghana. The flow chart of the entire process is given in Plate 1.
Figure 1. Flow chart for the production of plantain flour.
2.4. Analysis of Proximate, Total Sugar and Mineral Compositions
2.4.1. Proximate and Total Sugar Analysis
Moisture contents of the plantain flour samples were determined using the oven drying method, ash content by incinerating the plantain flour samples at 550°C in a muffle furnace, protein contents by Kjeldahl method (Nx6.5), fat contents by Soxhlet extraction and fibre contents by weighing the acid and alkaline treated defatted sample all as described by AOAC [12]. Carbohydrate contents of the plantain flour samples were determined by difference (% carbohydrate = 100 -% moisture +% ash +% protein +% fat +% fibre) [13]. Total sugar contents of the plantain flours were determined using the volumetric method (Lane-Eynon method) described by Kirk and Sawyer [13].
2.4.2. Mineral Composition Analysis
Iron and zinc contents were determined by Atomic Absorption Spectrometry as described by AOAC [12], potassium contents of the plantain flour samples were determined by flame photometry, calcium and magnesium contents by EDTA titration described by AOAC [12]. All chemicals used were of Analar grade.
2.5. Statistical Analysis
The results are presented as the mean and standard deviation of two replicates each. Two-way analysis of variance (ANOVA) was used to analyse the effect of different ripening stages and different cooking methods on the proximate and mineral composition of plantain using Graphpad Prism version 6.1 package. Significant differences between means were determined by Tukey’s post hoc test at 95% confidence level.
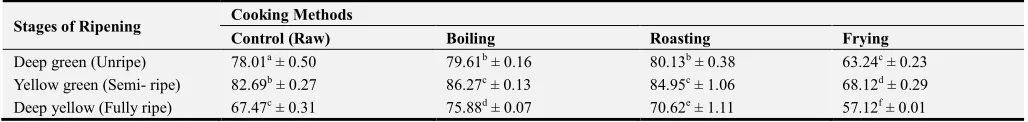
compositions (dry weight basis) of plantain at various stages of ripening and different cooking methods are presented in tables 1-11.
On dry basis, moisture content ranged from 6.04% to 22.70% and was significantly (p<0.05) influenced by the ripening stages and cooking methods with roasted plantain
fruit of the yellow-green (semi-ripe) having the lowest moisture content (Table 1). Moisture content of food gives an indication of the shelf- life and nutritive values. Moisture content in plantain fruit gradually increased during ripening due to carbohydrate breakdown and osmotic transfer from peel to fruit pulp.
Table 1. Moisture content (%) of plantain at different ripening stages and different cooking methods.
Stages of Ripening Cooking Methods
Control (Raw) Boiling Roasting Frying
Deep green (Unripe) 12.90a ± 0.02 12.41b ± 0.03 12.05c ± 0.07 10.85d ± 0.07
Yellow green (Semi- ripe) 8.33b ± 0.08 6.93c ± 0.03 6.04d ± 0.04 6.29e ± 0.07 Deep yellow (Fully ripe) 22.70c ± 0.01 19.67d ± 0.02 14.42e ± 0.01 15.35f ± 0.02
Mean of two replicates with standard deviation. Means with same letters along the same column and along the same row are not significantly different at p<0.05
The moisture content was high in the deep-yellow (fully ripe) ripening stage thus making it not suitable for storage. Moisture content is a key to determining when a substance is safe to be packaged [14]. In general moisture content of plantain as compared other food substances like cereals, fruits, vegetables and root crops are quite low. The high moisture levels of these food crops suggest that the staple foods may not store for a long time due to high water activity. This may cause quality problem as the samples may be liable to bacterial spoilage during storage [15, 16]. The low values of moisture for the various plantain samples
analyzed are indicative that plantains store better than the other staples [16].
The result of the effect of ripening stages and cooking methods on the ash content of plantain is shown in Table 2. The ash content of the plantain samples ranged from 1.54% to 4.52% with frying cooking method of deep-green ripening stage as lowest and deep yellow ripening stage as highest. Significant differences (p<0.05) existed in the ash contents of the plantain samples at the various ripening stages and cooking methods.
Table 2. Ash content (%) of plantain at different ripening stages and different cooking methods.
Stages of Ripening Cooking Methods
Control (Raw) Boiling Roasting Frying
Deep green (Unripe) 2.92a ± 0.01 2.47e ± 0.02 3.03ad ± 0.05 1.54c ± 0.08
Yellow green (Semi- ripe) 2.87ab ± 0.02 2.77b ± 0.02 2.88bd ± 0.01 2.56e ± 0.04
Deep yellow (Fully ripe) 3.31c ± 0.03 3.14d ± 0.03 4.38e ± 0.02 4.52f ± 0.07
Mean of two replicates with standard deviation. Means with same letters along the same column and along the same row are not significantly different at p<0.05
Ash content of a food gives an indication of the mineral composition of the food sample. Roasting as cooking method had the highest ash content for all ripening stages. Water losses, occurring during frying and roasting may have resulted in higher ash content in roasted and fried plantain. The lower ash contents obtained for the boiled plantain samples may be due to loss of minerals into the cooking water. Values obtained were comparable to the ranges of 1.75% to 3.00% dry weight as reported by Baiyeri et al. [9].
Protein content ranged from 3.25% to 4.83% with the yellow-green (semi-ripe) ripening stage and roasting cooking method having the highest. There were significant differences (p<0.05) in the protein content of ripening stages
and cooking methods of plantain fruit (Table 3).
Decrease in crude protein content could be attributed to denaturation and decomposition of its product at high cooking temperatures. Ijeh et al. [17] reported similar reduction in the protein contents of boiled and roasted African breadfruit (Treculia africana) seeds. The changes in the protein content of plantain could also be attributed to leaching of nitrogen–containing compounds to the cooking medium or possible interaction of proteins with other food components [18]. The values obtained were comparable to the ranges of 2.48% to 3.50% as reported by Baiyeri et al.
[9].
Table 3. Protein content (%) of plantain at different ripening stages and different cooking methods.
Stages of Ripening Cooking Methods
Control (Raw) Boiling Roasting Frying
Deep green (Unripe) 3.85a ± 0.12 3.69a ± 0.12 3.54a ± 0.15 4.01a ± 0.00
Yellow green (Semi- ripe) 4.24ab ± 0.03 4.03ab ± 0.24 4.83c ± 0.06 3.42d ± 0.21 Deep yellow (Fully ripe) 4.44bc ± 0.29 4.59c ± 0.24 3.85ad ± 0.12 3.25de ± 0.29
Fat content ranged from 0.07% to 16.02%. There were significant differences (p<0.05) in fat content for ripening and cooking methods of the plantain (Table 4). Frying cooking method of deep-green (unripe) stage of ripening recorded the highest fat content. The high fat content of the
fried plantain samples may be due to oil absorption during the frying process. Furthermore, the increase of fat content of the fried samples can be attributed to the oil penetration on the food after water is partially lost by evaporation [19].
Table 4. Fat content (%) of plantain at different ripening stages and different cooking methods.
Stages of Ripening Cooking Methods
Control (Raw) Boiling Roasting Frying
Deep green (Unripe) 0.82a ± 0.01 0.64ab ± 0.01 0.42b ± 0.01 16.02c ± 0.29
Yellow green (Semi- ripe) 0.67ab ± 0.01 0.18c ± 0.01 0.13c ± 0.01 14.19d ± 0.04
Deep yellow (Fully ripe) 0.14d ± 0.05 0.55ae ± 0.01 0.07cd ± 0.00 15.06f ± 0.07
Mean of two replicates with standard deviation. Means with same letters along the same column and along the same row are not significantly different at p<0.05
Roasting as a cooking method had low fat for the three ripening stages of plantain of which deep-yellow (fully ripe) stage had the lowest fat. Fat content decreased with increase in ripeness. The low fat content of the roasted samples would enhance the storage life of the plantain due to the lowered chance of rancid flavour development.Values obtained were comparable to ranges of 0.33% to 2.33% as reported by Baiyeri et al. [9].
Values obtained for crude fibre content ranged from 1.26% to 5.57%. Fibre was high for the three ripening stages under
the frying cooking method with the yellow-green (semi-ripe) as the highest. There were significant differences (p<0.05) for the ripening stages and cooking methods (Table 5). The effect of thermal treatment (extrusion cooking, boiling and frying) on the dietary fibre composition of cereals and potato samples was reported by Varo et al. [20], who stated that heat treated potato samples contained more water insoluble dietary fibre and less starch than raw samples. Frying of plantain has been found to lead to a significant increase the fibre content for all stages of ripeness.
Table 5. Fibre content (%) of plantain at different ripening stages and different cooking methods.
Stages of Ripening Cooking Methods
Control (Raw) Boiling Roasting Frying
Deep green (Unripe) 1.80a ± 0.02 2.11b ± 0.00 2.67e ± 0.02 4.54f ± 0.05
Yellow green (Semi- ripe) 1.26b ± 0.01 1.82d ± 0.02 1.82d ± 0.01 5.57c ± 0.02
Deep yellow (Fully ripe) 1.46c ± 0.02 1.49c ± 0.01 2.44c ± 0.02 4.66d ± 0.04
Mean of two replicates with standard deviation. Means with same letters along the same column and along the same row are not significantly different at p<0.05
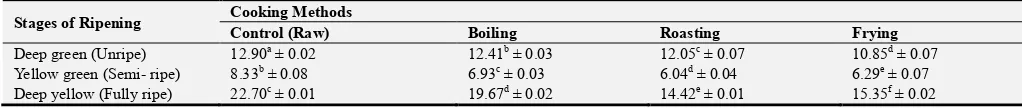
Carbohydrate content was found to range from 57.12% to 86.27%. It was observed that carbohydrate content decreased with ripening and it might be as a result of the conversion of soluble carbohydrates to simple sugars. Yellow-green (semi-ripe) ripening stage had high
carbohydrate contents under the various cooking methods with boiling as the highest. There were significant differences (p<0.05) in carbohydrate contents for the ripening stages and cooking methods (Table 6).
Table 6. Carbohydrate content (%) of plantain at different repining stages and different cooking methods.
Stages of Ripening Cooking Methods
Control (Raw) Boiling Roasting Frying
Deep green (Unripe) 78.01a ± 0.50 79.61b ± 0.16 80.13b ± 0.38 63.24c ± 0.23
Yellow green (Semi- ripe) 82.69b ± 0.27 86.27c ± 0.13 84.95c ± 1.06 68.12d ± 0.29
Deep yellow (Fully ripe) 67.47c ± 0.31 75.88d ± 0.07 70.62e ± 1.11 57.12f ± 0.01
Mean of two replicates with standard deviation. Means with same letters along the same column and along the same row are not significantly different at p<0.05
The increase in carbohydrate content with boiling might have been due to the fact that carbohydrates might have absorbed water to bulk up via cross-linking reaction probably induced by heat generated by boiling. This may increase the stability of the carbohydrates thereby enhancing resistance to further heat [21].
Table 7. Sugar content (%) of plantain at different repining stages and different cooking methods.
Stages of Ripening Cooking Methods
Control (Raw) Boiling Roasting Frying
Deep green (Unripe) 4.39a ± 0.35 4.26a ± 0.23 4.68a ± 1.38 4.06a ± 0.22
Yellow green (Semi- ripe) 8.49b ± 1.18 8.47b ± 0.84 8.88b ± 1.23 8.17b ± 1.34 Deep yellow (Fully ripe) 14.14c ± 1.87 13.57c ± 0.16 13.72c ± 0.21 13.36c ± 0.27
Mean of two replicates with standard deviation. Means with same letters along the same column and along the same row are not significantly different at p<0.05
Roasting as a cooking method had high sugar contents compared to the other cooking methods whiles deep green (unripe) and yellow green (semi-ripe) had low sugar content compared to the deep yellow (fully ripe). There no significant differences (p>0.05) the total sugar content of the plantain for the various the cooking methods. Values were comparable to
5.53% for unripe and 12.8% for ripe plantain fruits as reported by Egbebi and Bademosi [23].
Iron is an essential component of hemoglobin and it is critical to the proper functioning of the immune system and the production of energy. Iron contents obtained from this study ranged from 17.07 mg/100g to 27.99 mg/100g.
Table 8. Iron content (mg/100g) of plantain at different ripening stages and different cooking methods.
Stages of Ripening Cooking Methods
Control (Raw) Boiling Roasting Frying
Deep green (Unripe) 17.07a ± 0.21 20.44f ± 0.15 25.65c ± 1.68 21.91dh ±0.74 Yellow green (Semi- ripe) 20.73be ± 0.36 19.61bd ± 1.87 20.32bf ± 0.08 27.99c ± 0.01 Deep yellow (Fully ripe) 21.80eh ± 1.68 19.01d ± 0.26 20.66def ± 0.38 23.60h ± 0.45
Mean of two replicates with standard deviation. Means with same letters along the same column and along the same row are not significantly different at p<0.05
Frying as a cooking method for yellow green ripening stage had highest iron content and boiling cooking method for deep yellow ripening stage had the lowest iron content. Significant differences (p<0.05) were observed in the iron contents of the plantain for ripening stages and cooking methods (Table 8). Minerals are not destroyed by heating and they have low volatility compared to other food components.
The increase in iron content observed could be as a result of the removal of moisture which tends to increase the concentration of the iron.
Zinc plays a key role in the regulation of insulin production by pancreatic tissues and glucose utilization by muscles and fat cells [24]. It was observed in this study that zinc content ranged from 4.92 mg/100g to 9.36 mg/100g.
Table 9. Zinc content (mg/100g) of plantain at different ripening stages and different cooking methods.
Stages of Ripening Cooking Methods
Control (Raw) Boiling Roasting Frying
Deep green (Unripe) 8.19a ± 0.13 7.93a ± 0.29 7.50ad ± 0.08 8.19a ± 0.50
Yellow green (Semi- ripe) 9.36ab ± 0.68 6.02ce ± 0.26 7.50cd ± 0.61 6.53ed ± 0.13 Deep yellow (Fully ripe) 5.90f ± 1.20 5.42cf ± 0.47 6.35df ± 0.19 4.92f ± 0.31
Mean of two replicates with standard deviation. Means with same letters along the same column and along the same row are not significantly different at p<0.05
Roasting and frying as cooking methods had high amount of zinc content for deep green (unripe) and yellow green (semi-ripe) ripening stages. Zinc content significantly decreased (p<0.05) at various ripening stages (Table 9). Significant differences (p<0.05) in the zinc contents of the plantain were observed for ripening stages and cooking methods. The values were comparable to ranges of 5.52 mg/100g to 8.26 mg/100g as reported by Baiyeri et al. [9].
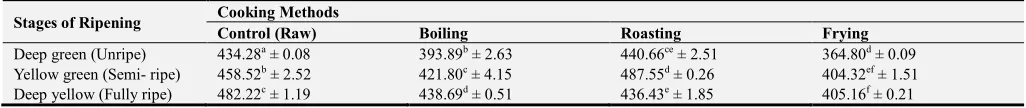
Potassium content ranged from 364.80 mg/100g to 487.55 mg/100g. Roasted plantain had highest potassium content as compared to boiling and frying for deep green (unripe) and yellow green (semi-ripe) ripening stages of plantain. Significant differences (p<0.05) in the potassium content of the plantain were observed for ripening stages and cooking methods (Table 10).
Table 10. Potassium content (mg/100g) of plantain at different ripening stages and different cooking methods.
Stages of Ripening Cooking Methods
Control (Raw) Boiling Roasting Frying
Deep green (Unripe) 434.28a ± 0.08 393.89b ± 2.63 440.66ce ± 2.51 364.80d ± 0.09 Yellow green (Semi- ripe) 458.52b ± 2.52 421.80c ± 4.15 487.55d ± 0.26 404.32ef ± 1.51 Deep yellow (Fully ripe) 482.22c ± 1.19 438.69d ± 0.51 436.43e ± 1.85 405.16f ± 0.21
The increase in concentration potassium in the roasted plantain could be due to increase in minerals in the pulp through loss of water during the roasting process. A surface crust is readily formed around the plantain during roasting resulting in the sealing of the intracellular spaces; this could be the reason for the minimized losses that might have arisen as result of possible volatilization. Values obtained are comparable to 499 mg/100g as reported by USDA [25].
Calcium content ranged from 0.16% to 0.42%. Frying and roasting cooking methods showed high calcium contents of
the plantain for yellow green (semi-ripe) and deep yellow (fully ripe) ripening stages. No significant differences (p>0.05) were observed in the calcium contents of the plantain for the ripening stages and cooking methods (Table 11). Calcium is an important component of intracellular processes that occur within insulin responsive tissues like skeletal muscle and adipose tissue. Alteration in calcium flux can have adverse effects on insulin secretion which is a calcium-dependent process [26].
Table 11. Calcium content (%) of plantain at different ripening stages and at different cooking methods.
Stages of Ripening Cooking Methods
Control (Raw) Boiling Roasting Frying
Deep green (Unripe) 0.23a ± 0.13 0.16a ± 0.04 0.21a ± 0.00 0.21a ± 0.00
Yellow green (Semi- ripe) 0.21a ± 0.09 0.27a ± 0.00 0.32a ± 0.13 0.26a ± 0.04 Deep yellow (Fully ripe) 0.25a ± 0.14 0.27a ± 0.16 0.21a ± 0.00 0.42a ± 0.18
Mean of two replicates with standard deviation. Means with same letters along the same column and along the same row are not significantly different at p < 0.05
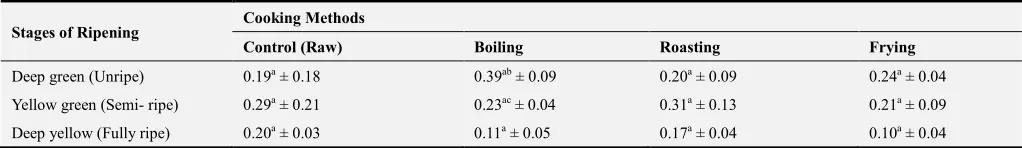
Magnesium content ranged from 0.10% to 0.39%. Boiling and roasting cooking methods had high content of magnesium compared to frying. There were no significant differences (p>0.05) in the magnesium contents of the plantain for ripening stages and cooking methods (Table 12).
Table 12. Magnesium content (%) of plantain at different ripening stages and at different cooking methods.
Stages of Ripening Cooking Methods
Control (Raw) Boiling Roasting Frying
Deep green (Unripe) 0.19a ± 0.18 0.39ab ± 0.09 0.20a ± 0.09 0.24a ± 0.04
Yellow green (Semi- ripe) 0.29a ± 0.21 0.23ac ± 0.04 0.31a ± 0.13 0.21a ± 0.09
Deep yellow (Fully ripe) 0.20a ± 0.03 0.11a ± 0.05 0.17a ± 0.04 0.10a ± 0.04
Mean of two replicates with standard deviation. Means with same letters along the same column and along the same row are not significantly different at p < 0.05
Magnesium is a cofactor of hexokinase and pyruvate kinase and it also modulates glucose transport across cell membranes [27].
Plantain fruit at the unripened and semi-ripened stages was observed to be rich in iron, potassium, zinc and calcium. Similar findings have been reported in banana and other plantain varieties [8, 28], suggesting that maximum dietary benefit of these minerals could be obtained when plantain fruits are consumed at the unripe stage.
4. Conclusion
The study revealed that roasting as method of cooking plantain conserved the largest amount of nutrients followed by boiling and frying. The study also revealed that cooking plantain at the semi-ripened stage retains most of the nutrients analyzed. It is therefore recommended that for the maximum amount of nutrients to be derived from plantain when eaten, the plantain should be cooked by roasting or boiling at the semi–ripened stage.
References
[1] Bhat KV, Amaravathi Y, Gautam PL and Velayudhan KC (2009). AFLP characterization and genetic diversity analysis of Indian banana and plantain cultivars (Musa spp). Plant-Genetic – Resources – Characterization and utilization. 2 (2): 121-130.
[2] De Langhe E (2000). Diversity in the genus Musa its significance and its potential. Acts Horticultural. 54: 81-88.
[3] Awodoyin R (2003). Plantain production as a business. Hort. Magazine, 1 (1):11-13.
[4] Adeniji TA and Empere CE (2001). The development, production and quality evaluation of cake made from cooking banana flour. Global J. Pure Applied Science, 633-635.
[6] Adegboyega OK (2006). The Proximate Chemical Composition, the Carbohydrate Constituents and the Amino Acid Make-Up of Green and Ripe plantain. AfricanJournal of Food Agriculture, Nutrition and Development, 24:70-77.
[7] Baiyeri KP (2000). Effect of Nitrogen fertilization on mineral concentration in plantain (Musa AAB) fruit peel and pulp at unripe and ripe stages. Plant Prod. Res. J. 38–43.
[8] Baiyeri KP and Unadike GO (2001). Ripening stages and days after harvest influenced some biochemical properties of two Nigerian plantain (Musa species AAB) cultivars. Plant Prod. Res. J. 11–19.
[9] Baiyeri KP, Ede AE, Otitoju GT, Mbah O, Agbo E, Tenkouano A and Faturoti BO (2009). Evaluation of iron, zinc, potassium and proximate qualities of five Musa genotypes. J. Appl. Bioscience. 18:1003-1008.
[10] Stevens GA, Finucane MM and De-Regil LM (2013). The Lancet Global Health,Volume 1, Issue 1.
[11] Ihekoronye AI and Ngoddy PO (1985). Integrated Food Science and Technology for the Tropics. Macmillan Publishers Ltd., London.
[12] AOAC. (2000). Association of Official Analytical Chemists. Official Methods of Analysis. 17th ed, Washington, DC, USA.
[13] Onyeike EN, Ihugba AC and George C (2003). Influence of heat processing on the nutrient composition of vegetable leaves consumed in Nigeria. Plant Foods Hum. Nutr. 58:1-11.
[14] Lee D. S., Yam K. L., Piergiovanni L. 2008. Food Packaging Science and Technology. Boca Raton, Florida: CRC Press.
[15] Ezeonu FC, Egboka BCE and Eze SS (1994). Fertilizer application, nitrate loading patterns, water resources quality and their ecotoxicogical implications in Awka area of Nigeria. Environ. Toxic Water Quality 9:141-143.
[16] Kirk RS and Sawyer R (1991). Pearson’s Composition and Chemical Nalysis of Foods, 9th Edition. Longman Scientific & Technical, Essex, England.
[17] Ijeh II, Ejike CE, Nkwonta OM and Njoku BC (2010). Effect of traditional processing techniques on the nutritional and phytochemical compositions of African breadfruit (Treculia
africana) seeds, Journal of Applied Science and Environmental Management, 14(4):169–173.
[18] Ahenkora K, Kyei MA, Marfo EK and Banful B (1995). Nutritional composition of falsehorn Apantu pa plantain during ripining and processing. African Crop Science Journal 5(2):243-248.
[19] Saguy IS, Dana D (2003). Integrated approach to deep fat frying: Engineering, nutrition, health and consumer aspects. Journal Food Engineering 56:143-152.
[20] Varo P, Laine R, Koivistoinen P (1983). Effect of heat treatment on dietary fibre: inter laboratory study. J Assoc Off Anal Chem. 66(4):933–938.
[21] Nzewi D, Egbuonu ACC (2011). Effect of boiling and roasting on the proximate properties of asparagus bean (Vigna Sesquipedalis). Afr. J. Biotechnol. 10(54):11239-11244.
[22] Marriott J. (1981). Starch and sugar transformation during the ripening of plantains and bananas. Journal of the Science of Food and Agriculture 32(10):1021-1026.
[23] Egbebi AO and Bademosi TA (2012) Chemical Compositions of Ripe and Unripe Banana and Plaintain. International Journal of Tropical Medicine and Public Health, 1 (1), 1-5.
[24] Huang L. and Kirschke CP (2016). Down-Regulation of Zinc Transporter 8 (SLC30A8) in Pancreatic Beta-Cells Promotes Cell Survival. Austin J Endocrinol Diabetes 3(1): 1037.
[25] USDA (2005). Compositions of Foods. U S Department of Agriculture Hand Book.
[26] Khalid S, Nahla B and Salini S (2014). Variation in Macro and Trace Elements in Progression of Type 2 Diabetes. The Scientific World Journal, 2014:1-9.
[27] McNeill DA, Herbein JH and Ritchey SJ (1982). Hepatic Gluconeogenic enzymes, plasma insulin and glucagon response to magnesium deficiency and fasting. J Nutr. 112(4):736-743.