A Mobile Crowd-Sensing Platform for Noise Monitoring
in Smart Cities
M. Zappatore
1,*, A. Longo
1, M.A. Bochicchio
1, D. Zappatore
1, A.A. Morrone
1and G. De Mitri
11Dept. of Innovation Engineering, Univ. of Salento, via Monteroni sn, 73100 Lecce, Italy
Abstract
Modern cities are moving towards novel approaches for urban sustainability for improving citizenship’s life quality, thus aiming at the Smart City model. Environmental and mobility issues represent two key areas where policy makers address their interventions and, amongst them, noise pollution is one of the most significant causes of public concern. However, noise monitoring campaigns are expensive and require skilled personnel. A viable alternative is represented by Mobile Crowd Sensing (MCS) paradigm, which exploits mobile devices as sensing platforms. In this paper, we propose a MCS-based platform that exploits noise measurements collected by citizens and offers a suggestion system to city managers about noise abatement measures (in terms of both estimated noise reduction and average installation costs). Several field tests demonstrated the feasibility of this approach as a suitable way to support city managers and to widen the possibilities of collaborative urban noise monitoring.
Keywords: Mobile Crowd Sensing, Urban Noise Monitoring, Urban Traffic Noise Abatement Measures, Data Warehouse. Received on 30 November 2015, accepted on 29 April 2016, published on 20 July 2016
Copyright © 2016M. Zappatoreet al., licensed to EAI. This is an open access article distributed under the terms of the Creative Commons Attribution licence (http://creativecommons.org/licenses/by/3.0/), which permits unlimited use, distribution and reproduction in any medium so long as the original work is properly cited.
doi: 10.4108/eai.18-7-2016.151627
1. Introduction
The continuous improvement in wireless communications, boosted by a series of key technological enablers [1], is nowadays not comparable to any other communication technology. This has originated a shift towards new reference models for networks, devices and standards. As for the mobile devices, we can observe how smartphones, tablets and wearable devices are quickly replacing PDAs, laptops and notebooks as the new boundary, since they combine high computational power, embedded sensors (e.g., accelerometers, gyroscopes, light, magnetometers, etc.), smart and intuitive user interfaces. As for the network infrastructures, the broadband capabilities of novel 4G wireless communication standards (i.e., LTE† and LTE-A‡ [2]) promise up to 1GB/s transfer speed and high-quality coverage. Moreover, many other contexts are benefitting
*Corresponding author. marcosalvatore.zappatore@unisalento.it
† LTE: Long Term Evolution (wireless communication standard)
‡ LTE-A (also known as LTE+): LTE Advanced (wireless communication standard)
from wireless communications: smart homes with interconnected household appliances, automated industry processes and remote applications represent indeed other concrete situations where mobile devices can prove their effectiveness.
The penetration rate of mobiles into daily life activities, and the corresponding users’ familiarization level with such devices, are nowadays so significant that mobiles can be leveraged as an effective way to improve life quality conditions as well as an effective technological driver for offering a wide range of services within smart cities. One of the most appealing trends in exploiting mobiles pervasively is represented by their usage as sensor data sources, as described by a new sensing paradigm named Mobile Crowd Sensing (MCS) [3].
According to MCS principles, mobiles, along with their built-in sensors and additional pluggable sensors, represent very powerful sensing nodes that overcome typical
Research Article
limitations of Wireless Sensor Networks (WSNs). On the one hand, from a communication network point of view, they can provide wider coverage areas, greater number of deployable nodes (without requiring any reconfiguration procedure when new nodes have to be added) and more reliable connectivity (thanks to the wireless communication networks serving the mobile). On the other hand, if we consider the sensing capabilities offered by mobile devices, they can offer sufficient levels of accuracy thanks to their embedded sensors or external, pluggable – and more accurate – sensors. Therefore, if mobiles are used as sensor data sources in a reasonable way, and even if such devices obviously do not replace professional metering equipment but simply complement their capabilities, they can be used to fulfil a series of relevant tasks. Amongst these tasks we can enlist: 1) being dynamically scattered across huge areas with heterogeneous and complex sensing purposes; 2) acquiring contextual awareness opportunistically from the surrounding environment; 3) allowing users to improve their knowledge about specific scientific phenomena and research challenges; 4) allowing easy integration with other ICT platforms in smart cities [4]. Consequently, multiple roles can be envisioned for mobile devices [5] according to the MCS paradigm.
Firstly, MCS allows defining innovative services capable of managing contextual information and suitable to interact with user’s social and physical situations. Secondly, mobile devices represent a promising solution to engage their owners in collaborative, large-scale monitoring experiences. This may effectively promote wide participatory contributions from citizens, yearning of life quality improvement, as well as positive behavioural changes in citizenship about environmental sustainability. Additionally, this makes possible to harvest large and heterogeneous amounts of information from citizens, describing their continuously evolving urban environments. Such data can be forwarded to city managers, thus allowing them to have better awareness of the potential issues affecting their municipalities, without relevant additional costs.
Finally, mobile devices can enlarge the scope of traditional monitoring campaigns significantly, so that the expensive deployment and maintenance of professional metering equipment can be spared for ad-hoc interventions only in those city areas where the noise levels highlighted by MCS-mediated campaigns are higher.
The features enlisted so far fit perfectly with the requirements of modern smart cities, where contextual information availability, collaborative monitoring and relevant data streams about urban environments are fundamental aspects to be achieved.
By starting from such premises, in this research activity, we opted for the urban noise-monitoring scenario, which is gaining relevance in modern cities as assessed by several reports from the European Commission. Europeans, indeed, are becoming more and more concerned about how noise can affect their quality of life and, consequently, policy makers should consider noise-related aspects when dealing with urban and traffic monitoring and planning.
We propose a platform with the following features: 1) direct involvement of users in sensing activities; 2) suggestion of noise abatement interventions to local administrators; 3) gathering of users’ opinions in order to obtain psychoacoustic measurements (i.e., how sound is perceived by humans in terms of loudness, sharpness and direction [6]). In addition to the benefits achievable by the adoption of MCS briefly outlined so far, these three features contribute to improve the overall quality of currently available MCS solutions in the noise-monitoring domain, which are typically tailored to single user’s needs and do not provide any kind of valuable suggestions to city managers.
Our platform has been designed, developed and tested (in the city of Brindisi, Southern Italy) as a distributed system that gathers sensor data and users’ comments from mobiles and sends them to a context broker application that forwards them to a NoSQL data storage instance for persistent storage. Subsequently, a complete Extract-Transform-Load (ETL) pipeline elaborates and manages collected measurements in a Data Warehouse (DWH) system: this step allows us to aggregate raw data depending on different aspects (e.g., sensing location and device type, measurement time, etc.) as well as to identify outliers. The outlier detection is a crucial elaboration phase in MCS solutions: the outliers represent measurements exhibiting significant biases in comparison with the average, so that they have to be identified and evaluated in order to determine (or, at least, infer from an algorithmic point of view) whether they are caused by wrong measurement procedures or malfunctioning sensing devices. Only freeware and open-source IT solutions have been used to promote knowledge sharing and reuse.
According to the aspects pointed out throughout this section, our proposal behaves as: 1) a sensing platform; 2) a system suggesting noise reduction and abatement policies to urban authorities; 3) a preliminary, low-cost, large-scale and sufficiently accurate monitoring tool. This will allow small and medium municipalities to perform noise monitoring without the need of expensive professional metering equipment. Therefore, the platform has a noise-prevention and pre-screening usage: it allows locating areas with potential noise pollution risks where more accurate measurement campaigns requiring professional metering equipment can be addressed. The pre-screening capability of our application represents another relevant advantage for Smart City context due to financial and spending reviews, which normally limit the start of professional noise monitoring campaigns.
municipalities and to estimate the impact of such measurements on current noise pollution levels.
Before describing our research activity in the rest of the paper, it is worth to point out that throughout this document, when we will use the term “noise”, we will refer only to the “acoustic noise”, since many other noises of different physical nature can be considered (e.g., electromagnetic noise, electrostatic noise, signal processing noise, etc.).
The paper is organized as in the following: Section 2 describes the actual scenario in terms of noise pollution concerns, health-related effects of noise exposures, typical urban noise sources and noise monitoring regulations. Mobile Crowd Sensing paradigm, along with examples of its applications in urban contexts and in noise monitoring, is presented in Section 3. The proposed platform design choices are detailed in Section 4, in terms of both data modelling and logical architecture. Section 5 presents the developed platform prototype (both the mobile application for data gathering and the Web application for data visualization). Several discussion aspects are coped with in Section 6. Section 7 draws conclusions and sketches out further developments.
2. Urban Noise
2.1. Urban Noise Pollution Concerns
Historically, noise pollution has not been considered similar to other urban pollutants (e.g., chemical or radiological) and still a low number of cities and administrations implements noise-control policies against potential health risks despite several technical reports by the European Commission ascertained citizens’ concerns about noise pollution issues.
According to the 2013 urban mobility report [7], indeed, the majority of Europeans believes that noise (72%) represents the fifth most significant problem within cities after air pollution (81%), road congestion (76%), travelling costs (74%) and accidents (73%). The noise pollution concern reaches even higher values in Italy (83%), Bulgaria (85%), Greece (87%) and Malta (92%). If examined from a socio-demographic point of view, the problem is less considered by students (66%) and much more by managers (76%).
The situation in Italy is well-described by a series of statistical analyses. The annual report by ISTAT§ [8] about the overall quality of the urban environment demonstrates the scarcity of noise assessment interventions nationwide: only 0.98% of the cities carried out noise monitoring campaigns in 2013, mainly required directly by citizens (91%). In 63.2% of the cases, at least one regulatory threshold was trespassed. These values are confirmed by the 10th national report on urban areas, by ISPRA** [9], which assesses that 52% of the noise emission controls performed in administrative centres exceeded thresholds, mainly due to high vehicular traffic volumes.
§ISTAT: Italian National Institute of Statistics
Large monitoring campaigns would allow Italian cities to apply the Acoustic Classification Plan (PCA, in Italian) for their geographical area, as requested by national laws [10]. This law established that each city should be partitioned into six different area classes (depending on the main socio-economic activities performed therein) where specific noise thresholds for day and night time-windows hold. However, in 2013, only 53% of the Italian administrative centers fulfilled such a requirement.
2.2. Health-related Effects of Noise Exposure
The necessity of proper noise monitoring activities is enforced also by the outcomes of several epidemiological research works that thoroughly analyse possible correlations between health effects and noise [11]. The outcomes of a primary exposure to a constant environmental noise source can be classified into acute effects, chronic effects and long-term risks [12] but it is important to point out that the exposure levels vary depending on multiple causes and on individual basis (i.e., some subjects are more noise-sensitive than others). Amongst the acute effects, we can enlist: decrease sleep quality and quantity, sleep fragmentation [13]; stress and distraction [14]; temporary change in hearing or noise-induced hearing loss (NIHL) [15].
Moreover, especially in urban scenarios, noise can cause the so-called noise annoyance [16], which stands for a series of socio-behavioural changes and overall discontent in citizens residing in noisy areas that may determine additional effects (e.g., increased drug consumption, increased number of accidents). Chronic effects entail hypertension, reduced learning and productivity, disruption of endocrine system and diabetes [17]. The long-term risks range from increased risk of injury to possible ischemic heart disease (IHD), increased risk of heart attack and permanent NIHL [18]. From a more general perspective, long-term risks mainly depend on the time duration of the exposure. Evidences from several research studies ( [19], [20]) demonstrate that people exposed to higher-volume sound sources or people exposed chronically due to specific life and working conditions (e.g., residents along busy roadways or residents located along a descending/ascending flight path to/from an airport) have the higher risks.
Noise emissions also affect more heavily specific categories of subjects or people exhibiting additional health risks: for instance, children living in noisy contexts [21] or attending schools located in dense urban areas show poor performances, stress, decreased learning rates, misbehaviour, concentration deficits, hyperactivity and scarce reading comprehension [22]. The chronically ill and the elderly are two other population categories especially vulnerable to noise-related diseases.
However, although the specific correlation between health effects and noise is even more documented than other environmental pollutants, the results in addressing noise
emissions and planning noise reduction interventions in urban contexts are still disappointing. Local authorities do not yet implement stable noise monitoring policies due to several factors, such as high equipment costs, scarcity of skilled personnel and lack of environmental awareness.
Typical monitoring stations are fixed installations that are located close to take-off and landing airport strips or in the proximity of traffic hotspots. Their costs are so relevant (i.e., buying costs: up to 25k€, rental costs: up to 3k€/month) that small and medium municipalities cannot afford similar expenses, thus depriving their citizenship of noise mapping campaigns. Consequently, this scenario determines an overall relevant request of novel monitoring solutions to be deployed also in small cities, since even small municipalities have the right to become smart or even smarter.
2.3. Noise Sources in Urban Contexts
Citizens in urban contexts are exposed to multiple sound sources (and the corresponding generated noise), exhibiting different characteristics in frequency and time. A widely-adopted categorization partitions noises into impulsive, transient and continuous ones. The impulsive noise is due to short-duration pulses having random amplitude and random duration (typically less than one second). Typical impulsive sources are hammering noises and gunfire. Transient noise consists of noise pulses having longer duration or relatively short pulses followed by decaying low frequency oscillations. Vehicle pass-by and aircraft flyover are the most common transient sources. Continuous noise, instead, exhibit stable conditions over a relatively long time period.
As for what concerns the noise sources, the most relevant one within urban contexts is represented by vehicular traffic. It is generated by multiple components: engine and transmission, rolling tires over the asphalt, aerodynamic, braking systems and vehicle-mounted devices, such as horns, sirens and whistles. Traffic noise levels depend on many vehicle-related factors, such as typology, speed and age [23]. Since it is strictly related to traffic noise, we can also consider the noise induced by roadwork and construction sites.
These noise sources, which can be very annoying for the population due to their potential long duration over time, range from interventions by utility companies (e.g., gas, electricity, water, cable services) to constructions (e.g., realization of new buildings, renovation or demolition of existing buildings, etc.).
Leisure time activities such as concerts and festivals represent another significant source of noise, especially when rock and pop music are played. Recent studies highlighted how years of exposure to loud music played at discotheques and during concerts may induce irreversible noise-induced hearing loss in both ears of at least 10dB at 3 kHz. Recent tests activities performed during music festivals highlighted how the individual sound exposure per evening varied between 90 and 115 dB(A), with an average exposure of 100 dB(A) and prolonged peaks of 110 dB(A) [24].
The noise generated by airplanes and airport installations is another major source of disturbance, especially when
airports are in close proximity to cities. Their contributions are: take-off and landing phases (generated by: aerodynamic, engine and propulsion systems) as well as airport activities (e.g., maintenance and emergency vehicles, baggage and passenger transportation systems, etc.) [25].
2.4. Current Noise Monitoring Regulations in
Italy and Europe
One of the widely adopted scale to quantify noise exposure is the A-weighting: it measures the Sound Pressure Level (SPL) in units of dB(A) [26] and allows measuring the dependence of perceived loudness w.r.t. frequency. Since sounds are typically fluctuating (i.e., they vary in time and have different durations) and since SPL is an instantaneous measurement instead, the Equivalent Sound Level LEQ(T) is preferred [26] as
the reference exposure descriptor in noise regulations and guidelines. It measures, in dB(A), the steady sound level conveying the same sound energy of the actual time-varying noise source in a given place during a given time window T
(where T typically ranges from 30s to 24h). In a more simplified explanation, LEQ(T) averages the SPL values
measured during T, thus smoothing spikes and outliers. Italian noise regulations [27] classify urban areas into six
acoustic classes depending on their main usage and building
typologies. As reported in Table 1, different threshold LEQ(T)
values are provided for each of those classes. In addition [10], [28], these thresholds are also expressed w.r.t.: time of the day (diurnal: 6a.m. – 10p.m.; nocturnal: 10p.m. – 6 a.m.); sensor position w.r.t. the noise source (insertion values: if near the source; emission values: if far from the source); road type (w.r.t. vehicle capacity and speed) and age (novel or already existing roads).
The Italian laws adopt a precautionary approach, so that the law thresholds that cannot be trespassed (i.e., limit values) are always below the noise emission values representing a lower risk or a potential risk for human health (i.e., quality
values and attention values, respectively). As a reference, it
could be useful to consider that in urban contexts typical noise values at 15m from the observer are: heavy truck (90dB(A)); congested city road (80dB(A)); light car traffic (60dB(A)).
As for the normative situation in the Continent, the European Commission promulgate in 2002 the Environmental Noise Directive (END) 2002/49/EC [29] about the assessment and management of environmental noise trying to define a common approach across all Member States for avoiding, preventing or at least reducing harmful effects of the exposure to environmental noise. The directive aims at harmonizing noise indicators and assessment methods by producing Strategic Noise Maps (SNMs), enabling comparison of noise levels and affected areas across Member States; heightening public awareness about noise as a significant environmental pollutant; adopting Strategic Action Plans (SAPs) to prevent and reduce noise where/when needed.
significant difference between the European Directive and the Italian law, from a normative point of view.
On the one hand, the Italian law determines and provides the thresholds to be abided by, the noise monitoring and controlling procedures, the noise abatement and reclamation techniques. On the other hand, the European directive aims at reducing the population noise exposure independently from the compliance with law thresholds and limits established by individual Member states. Therefore, the European Directive does not impose any strict control or obligation on noise exposure but it strongly relies on the individual Member States and their capabilities of informing the population about noise exposure levels and their potential health-related effects as well as of involving citizens during the definition of SAPs for noise exposure containment. The brief normative overview sketched so far highlights how significant can be the impact of smart-city-like solutions providing people the possibility of becoming better aware about noise-related issues within their cities. The MCS-based platform proposed in this research work exactly aims at this direction.
Table 1. LEQ(T) Threshold values in dB(A), according to
[10], [27]. The columns corresponding to law limits are grayed out.
Acoustic class Limit Quality Attention day night day night day night
C1. Protected 45 35 47 37 50 40
C2. Residential 50 40 52 42 55 45
C3. Mixed 55 45 57 47 60 50
C4. Intense Human
Activities 60 50 62 52 65 55
C5. Mainly
Industrial 65 55 67 57 70 60
C6. Exclusively
Industrial 65 55 70 70 70 70
3. Mobile Crowd-Sensing (MCS)
3.1. Mobile Device Pervasiveness
The most recent analyses for the mobile market confirm what have been outlined in the Introduction. According to the ICT Data and Statistics Division of the ITU (International Telecommunication Union) [31], by the end of 2015 mobile cellular subscriptions will reach a worldwide penetration rate of 97% (127% in Western Europe [32], 139% on average in EU countries and 158% in Italy [33]). In Q1 2015, mobile broadband subscriptions reached 535mn in Western Europe only. By the end of the same year, the mobile broadband technology (3G and 4G wireless communication standards
†† UMTS: Universal Mobile Telecommunications Service (wireless communication standard)
such as UMTS†† and LTE-A respectively) will represent the most dynamic market segment. They will achieve a penetration rate of 48% in EU countries (52% in Italy) and an overall network coverage of nearly 69% of the world population, which reaches the 89% if we consider the urban population only.
The prospected trend for year 2020 is even more evident. As envisioned in [32] by Ericsson company, the number of worldwide mobile subscriptions will reach 9.2bn (6.1bn for smartphones) w.r.t. the actual 7.1bn (2.6bn for smartphones). The increase for Western Europe will amounts 140mn, although the 80% of new mobile broadband subscriptions will come from Asia Pacific, the Middle East and Africa.
As for the mobile traffic growth forecasts, the worldwide monthly data traffic per smartphone amounts 1.05TB/month for Q1 2015 and it is expected to reach 4.9TB/month in 2020, with a Compound Annual Growth Rate (CAGR) of 30% [32]. From a socio-demographic point of view, it is estimated that 90% of world population over 6 years of age will have a mobile phone by the end of 2020 [32]. In Italy, the statistical analysis performed in 2013 by Nielsen [34] ascertained that 59% of users in the age 16-24 uses smartphones. This percentage increases up to 72% for individuals ageing 25-34 and 70% for subjects in the age 35-44.
The success of mobile broadband solutions is due to many reasons, such as high data rates, reliable coverage, high Quality of Service, extreme portability, data plans and monthly bills less expensive than fixed-broadband plans. Moreover, the statistical analyses briefly sketched so far, demonstrate that the highest smartphone penetration rates come from youngsters in urban scenarios, since they are early adopters of new technological solutions and they are typically inclined to use their smartphones to perform many heterogeneous activities (e.g., social networking, audio/video streaming, mobile banking and shopping, location-based services). Therefore, our application will benefit significantly from its diffusion across youngsters as primary data collectors.
3.2. MCS Paradigm and its Applications in
Urban Contexts
MCS became known more than one decade ago, when Burke et al. [35] proposed the notion of participatory sensing (PS) for the first time, and then it rapidly found application in urban scenarios. Such paradigm is realized once individuals are provided with personal electronic devices capable of collecting and analysing data in order to share local knowledge on a broader scale, so that each single user may become a data source point without the need of deploying ad hoc sensor nodes around him [35].
original definition of PS has been then absorbed under the new term of Mobile Crowd Sensing (MCS) [3] that currently describes a paradigm about collecting data directly from mobiles, which is much more advantageous than traditional WSNs and whose definition emphasizes the role of mobiles in leveraging their sensing and computational capabilities.
MCS actually exhibits multiple features. Depending on whether 3G/4G standards (e.g., EDGE‡‡, UMTS, LTE) or short-range standards (e.g., Wi-Fi, Bluetooth) are used, two different transmission paradigms are possible, named infrastructure-based transmission and opportunistic transmission respectively.
Similarly, user involvement is now much more considered than before, since MCS applications can be differentiated depending on whether people are allowed to choose when monitoring a specific event (participatory sensing) or simply delegate their mobiles to automatically send data without requiring their participation (opportunistic sensing).
Nevertheless, the most important step towards a new way of gathering sensor data from users is represented by the significant shift from the initial self-monitoring applications to the so-called community monitoring, where larger and larger number of participants are involved in sensing campaigns.
These aspects are particularly evident in urban monitoring scenarios, where four main application areas can be considered. The first area refers to mobility-related issues, such as traffic monitoring and parking availabilities [3] or road safety control [36]. The second category gathers all those applications devoted to the environmental monitoring, such as control of air pollutants ( [37], [38], [39]) and water pollutants [40], [41]. In the third sector, we can enlist the emergency management applications, such as flood alerting systems [42] or earthquake immediate sensing [43], [44]. The last group of applications comprises large-scale events monitoring and planning [45], such as music festivals or exhibitions, in order to follow specific groups of people or to profile their activities or interests.
3.3. MCS-based Applications for Noise and
Sound Monitoring
Despite a general interest about MCS-based initiatives for urban monitoring, the currently available solutions dealing with acoustics and noise are mainly focused on research and development and only a couple of them have been deployed so far on a large-scale, in order to achieve significant positive societal impacts within citizenship.
The majority of MCS applications for noise monitoring, indeed, are for personal use only: they reproduce main Sound Level Meter (SLM) functionalities and allow users to check how loud their surrounding environment is; however, they do not provide noise measurement aggregation on a geographical/temporal basis.
‡‡ EDGE: Enhanced Data GSM Environment (wireless communication standard)
This is the case of apps for controlling sound levels, such as Advanced Decibel Meter [46], Sound Meter Pro [47] or Decibel Meter Pro [48]. Very few research works address noise mapping, such as the “Ear-Phone” project [49] where Nokia phones were used to predict sound levels in a given environment, “NoiseSPY” [50], which exploited mobiles carried by bicycle couriers to collect data in Cambridge, or the “2Loud?” project [51] that uses iPhones to assess nocturnal noise within buildings near highways in Australia.
One of the main limitations in such activities is that users are only involved as data collectors but no specific platform functionalities are tailored to administrators for improving citizenship’s life quality. Therefore, if specific software solutions for noise mapping within urban contexts are needed, city managers still have to consider professional systems and platforms, such as the software application suite developed by SoftNoise [52], which provides a complete toolset of products for environmental noise calculations (“Predictor-LimA”) and mapping (“MapAtWork”) as well as for occupational noise mapping (“NoiseAtWork”). SoundPlan Acoustics [53] represents a similar solution: it is a noise modelling software for technicians and professionals, which offers advanced noise-mapping functionalities and animations for 3D sceneries.
The obvious drawback of such products is represented by their high cost and the necessity of skilled personnel capable of managing them properly. Consequently, city administrations typically cannot afford their adoption on a large scale.
4. The Proposed Platform
4.1. Overview
The proposed system addresses multiple categories of users: on the one hand, municipality managers will be provided with a Web application suggesting how to reduce noise levels and where regulatory thresholds are exceeded. On the other hand, mobile users will be allowed not only to collect measurements but also to learn about noise metering and acoustic principles directly on their devices.
In order to make this possible, national and international noise norms and regulations have been embedded. This MCS approach also allows us to overcome typical drawbacks of traditional noise monitoring techniques, which are more accurate but much more expensive. By embedding users’ comments into our data collection app, we also can integrate the approach of noise socio-acoustic surveys [54] to analyse the noise-induced annoyance.
4.2. Data Modelling Approach
must be cleansed, transformed and stored in order to make them available for final users. These processing steps can be tackled very effectively by revolving to a Data Warehouse (DWH) approach [55], according to which data are processed in an Extract-Transform-Load (ETL) pipeline. The suitability of such an approach is given by the inherent nature of sensor data, which are amenable to be managed in a multidimensional model.
A typical approach to this scenario is represented by the Dimensional Fact Model (DFM) [55], which is a conceptual model characterized by a high graphical expressivity, whose clarity allow representing concepts in a straightforward way, thus easing the comprehension of the multidimensional analyses that can be performed on data.
The core element in a DFM is the fact: it represents any concept relevant to decision-making processes and which evolves in time. In order to describe it qualitatively, the so-called fact attributes are needed. Similarly, the qualitatively description for a fact is given by the measures, which represent numerical properties or relevant calculations.
Being a multidimensional entity, a fact can be analysed along different coordinates, called dimensions, which enlist several dimensional attributes per each, organized into directed trees departing from the fact.
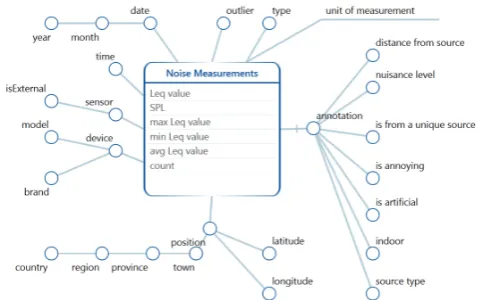
Dimensional attributes qualify the finite domain of their dimension along with its different degrees of granularity (e.g., the temporal dimension can vary from seconds to days, weeks, months; a product is described by its name, series, brand, etc.). Figure 1 allows us to introduce the DFM notation as well as our modelling choices.
We selected the noise measurement as the fact: it is depicted as a rounded box in Fig.1. Fact measures are inside the rounded box: they refer to both SPL and maximum/minimum/average LEQ(T). We have considered the
following dimensions: time (both timestamp and date/month/year); geographical position (latitude, longitude, town, province, region, country); sensor type (external or embedded); device type (model and brand); measurement type; outlier condition.
The dimension representing user’s annotations refers to the acoustic source and it is optional. More in details, we firstly manage the acoustic source uniqueness: the user will be asked to evaluate whether there is a predominant acoustic source around her/him or not. Then, a series of other user’s annotations are considered, which are all referred to the predominant acoustic source in case of multiple sources present in the same environment. These additional annotations are: source type (i.e., natural or artificial), location type (i.e., indoor or outdoor), annoyance (i.e., annoying or not annoying), nuisance (i.e., how much the acoustic source is deemed noisy by the user) and distance from the observer (i.e., very close, close, quite distant).
§§Android 4.2 APIs (Level ≥ 17):
http://developer.android.com/about/versions/android-4.2.html ***Orion: http://catalogue.fiware.org/enablers/publishsubscribe-context-broker-orion-context-broker
In Fig.1, the dimensional attributes for each dimension are represented as circles connected by lines to the fact, whilst the dimension is the root circle.
Figure 1. Dimensional Fact Model (DFM) for the fact:
“Noise Measurement”
4.3. Platform Logical Architecture: Design
Choices and Significant Components
Our platform consists of a mobile sensing app and of a cloud-based system tasked to data management. Some platform components have been developed by using FIWARE [52], a middleware supported by the Future Internet Public-Private-Partnership (FI-PPP) project of the European Union. FIWARE is becoming an important technological driver for the development of cost-effective and reusable IT solutions for the so-called “Future Internet”, a broad definition encompassing multiple and cross-disciplinary areas such as smart cities, logistics, Internet of Things, environmental sustainability and transportations.
The developed mobile app works on Android mobile devices (Android 4.2 APIs§§). The app mimics a professional SLM user interface and collects peak, average and current values of SPL and LEQ(T) on customizable temporal windows,
as required by EU and Italian noise regulations.
Measurements are stored locally (short-term history) and sent to the cloud-hosted system for data aggregation and filtering. The data brokering functionality is achieved by using Orion***, a Generic Enabler (GE) from FIWARE that provides publishing and subscribing operations on collected data. Data from Orion are persisted into a cloud-based instance of MongoDB, the No-SQL document-based DBMS, thanks to the FIWARE Cygnus††† connector.
Figure 2 depicts the proposed three-layer logical architecture. The first layer consists of non-persistent sensor data storage on mobiles (implemented via SQLite), of persistent storage on the cloud (via MongoDB) and of
relational DBs (via MySQL) for law regulations, device technical specifications and administrative divisions. The second layer has context-brokering capabilities for managing multiple sensors as well as data filtering (thanks to Pentaho CE‡‡‡, a freeware ETL application), integration and reporting functionalities. The third layer offers a Web app for accessing data reporting and integration results. Mobiles and a limited number of fixed monitoring stations represent data sources. We also developed a Web app for data visualization purposes, according to requirements elicited from users (i.e, city managers and citizens).
Figure 2. Platform Logical Architecture
5. The Developed Prototype
5.1. Mobile Application
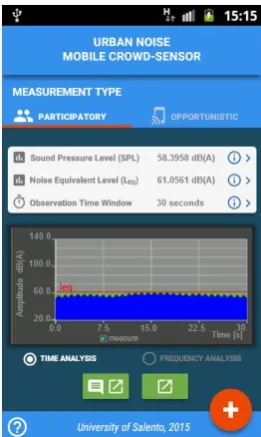
The user interface (UI) of the mobile app mimics a professional SLM, thus offering also to unskilled users a way for learning how to manage such kind of equipment as well as to understand which physical quantities (and corresponding units of measurement) are involved in noise monitoring campaigns.
Figure 3 depicts the app page for the participatory measurements. Both LEQ(T) and SPL values are reported and
plotted on a XY graph (users can switch between the time analysis and the frequency analysis mode by switching on the corresponding radio-button placed below the graph area), as well as the selected observation time period T.
Once the measurement ends, users can choose amongst: 1) starting a new measurement by discarding the current one (round orange button in the bottom right corner); 2) sending the measurement without any comments (right green button at the page bottom); 3) commenting and then sending the measurement (left green button at the page bottom).
‡‡‡Pentaho: http://community.pentaho.com/projects/data-integration/
Figure 4 represents the app page for comments and assessments, where users can describe the noise source, thanks to radio-buttons, in terms of: location (indoor or outdoor), nature (artificial or natural), annoyance, estimated distance from the observer, uniqueness, typology (by selecting amongst a set of predefined values such as truck engine, car traffic, construction site, crowd, machinery, etc.).
It is also possible to quantify the perceived nuisance level, by activating a slider (whose psychometric 10-value scale adheres to specifications proposed in [54]), and to add free-text comments. The round orange button in the bottom right corner allows users to take pictures of the area where noise measurements come from.
Users’ comments are particularly relevant in order to better characterize measurements taken according to the MCS paradigm: by providing personal comments and evaluations, the users contribute to enrich raw sensor data with contextual information, thus allowing more data management opportunities. For instance, measurements taken inside buildings can be separated from outdoor ones, thanks to the characterization of the measurement scenario provided by the users.
Similarly, measurements taken by different people at the same location, within the same time range can be compared w.r.t. the perceived nuisance level, thus analysing people differences in perceiving the same sound sources. In the same way, by providing photos of the surrounding sound sources, the users can contribute in creating a live, photographic map of the noisy spots within a city.
Figure 4. Mobile UI: page for user’s comments
5.2. Web Application
We also developed a Web application for city managers: it allows users to access a multi-layered, geo-referenced map
where data coming from the platform are visualized properly. More in details, the first layer is devoted to visualize measurements coming from a given area as points in a
choropleth map (i.e., a map where the colour ramp used to
represent the measurement location points is directly proportional to the measured LEQ(T) values). Another layer
(Fig.5) provides users with the interpolation of measurements achieved in the same area as an intensity heatmap (i.e., a map where adjacent measurements are interpolated according to a given algorithm in order to compute LEQ(T) values also for
those points where no measurements were actually performed). Intensity maps are extremely useful for understanding how noise levels are perceived throughout the urban environment without requiring to scatter all across the city mobile sensors. A third layer depicts public transport routes (see again Fig.5), in order to cross-correlate visually potential issues about noise pollution with transportation issues. A fourth layer allows the user to superimpose vehicular traffic data with noise mapping, in order to compare noise issues with traffic jams and busy transportation routes. The rendering of all the layers described so far has been achieved by forwarding measurement data, after the ETL process, towards a CartoDB [56] instance, an open-source, cloud-hosted, geospatial database for map storage and visualization.
Figure 5. Web app: intensity map of interpolated LEQ with suggested noise abatement measures (in the right vertical
In addition, the intensity map offers the possibility to dynamically explore how noise level abatement interventions may impact on actual interpolated LEQ(T) measurements: by
selecting from proper dropdown lists a given noise abatement measure, users can see how interpolated values could be reduced accordingly on that area.
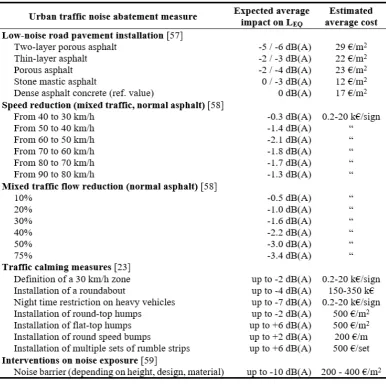
At this moment, we considered measures addressing traffic noise emissions (since they represent the most relevant cause of urban noise pollution). The system suggests, for each different abatement measures, the corresponding estimated impact on LEQ(T) and estimated average costs.
More specifically, city administrators are provided with several traffic noise abatement interventions (Fig. 6). As a first choice, the system proposes interventions on traffic speed/volumes and road pavement techniques. Low-noise
asphalts (e.g., thin-layer, double-layer, porous) are low-cost and significantly effective options for reducing traffic noise [57].
Moreover, they can be applied directly in specific noise hotspots without requiring any relevant environmental or architectonic modification. A second typology of intervention is related to speed limit enforcements, especially in the range 40-70km/h: traffic flow restriction measures are particularly useful, not only in terms of noise reduction but also for air quality and road safety [58].
Typically, such solutions have even lower costs for municipalities than low-noise asphalts but they may have collateral social costs due to travel time losses.
Figure 6. Urban traffic noise abatement measures (excerpt from the table provided to city managers): expected
impact on LEQ(T) and estimated costs (for measures aimed at reducing speed or vehicles flow the indirect installation
Other possible suggested interventions are represented by vertical (e.g., speed bumps/humps, rumble areas) and horizontal (e.g., roundabouts, traffic circles) traffic calming measures [23]: however, administrators must evaluate their application by examining each specific case since speed reduction artefacts may generate additional noise (e.g., once a vehicle reaches a road hump).
In addition, the suggestion system also proposes noise exposure-reduction measures, such as the noise barriers. Barriers are the most effective noise-reducing solution [59] but their installation cost is quite relevant (nearly 300 €/m2 instead of 20 €/m2 on average for low-noise asphalts) and their environmental and visual impact is significant, thus requiring proper preliminary analysis before deciding for their installation in a given location.
Further combinations of noise abatement interventions and more configuration parameters are also possible for such noise abatement measures: they are actually under investigation in order to be implemented in the next prototype of our platform. More specifically, we are implementing the possibility to apply different noise abatement policies to different roads and city areas, in order to offer estimations about selective and differentiated interventions.
Similarly, we are enlarging the range of available options, by considering also the evaluation criteria typically used for noise barrier selection. Users will be allowed to select amongst barriers [60], [61] differing for: typology (i.e., absorptive vs reflective), material (e.g., wood, plastic, steel, concrete, etc.), height and length, shape and barrier-tops (e.g., conventional, T-profile, Y-profile, arrow-Y-profile, curved, etc.). All these design aspects will be briefly described in terms of both installation costs and noise reduction effectiveness.
6. Discussion
6.1. Measurement Accuracy
The platform has been preliminary tested at our University campus. Subsequently, 20 students from our faculty performed several on-site tests in the central area of the city of Lecce (95k inhabitants, Southern Italy). They collected measurements in multiple 1-hour time windows by moving across high-traffic hotspots (e.g., roundabouts, 4-lane roads, typically congested streets, etc.). Three different types of Android-based smartphone have been used as metering devices. Some of the collected measurements have been also used to produce the noise maps described in Section 5.2 (Fig.5).
The need for testing different smartphones is related to the measurement accuracy issue, which assumes a considerable relevance in MCS contexts, since mobiles embed sensors exhibiting lower accuracies than professional metering equipment. The same issue also refers to their embedded microphones, which are normal
directional microphones, instead of the omnidirectional, shielded ones which are available in professional SLMs.
Therefore, we coped with this by evaluating the accuracy of the smartphone-embedded microphones instrumentally: we selected a 30-second steady, mid-level and broadband noise source and then we repeatedly compared measurements provided by different models of smartphones to data obtained with a professional, portable, Class-1 SLM (i.e., DeltaOhm HD9019). After several comparison sessions, we achieved an acceptable average accuracy: data from mobiles were affected on average by a ±5dB bias, which confirms the most recent research works [62] and thus demonstrating their amenability to be leveraged as preliminary monitoring stations.
In addition, we also implemented, as a step of the ETL process, a univariate algorithm for the outlier detection in order to remove measurements having an excessive sound level amplitude in a given temporal window.
We opted for a slightly modified version of the Tukey’s method [63], which is simple and quite effective with datasets following both a normal distribution and a not highly skewed lognormal distribution (which is the case of environmental sensors working in normal conditions, without relevant malfunctioning issues or particularly high concentrations of out-of-threshold noise sources).
Moreover, accuracy issues can be further reduced by implementing calibration procedures for smartphone built-in microphones. These methodologies allow to assess built-in a more rigorous way the reliability of a given device as an accurate sensor source: they allow us to quantify the discrepancy between a professional measurement and a MCS-based one, so that the latter one can be provided with an additive correction factor.
Multiple calibration approaches are available in scientific literature for acoustic monitoring equipment. The first and more reliable one requires the comparison between the measurement achieved with a given mobile device and the one achieved by a professional SLM (obviously, both referring to the same sound sample). The major drawback of such an approach is that with large numbers of users it is impossible to perform extensive calibration campaigns (also if we consider that periodical calibration are required).
Other calibration solutions are therefore needed. The second version of the developed prototype will offer: 1) self-calibration performed by each user against a known sound sample; 2) an extensive database of already calibrated smartphones, so that large portions of users can benefit from the already available correction factors.
6.2. Privacy Issues
The Web app visualizes collected measures on a geo-referenced map: the providing users, scattered on a large area, gather and send measurement by using their mobile devices.
smartphone users, nowadays, is the fear of being tracked or identified as a direct consequence of the usage policies and actions they perform on their devices.
In order to minimize such risk and to make aware users of the adopted privacy-preservation strategies, we propose the following interventions.
Firstly, any information or metadata capable of identifying the device owner is discarded and users are notified about this when they start the app for the first time. Mobile devices are only indexed thanks to their IMEI (International Mobile Equipment Identity) code, which do not allow going back to respective owners (therefore, mobiles are traceable but their owners are unknown to both platform managers and other application end users).
Secondly, users are required to login to our platform if they want to enrich participatory noise measurements with comments and photos: this solution allows us to achieve a better reliability in psychoacoustic measurements (since registered users are willing to contribute responsibly).
6.3. User Engagement and Effective
Channels for Data Gathering
MCS activities usually require specific solutions for engaging people in data gathering campaigns, so that they should not lose interest after their first experiences in MCS. Moreover, the involved participants should be informed about how to perform measurements correctly, in order to avoid data quality worsening. Thirdly, MCS apps must exhibit effective channels for data gathering, so that their usage mode seamlessly help users in gathering data in the right way.
All these aspects have to be considered when designing and implementing MCS solutions, as they represent the key elements for widening the lifespan of a given MCS activity. For such reasons, we are implementing a series of additional functions on our initial platform prototype. Amongst them, the most relevant one pertains to the released mobile app.
We are planning the release of a second version of the mobile app, not anymore as a standalone app but as a plugin for third-party mobile apps (which we can call “hosting apps”). This different type of distribution will allow us to widen the number of potential users, who will experience the capabilities offered by our platform as an add-on for hosting apps they typically already use.
In addition, we will not select the hosting apps simply by considering their level of diffusion amongst mobile users but by paying much more attention to the usage modalities these apps actually offers. Indeed, we will select hosting apps that require people to use their smartphone in a way that is also suitable for performing measurements in an effective and reliable way. Amongst the requirements needed for identifying hosting apps, we can enlist the following ones: 1) do not use smartphone built-in microphone for other audio registering purposes; 2) do not use other external sensors plugged into the audio jack connector; 3) do not require the usage of specific covers
that may obstruct the microphone and hinder the measurement quality; 4) require an intensive usage from smartphone owners, in order to be in idle for shorter time-periods.
7. Conclusions
The enormous diffusion of mobile devices is disclosing new opportunities in everyday life for people: the computational power offered by such devices, along with their rich built-in sensor equipment and the capability of being connected anywhere and anytime can be exploited in a plethora of novel and useful ways. One of the core areas where mobile devices can be effectively leveraged is represented by smart cities: urban environments aiming at becoming more environmentally sustainable and more IT-oriented than ever before in order to improve their citizenship’s life quality.
Several solutions have been proposed in scientific literature so far about Smart Cities, dealing with potentially any kind of sector: transportation, logistics, pollution monitoring, public services, wireless communications and so on. However, policy makers and city managers are constantly involved in searching novel ways to cope with typical urban issues, such as environmental quality monitoring and urban mobility. These two aspects, indeed, have a strong mutual relationships, since vehicular traffic is considered one of the prominent causes for urban air and noise pollution. Therefore, proper sensing approaches are needed, in order to collect relevant data. The majority of municipalities, unfortunately, cannot afford expensive and long professional metering campaigns, even in Western countries, due to several reasons, ranging from equipment considerable installation and maintenance costs to lack of skilled personnel for managing sensors and interpreting their data.
networks. Several tests assessing the accuracy achievable by smartphone built-in microphones in sound monitoring have been performed with satisfactory results. A series of privacy-preserving techniques have been also presented in the paper.
The system has been preliminary tested in city of Southern Italy hosting a large variety of noise sources within its framework (i.e., airport, commercial and touristic harbour, railway station, highway). Other additional improvements are actually under development: model scalability, introduction of multiple noise abatement measures, additional setup parameters (e.g., different noise barrier materials and shapes).
Acknowledgements.
This research activity has been developed and financed by the EU-funded project SP4UM (Grant agreement n. 632853, sub-grant agreement n. 021), within the “frontierCities” FIWARE accelerator, and by the EDOC@WORK3.0 project.
References
[1] A. Goldsmith, Wireless Communications, Cambridge University Press, 2005.
[2] K. Wong, Fundamentals of Wireless Communication Engineering Technologies, 1st ed., Wiley, 2012.
[3] R. Ganti, "Mobile Crowdsensing: Current State and Future Challenges," IEEE Commun. Mag., vol. 49, no. 11, pp. 32-39, 2011.
[4] S. Heggen, "Integrating Participatory Sensing and Informal Science Education," in 2012 ACM Conf. on Ubiquitous Computing (UbiComp'12), 2012.
[5] B. Guo, Z. Yu, X. Zhou and D. Zhang, "From Participatory Sensing to Mobile Crowd Sensing," in 2nd IEEE Int. Workshop on Social and Community Intelligence, 2014. [6] H. Fastl, "Psycho-Acoustics and Sound Quality," in
Communication Acoustics, J. Blauert, Ed., Berlin, Springer Berlin Heidelberg, 2005, pp. 139-162.
[7] TNS Opinion & Social, "Attitudes of Europeans towards urban mobility," 2013.
[8] ISTAT (Italian National Institute of Statistics), "Qualità dell'Ambiente Urbano [in Italian]," Rome, Italy, 2013. [9] ISPRA (Istituto Superiore per la Protezione e la Ricerca
Ambientale), "Qualità dell'Ambiente Urbano - X Rapporto, Ed. 2014 [in Italian]," Rome, Italy, 2014.
[10] LQ 26.10.1995/447 - Legge Quadro sull'Inquinamento Acustico (in Italian) - Framework Law on Noise Pollution, 1995.
[11] L. Goines and L. Hagler, "Noise Pollution: a Modern Plague," Vols. South Med J, vol.100, pp. 287-294, 2007. [12] W. Passchier-Vermeer and W. Passchier, "Noise Exposure
and Public Health," Vols. Environ. Health Perspect, vol. 108, pp. 123-131, 2000.
[13] A. Haralabidis, K. Dimakopolou, F. Vigna-Taglianti, M. Giampaolo, A. Borgini and M. Dudley, "Acute Effects of Night-Time Noise Exposure on Blood Pressure in
Populations Living Near Airports," Eur Heart J, vol. 29, pp. 658-664, 2008.
[14] W. Babisch, W. Swart and D. Houthuijs, "Exposure Modifiers of the Relationships of Transportation Noise with High Blood Pressure and Noise Annoyance," J Acoust Soc Am, vol. 132, no. 6, pp. 3788-3808, 2012.
[15] S. Levey, B. Fligor, C. Ginocchi and L. Kagimbi, "The Effects of Noise-Induced Hearing Loss on Children and Young Adults," Contemporary Issues in Communication Science and Disorders (CICSD), vol. 39, pp. 76-83, 2012. [16] WHO - World Health Organization, "Methodological
Guidance for Estimating the Burden of Disease from Environmental Noise," 2012.
[17] M. Soerensen, Z. Andersen, R. Nordsborg, T. Becker, A. Tioenneland and K. Overvad, "Long-Term Exposure to Road Traffic Noise and Incident Diabetes: a Cohort Study," Environ Health Perspect, vol. 121:217, 2013.
[18] R. Lewis, R. Gershon and R. Neitzel, "Estimation of Permanent Noise-Induced Hearing Loss in an Urban Setting," Environ Sci Technol, vol. 47, pp. 6393-6399, 2013.
[19] W. Babisch, "The Noise/Stress Concept, Risk Assessment and Research Needs," Noise & Health, vol. 4, no. 16, pp. 1-11, 2002.
[20] WHO, World Health Organization, Burden of Disease from Environmental Noise: Quantification of Healthy Life Years Lost in Europe, L. Fritschi, L. Brown, D. Kim, D. Schweila and S. Kephalopolous, Eds., Geneva, Switzerland, 2011. [21] C. Tiesler, M. Birk and E. Thierling, "Exposure to Road
Traffic Noise and Children's Behavioural Problems and Sleep Disturbances: Results from the GINIplus and LISAplus Studies," Environmental Research, vol. 123, pp. 1-8, 2013.
[22] S. Stansfeld, B. Berglund, C. Clark, I. Lopez-Barrio, P. Fischer and E. Ohrstrom, "Aircraft and Road Traffic Noise and Children's Cognition and Health: a Cross-National Study," Lancet, vol. 365, pp. 1942-1949, 2005.
[23] H. Bendtsen, J. Haberl, U. Sandberg, G. Watts and E. Pucher, "Traffic Management and Noise Reducing Pavements - Recommendations on Additional Noise Reducing Measures (SIlVIA, Sustainable Road Surfaces for Traffic Noise Control)," Roskilde, Denmark, 2005. [24] I. Bogoch, R. House and I. Kudla, "Perceptions about
Hearing Protection and Noise-Induced Hearing Loss of Attendees of Rock Concerts," Canadian Journal of Public Health, pp. 69-72, 2005.
[25] Y. Yang, C. Hinde and D. Gillingwater, "Airport Noise Simulation Using Neural Networks," in IEEE Int. Joint Conf. on Neural Networks (IJCNN 2008), Hong Kong, 2008.
[26] F. Alton Everest and K. Pohlmann, Master Handbook of Acoustics, 5th ed., T. Electronics, Ed., 2009.
[27] DPCM 14/11/1997 - Determinazione dei Valori Limite delle Sorgenti Sonore [in Italian], 1997.
[28] DPR 30.03.2004/142 (in Italian) - Presidential Decree on the noise pollution deriving from the vehicular traffic, 2004.
[29] European Union, Environmental Noise Directive
[30] Decreto Legislativo 19 agosto 2005, n°194 - Attuazione della Direttiva 2002/49/CE relativa alla Determinazione e alla Gestione del Rumore Ambientale [in Italian], 2005. [31] ICT Data and Statistics Division, "ICT Facts & Figures
2015," Geneva, Switzerland, 2015.
[32] Ericsson, "Ericsson Mobility Report," Stockholm, Sweden, 2015.
[33] We Are Social, "European Digital Landscape 2014 - Snapshot of Key Digital Data and Statistics," 2014. [34] Nielsen, "The Mobile Consumer - A Global Snapshot,"
2013.
[35] J. Burke, D. Estrin, M. Hansen, A. Parker, N. Ramanathan, S. Reddy and M. Srivastava, "Participatory Sensing," in Workshop on World-Sensor-Web (WSW'06) Mobile Device Centric Sensor Networks and Applications, 2006.
[36] E. Aubry, T. Silverston, A. Lahmadi and O. Festor, "CrowdOut: a Mobile Crowdsourcing Service for Road Safety in Digital Cities," in 2014 IEEE Int. Conf. on Pervasive Computing and Communication Workshops (PERCOM Workshops), Budapest (HU), 2014.
[37] S. Devarakonda, P. Sevusu, H. Liu, R. Liu, L. Iftode and B. Nath, "Real-Time Air Quality Monitoring Through Mobile Sensing in Metropolitan Areas," in 2nd ACM SIGKDD Int. Workshop on Urban Computing (UrbComp'13), Chicago (IL), USA, 2013.
[38] C. Leonardi, A. Cappellotto, M. Caraviello, B. Lepri and F. Antonelli, "SecondNose: an Air Quality Mobile Crowdsensing System," in 8th Nordic Conference on Human-Computer Interaction: Fun, Fast, Foundational (NordiCHI'14), 2014.
[39] B. Predic, Y. Zhixian, J. Eberle, D. Stojanovic and K. Aberer, "ExposureSense: Integrating Daily Activities with Air Quality Using Mobile Participatory Sensing," in IEEE Int. Conf. on Pervasive Computing and Communications Workshops (PERCOM2013), 2013.
[40] E. Minkman, P. Van Overloop and M. Van Der Sanden, "Citizen Science in Water Quality Monitoring: Mobile Crowd Sensing for Water Management in the Netherlands," in World Environmental and Water Resources Congress, 2015.
[41] T. Toivanen, S. Koponen, V. Kotovirta, M. Molinier and P. Chengyuan, "Water Quality Analysis Using an Inexpensive
Device and a Mobile Phone," Environmental System
Research, vol. Environmental Systems Research, no. 2:9, pp. 1-6, 2013.
[42] L. Degrossi, J. Albuquerque, M. Fava and E. Mendiondo, "Flood Citizen Observatory: a Crowdsourcing-based Approach for Flood Risk Management in Brazil," in 26th Int. Conf. on Software Engineering and Knowledge Engineering, Vancouver (Canada), 2014.
[43] University of California, Berkeley (CA), 2013. [Online]. Available: http://ishakeberkeley.appspot.com/.
[44] M. Faulkner, R. Clayton, T. Heaton, K. Chandy, M. Kohler, J. Bunn, R. Guy, A. Liu, M. Olson, M. Cheng and A. Krause, "Community Sense and Response Systems: Your Phone as Quake Detector," Communications of the ACM, vol. 57, no. 7, pp. 66-75, July 2014.
[45] A. Stopczynski, J. Larsen, S. Lehmann, L. Dynowski and M. Fuentes, "Participatory Bluetooth Sensing: a Method for Acquiring Spatio-Temporal Data About Participant Mobility and Interactions at Large Scale Events," in IEEE
Int. Conf. on Pervasive Computing and Communication Workshops (PERCOM 2013), 2013.
[46] A. Gates, "Advanced Decibel Meter," 2013. [47] Mobile Essentials, "Sound Meter PRO v2.92," 2015. [48] Performance Audio LLC, "Decibel Meter Pro v2.0.4,"
2012.
[49] R. Rana, C. Chou, S. Kanhere, N. Bulusu and W. Hu, "Ear-Phone: an End-to-End Participatory Urban Noise Mapping System," in 9th ACM/IEEE Int. Conf. on Information Processing in Sensor Networks (IPSN'10), 2010.
[50] E. Kanjo, "NoiseSPY: a Real-Time Mobile Phone Platform for Urban Noise Monitoring and Mapping," Mob Netw Appl, vol. 15, no. 4, pp. 562-574, 2010.
[51] S. Leao, K. Ong and A. Krezel, "2Loud?: Community Mapping of Exposure to Traffic Noise with Mobile Phones," Envion Monit Assess, vol. 186, pp. 6193-6206, 2014.
[52] SoftNoise GmbH, [Online]. Available: https://www.softnoise.com/index.html. [Accessed November 2015].
[53] SoundPlan GmbH, [Online]. Available: http://www.soundplan.eu/english/soundplan-acoustics/.
[Accessed November 2015].
[54] ISO - International Standards Organization, "Assessment of Noise Annoyance by Means of Social and Socio-Acoustics Surveys," 2003.
[55] M. Golfarelli and S. Rizzi, Data Warehouse Design: Modern Principles and Methodologies, 1st ed., McGraw-Hill, 2009.
[56] "CartoDB: the Easiest Way to Map and Analyze your Data," 2015. [Online]. Available: https://cartodb.com. [Accessed July 2015].
[57] W. Alberts, "Traffic Noise and Motorway Pavements," Geneva, 2015.
[58] L. Ellebjerg, "Noise Reduction in Urban Areas from Traffic and Driver Management - A Toolkit for City Authorities," 2008.
[59] H. Bendtsen, "Noise Barrier Design: Danish and Some European Examples," 2010.
[60] T. Ishizuka and T. Fujiwara, "Performance of Noise Barriers with Various Edge Shapes and Acoustical Conditions," Applied Acoustics, vol. 65, no. 2, pp. 125-141, 2004.
[61] H. Halim, R. Abdullah, A. Abang and J. Nor, "Effectiveness of Existing Noise Barriers: Comparison between Vegetation, Concrete Hollow Block and Panel
Concrete," Procedia Environmental Sciences -
Environmental Forensics, vol. 30, pp. 217-221, 2015. [62] C. Kardous and P. Shaw, "Evaluation of Smartphone Sound
Measurement Application," J. Acoust. Soc. Am., vol. 135, no. 4, pp. 186-192, April 2014.
![Table 1. LEQ(T) Threshold values in dB(A), according to [10], [27]. The columns corresponding to law limits are grayed out](https://thumb-us.123doks.com/thumbv2/123dok_us/8432409.1698279/5.595.47.290.391.534/table-threshold-values-according-columns-corresponding-limits-grayed.webp)