IJIE
Journal homepage: http://penerbit.uthm.edu.my/ojs/index.php/ijie
The International
Journal of
Integrated
Engineering
ISSN : 2229-838X e-ISSN : 2600-7916
A New Threshold Estimation Method of SEMG Wavelet
De-noising for Prolonged Fatigue Identification
Fauzani N.Jamaluddin
1*, Siti A.Ahmad
1,2, Samsul Bahari Mohd Nor
1,
Wan Zuha Wan Hasan
1, E F.Shair
1Control System and Signal Processing Group
Department of Electrical and Electronic Engineering, Faculty of Engineering, Universiti Putra Malaysia, 43400 UPM, Serdang, MALAYSIA
2Malaysian Research Institute on Ageing (MyAgeing)
Universiti Putra Malaysia, 43400 UPM, Serdang, MALAYSIA
*Corresponding Author
DOI: https://doi.org/10.30880/ijie.2019.11.03.006
Received 1 February 2019; Accepted 9 July 2019; Available online 3 September 2019
Abstract: In sports training, fatigue management is very important to avoid muscle injury and chronic fatigue syndrome. It occurs due to untreated normal fatigue (NF) which leads to a higher level of fatigue. This paper refers to the higher level of fatigue condition as prolonged fatigue (PF). Fatigue can be identified based on musculoskeletal, physiological, psychological, immunological and endocrinal system condition. Presently, musculoskeletal or muscle condition can be accessed quantitatively based on an invasive technique known as biopsies. It is accurate to evaluate muscle condition, but not suitable for frequent meas urements. The non-invasive method used through self-evaluation tools such as questionnaire is not a quantitative measurement and sometimes is difficult to quantify. There are other non-invasive methods to evaluate muscle condition known as surface electromyography (SEMG). Before this, SEMG were only widely used to classify between non -fatigue and NF conditions. However, NF prediction might not be accurate and suitable to be used on athletes since they are required to undergo high -intensive training every day and this involves PF condition. Recently, SEMG signals characteristics found out to be able to evaluate ionic concentration changes in the muscle due to intensive training. The signals characteristics are different compared to NF identification. Therefore, high quality SEMG plays an important role in PF detection to avoid misinterpretation. In this study, twenty healthy participants were recruited and performed five consecutive days of intensive training to induce PF symptoms. The training was based on Bruce Protocol treadmill test and SEMG data were collected fro m the participants’ rectus femoris muscle. This paper pre-processed SEMG signals using Stationary Wavelet Transform (SWT) ‘db’ 45 with different threshold estimation techniques of de-noising such as RigRSURE, HeurSURE, minimax, universal threshold and a new estimation of threshold method. The new method able to overcome the limitation of conventional methods which estimate threshold based on statistical principles. Most importantly, the new method can preserve significant SEMG information, remove corner frequency and mitigate baseline nois es. The performance of conventional and propose methods can then be evaluated based on PF classification performance. The de-noised signals extracted based on time, frequency and time-frequency features. Naïve Bayes classification results using time and frequency features indicate that the new estimation of threshold method with time and frequency features have the highest accuracy (98%), compared to RigRSURE (85%), HuerSURE (68%), Universal Threshold (74%) and minimax (76%) in PF identification.
Keywor ds: De-noising, Wavelet Transform, surface electromyography, muscle fatigue, overtraining, sports
1.
Introduction
Sports training is vital for athletes in maintaining and improving their performance. It commonly involves high resistive training and leads athletes to extreme fatigue. Fatigue is a natural physiological sign showing the limitation of human body. During resistive training, fatigue management is very important to avoid muscle injury and chronic fatigue syndrome (CFS). CFS is a major threat among athletes that could lead to an end of their career. This syndrome occurs due to untreated normal fatigue (NF) which progresses to a higher level. Fatigue condition commonly involves biochemical reactions and rest period allows it to return to its normal level [1]. However, inadequate recovery period will make it unable to return to its normal level which leads to maladaptive biochemical accumulations. Consequently, athletes may experience prolonged fatigue (PF) and they will take a longer period to recover [2]. The signs and symptoms experienced by the athletes may indicate the degrees of PF or overtraining. Proper fatigue management in the early stage of PF may help athletes to enhance performance. However, continuous sports training or competitive matches under this condition may expose athletes to injury, underperformance and d evelopment of more serious degree of PF, CFS[3].
Degrees of PF can be evaluated based on musculoskeletal, physiological, psychological, immunological and endocrinal system conditions. The evaluation is done through invas ive and non-invasive methods. Invasive methods such as blood test and muscle biopsies are accurate since it employ s quantitative measurements, but they are not preferred for frequent use. Non-invasive methods such as training log and 24-hours training distress questionnaire gave advantages since they can be evaluated daily compared to invasive method. Even so, experts are required to monitor closely the PF degree of the athlete and some of the questions in the questionnaire are difficult to be quantified especially in evaluating musculoskeletal condition.
There is a quantitative method known as surface electromyography (SEMG) that can evaluate musculoskeletal condition, specifically in muscles. The signal can distinguish between non-fatigue and normal fatigue (NF), and the signals discovered recently may indicate several biochemical reactions and concentrations under NF and PF conditions. Previous findings demonstrated that glycogen breakdown may decrease amplitude of SEMG and lead the frequency signals shift to upper band [4]. Large glycogen breakdown commonly followed by presence of lactate, and the existence of lactate at high concentrations may increase amplitude and frequency information of SEMG signals [5], [6]. The alteration of these biochemicals in human body may lead to PF symptoms such as muscle soreness and pain, performance reduction, lethargy and increasing blood pressure [7]–[9]. Investigation of SEMG under PF condition requires good quality of SEMG since the behavior of its amplitude and frequency may indicate the degree of fatigue experienced by the athlete.
SEMG signals are easily disturbed by interferences and noises widely known as corner frequency, 50/60 Hz powerline interference and baseline noises. These noises come from various sources. Baseline wander, motion artefacts, interference at electrode-skin interface, unstable, fluctuate unpredictably and firing rates commonly known as corner frequency noises [10]. There are no standard range for frequency noises but they have been discussed in many investigations reports [11]. Few corner frequency ranges that are recommended to be removed are 5 Hz [12], 10-20 Hz [13] and 20 Hz [10]. The different ranges of corner frequency are due to application, and movement during SEM G recording EMG [14]. More vigorous movements commonly involve wider range of corner frequency [11]. However, selecting corner frequency below 20Hz is not recommended as the SEMG energy is weak in this frequency range, and strong energy corresponds to firing rates or motor units and artefact effects [14].
removal technique, the ability of PF prediction will be evaluated based on the classification of its accuracy, sensitivity, precision and its cross validation error.
Nomenclature is included if necessary
an coefficient approximation
BMI Body Mass Index BP Blood Pressure bpm Beat per minute
CFS Chronic Fatigue Syndrome CVErr Cross validation error
dn coefficient details
DWT Discrete Wavelet Transform FFT Fast Fourier Transform Fmed Median Frequency Fmean Mean Frequency HPF High Pass Filter HR Heart Rate
HRmax Maximal Heart Rate
MAV Mean Absolute Value NF Normal Fatigue PF Prolonged Fatigue RMS Root Mean Square SEMG Surface electromyography
2.
Methodology
2.1
Data Collection
Twenty participants selected in this experiment were healthy people between 20 to 30 years old with body mass index (BMI) around 18 and 25. These criteria were set to ensure that fatigue would not be influenced by the participants’ age or disease, and to protect the participants from unexpected risks during the experiment. To ensure the participants are fit and safe for the experiment, they were screened through Par-Q and You self-evaluation questionnaire. Only participants who answered ‘NO’ to all criteria in the questionnaire were accepted to participate. At the same time, the participants must not suffer from any of chronic disease such as diabetic, high blood pressure, heart disease, joint or bone problems and are not taking any medication to control blood pressure or blood sugar. The participants must not be pregnant and do not have a history of lower extremities muscle injuries. The experiment procedure was approved by the Ethical Committee of Universiti Putra Malaysia. Participants were given written and verbal explanations to the experiment, including the potential risk and the discomfort that they might experience. They were also notified about their rights to quit participation anytime they desired. The participant signed informed written consent before the experiment began. As a precaution, the participants were protected by insurance during the whole experiment period.
The experiment was based on Bruce Protocol treadmill test. The inclination and speed of the treadmill were increas ed for every three minutes. The inclination started from 10° to 22° inclination, from 2.7km/h to 9.6km/h speed and the total duration of the protocol is 21 minutes. The experiment al design was divided into two phases : Phase I was meant for familiarization and Phase II was for intensive training. In Phase I, the participants familiarized themselves with the equipment and procedures. The participants were given three alternate days to avoid the emergence of PF. While, Phase II was designed to induce PF signs and was carried out in five consecutive days. Between Phase I and Phase II, the participants were requested to rest (for two days) and to refrain from exercising or doing any heavy physical activities.
2.1.1
SEMG
SEMG signals collected from a part of quadriceps group, which is rectus femoris muscle. This muscle was selected because it will activate about 44±20% of muscles when running at 10° inclination and the muscle activation will increase when the inclination increases [18]. Higher muscle activation during the activity generally may expose to a higher rate of injury. SEMG signals were collected by using Ag/Ag Cl Kendal Meditrace 200 electrodes, AD620 instrumentation amplifier and National Instrument DAQ 6008 with digital HPF cut-off at 10 Hz to remove baseline wander and 1000 Hz sampling rate as data acquisition. The electrodes placed on rectus femoris muscle based on SENIAM standard. During data collection, participants were asked to sit on a chair and do flex and extend knee movement for three times with 10 seconds interval at each position. The muscle will contract when knee is extended and rest when knee is flexed. SEM G signals were recorded at pre- and post-treadmill sessions.
2.1.2
Physiological Measurements
Other than SEMG, several other physiological measurements were collected to evaluate the presence of PF signs. This study only focused on the onset of mild PF signs such as performance decrement (endurance time), muscle soreness (muscle scale), lethargy, restlessness (HR>100 and BP>140/90 before running), and sleep and psychological disturbances. Three diagnostic tools were used to observe the signs; daily training log, 24-hours training distress questionnaire and short interview. Other than these measurements, HRmax also recorded to investigate running efforts of
the participants.
2.2 Signal Processing
In this paper, SWT chosen compared to Discrete Wavelet Transforms (DWT) since it has advantages on resolution sizes at every decomposition levels and ability to be time-invariant transform and a better drawback [19]. In SWT, reconstruction process involves averaging of bot h coefficient approximation (an) and coefficient details (dn) of
decomposition, where n is number of decomposition levels . This process will make the value of the highest an at the
lowest frequency band to be smaller and can be neglected. Compared to DWT where the reconstruction starts from the highest anand removing the lowest frequency band will requires complex algorithm.
Wavelet de-noising consists of three main process; decomposition, de-noising and reconstruction.
2.2.1
Decomposition
Decomposition process enables users to evaluate SEMG signals information at different level of frequency bands. At this stage, selection of frequency sampling of SEMG signals and number of decomposition levels are very important as corner frequency can be removed easily. This is based on a decomposition principle where at every level; the signals will be filtered by high pass filter (HPF), and produce an and low pass filter (LPF), will produce dn, with cut off at half
of the frequency of the signals respectively [20]. The an will be brought to the next level of decomposition and the filtering
process will be continued, and produce a series of an and dn.
As this paper aims to remove corner frequency at range of 20 Hz, the original of frequency sampling of SEM G signals have been up sampled to 1400Hz, and decomposed into six levels of decomposition with mother wave let Daubechies 45 (db45). Theoretically, the decomposition will produce the hig hest an , a6 with frequency range of 0-10.94
Hz and d6 , 10-21.88 Hz, which both coefficients are within the corner frequency range[11]. Figure 1 shows
decompositions of SEMG signals and it’s Fast Fourier Transform (FFT). It shows that SEMG signal has been decompose into frequency band as estimated based on the theory.
2.2.2
De-noising
In wavelet de-noising, threshold was only estimated at each of details coefficient, dn. In this paper, threshold
estimated by using conventional and a novel method.
Conventional method
There were four conventional threshold estimation methods used in this paper. The methods commonly used in wavelet de-noising, especially for SEMG application. The thresholds were estimated as follows:
RigRSURE
RigRSURE Threshold is estimated based on the adaptive thresholdmethod and in minimizing risk under the principle of Stein’s Unbiased Risk Estimate (SURE).
Universal Threshold
Universal Threshold method or also known as sqtwolog estimated based on equation:
HeurSURE
HeurSURE method is the combination of RigRSURE and Universal Threshold. Estimation based on SNR and noises. If SNR is very small and signals estimated very noise, Universal Th reshold estimation method will be used.
Minimax
Minimax method estimated based on statistical principle on minimax.
Fig.1- Decomposition of SEMG signal
Proposed method
This method is a combination of the research presented in [15] and [11]. The method is estimated to remove corner frequency and baseline noises.
Elimination of corner frequency noises
Based on the theoretical calculation on wavelet decomposition, d6 frequency range is from 10 to 21.88 Hz. After
de-noising process, the wavelet decomposition will be reconstructed and the reconstruction process in SWT will average the values of a6 (frequency range of 0-10.94 Hz) and d6 (10-21.88 Hz). Significantly, the range of both coefficients is 0-21.88
Hz which is the corner frequency noise range. To eliminate this noise, a threshold has been estimated at maxima l level to remove the entire details coefficient at d6. The average effects during reconstruction process will make value of
approximation details, a6 smaller and can be neglected.
Baseline noises removal
Based on Fig.1, it shows the significance of SEMG information are different at each level of decomposition. It indicates that threshold cannot be estimated with similar approach and equation for every decomposition level. In this paper, threshold at dq – d6 are estimated based on recommendation in [15] to remove baseline noise. According to [15], the
threshold estimated based on three cases; case I : eliminate all the details of coefficient for decomposition which not carry any significant of SEMG information, case II: threshold estimated at maximu m value of baseline noises for decomposition which SEMG signals are visible but carrying too much noises and case III: threshold estimated at 0.8 of value between maximu m baseline and average value of baseline for case that SEMG information are significant and strong.
2.2.3
Reconstruction
After de-noising process, the decomposition coefficients were reconstructed through inverse SWT. The de -noised signals then extracted for relevant features before classification process.
2.3 Features Extraction
Each contraction of de-noised SEMG segmented to 5000 samples/segment and extracted to relevant features for PF identification according to [3]. Features extracted were changes between pre and post running activity of mean absolute value (ΔMAV), root means square (ΔRMS), median frequency (ΔFmed) and mean frequency (ΔFmean).
0 2 4 6 8
x 104 -0.05
0
0.05 d6
0 100 200 300 400 500 600 700
0 1 2x 10
-3
FFT
0 2 4 6 8
x 104 -0.1
0
0.1 d5
0 100 200 300 400 500 600 700
0 0.5
1x 10 -3
FFT
0 2 4 6 8
x 104 -0.1
0
0.1 d4
0 100 200 300 400 500 600 700
0 0.5
1x 10 -3
FFT
0 2 4 6 8
x 104 -0.1
0
0.1 d3
0 100 200 300 400 500 600 700
0 0.5
1x 10 -3
FFT
0 2 4 6 8
x 104 -0.05
0
0.05 d2
0 100 200 300 400 500 600 700
0 2 4x 10
-4
FFT
0 2 4 6 8
x 104 -0.01
0
0.01 d1
0 100 200 300 400 500 600 700
0 0.5
1x 10 -4
2.4 Classification
PF predicted based on supervised machine learning known as Naïve Bayes classification with K-fold as cross validation method. The class of PF and NF pre-determined based on physiological condition during SEMG signals collected. The signals collected during no any PF signs grouped as NF, and the others were PF. Three combination features selection used; time features, frequency features and time and frequency features. Highest classification accuracy and lowest cross validation error (CVErr) in distinguish NF and PF will demonstrate the efficiency of threshold estimation method on SEMG wavelet de-noising.
3.
Results
3.1 Physiological Measurements
PF diagnostic tools revealed that average value of %HRmax during running was about 80% and demonstrates the
experiment was provide high intensity exercise and participant was performed maxima l running effort in this study. From twenty participants, only eight experienced PF signs. The first sign observed to appear was muscle soreness which began at day 3, and followed by unexplained lethargy and performance reduction at day 4 and 5 of experiment . The diagnostics tools also reported that there were no PF signs of restlessness (HR>100 and BP>140/90 before running), and sleep and psychological disturbance recorded. This situation also demonstrated that t he onset of PF and overtraining began with the presence of muscle soreness, lethargy and performance decrement. This situation demonstrates that the inappropriate treatment of PF sign such as muscle soreness will lead to existence of other PF signs. If this situation and sports training continued, more PF signs may exist and lead to higher degree of PF condition.
3.2 Signals Processing
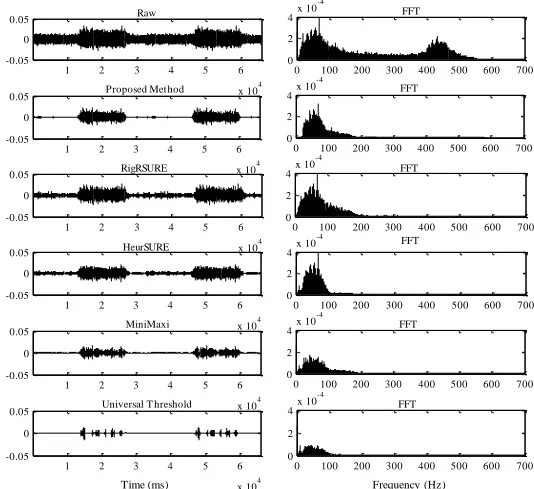
Figure 2 shows raw SEMG signals and de-noised SEMG signals from conventional and new threshold est imation methods and its FFT.
Fig.2- Raw and de-noised signals based on conventional and proposed threshold estimation method
The estimation methods presented in Fig.2 shows the different ability of each method in removing corner frequency. This is supported by result presented in Table 1 where only proposed method able to remove the corner frequency noise by demonstrating the lowest frequency detected was 20 Hz. This indicates that sampling frequency and levels of decomposition plays important roles in corner frequency removal. The reconstruction technique employs in SWT makes the highest approximation coeffient, a6 (frequency range of 0-10.94 Hz) value very small and can be neglected. This
effects makes the major of corner frequency noise mitigated. This situation actually assisted by digital HPF cut -off at 10Hz employed during data acquisition in removing baseline wandering noise. Filtering signals below 10Hz was very important during SEMG signals recording because without the filter, SEMG signals were very difficult to be detected. However, the proposed technique in removing corner frequency noise is still signific ant as there are no standard range
1 2 3 4 5 6
x 104 -0.05
0
0.05 Raw
1 2 3 4 5 6
x 104 -0.05
0
0.05 Proposed Method
1 2 3 4 5 6
x 104 -0.05
0
0.05 RigRSURE
1 2 3 4 5 6
x 104 -0.05
0
0.05 HeurSURE
0 100 200 300 400 500 600 700
0 2 4x 10
-4 FFT
1 2 3 4 5 6
x 104 -0.05
0
0.05 MiniMaxi
0 100 200 300 400 500 600 700
0 2 4
x 10-4 FFT
1 2 3 4 5 6
x 104 -0.05
0
0.05 Universal T hreshold
0 100 200 300 400 500 600 700
0 2 4
x 10-4 FFT
0 100 200 300 400 500 600 700
0 2 4x 10
-4
FFT
0 100 200 300 400 500 600 700
0 2 4x 10
-4
FFT
0 100 200 300 400 500 600 700
0 2 4x 10
-4
FFT
at lower or higher than 20 Hz, user can manipulating the number of frequency sampling and levels of decomposition as demonstrated in this paper.
Fig.2 also shows that both conventional and proposed threshold methods are able to remove certain baseline noises which presence at frequency range of 200-700Hz, but show different performance in removing the noise which interfere within strong energy of SEMG. RigRSURE and HeurSURE identified less ability to remove baseline noises since it does only able to mitigate the noise from 40mV to 13mV and 0.9mV respectively compared to other methods. However, both methods able to increase SNR to 14.5dB and 16.9dB respectively. Table 1 also show that Universal Threshold and Minimaxi method able to mitigate baseline values to 0.13mV and increase SNR to 22.35dB and 25.35 dB respectively. Unfortunately, Fig.2 indicate that the de-noising process may eliminate the significant information of SEMG signals because major signals elimination occurred at the strong energy of SEMG frequency range. Fig.2 also shows that the propose method able to preserve major signals in the strong energy of SEMG frequency range, 20-100 Hz. The propose method also demonstrates that the baseline noises mitigated to 0.1mV and SNR increased to 31.05 dB.
Table 1-Performance of conventional and proposed threshold estimation method in wavelet de-noising
3.3 Classification
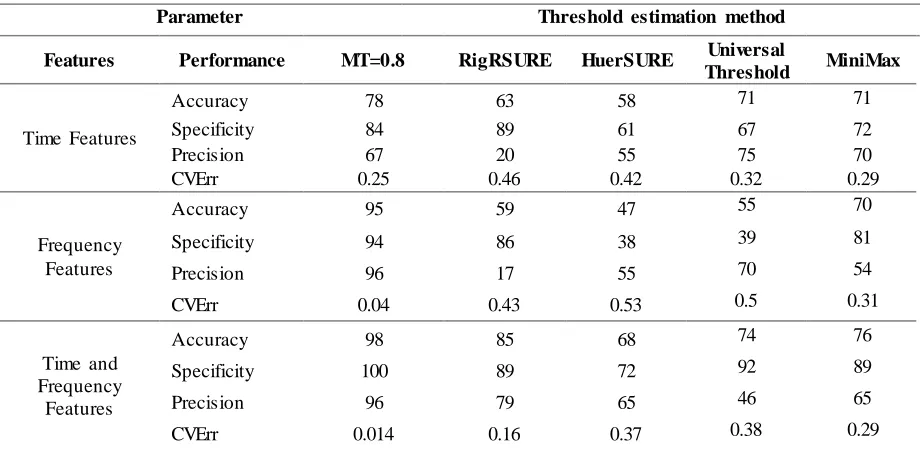
SEMG de-noising is important to enhance quality of the signals. Although the conventional and proposed methods able to mitigate baseline noises and increase SNR, the signals processing technique only significant when it able to be used for signals classification. Good quality of SEMG signal processing offers high classification accuracy and fatigue identification as proven by Bartolomeo, (2012), Phinyomark et al., (2009b); and Sarillee et al., (2015) [16], [21]. Table 2 shows the classification performance on PF identification based on the proposed and conventional Th estimation methods, by using Naïve Bayes classification approach.
Table 2-Classification of PF based on conventional and proposed threshold estimation method in wavelet de-noising
Parameter Threshold estimation method
Features Performance MT=0.8 RigRSURE HuerSURE Universal
Threshold MiniMax
Time Features
Accuracy 78 63 58 71 71 Specificity 84 89 61 67 72 Precision 67 20 55 75 70 CVErr 0.25 0.46 0.42 0.32 0.29
Frequency Features
Accuracy 95 59 47 55 70 Specificity 94 86 38 39 81 Precision 96 17 55 70 54 CVErr 0.04 0.43 0.53 0.5 0.31
Time and Frequency
Features
Accuracy 98 85 68 74 76 Specificity 100 89 72 92 89 Precision 96 79 65 46 65 CVErr 0.014 0.16 0.37 0.38 0.29 Table 2 indicates that the proposed method in estimating threshold value gave the highest classification accuracy, specificity and precision, with very minimal on CVErr, either by using time features, frequency features or combination of time and frequency features, compared to conventional methods. The result demonstrates the existence of thick baseline noises and the loss of important information of SEMG signals led to the inaccuracy in the classification and
Lowest Frequency (Hz) Baseline SNR (dB)
Raw 0 40mV 6.0814
Proposed Method 20±2.55 0.1mV 31.05
RigRSURE 0 13mV 14.5
HeurSURE 0 0.9mV 16.9
Universal Threshold Method 0 0.13mV 22.35
misinterpretation. The presence of thick baseline especially in frequency range of SEMG signals makes the extracted features contaminated with the unwanted energy. Furthermore, the variability and non -stationary of baseline noises in every SEMG signals makes conventional threshold estimation based on the statistical calculation not suitable for SEM G application. The conventional thresholdestimation methods were led too highthreshold value estimated in the frequency band which contains strong energy of surface EMG signals and low threshold value in frequency band which contain more noises. This situation was led the de-noised signals was remove the important information carried by SEMG, but preserve the noise. Thus, imprecision was occurred due to this situation and it makes the extracted data not accurate and led to confusion during PF prediction. Hence, it demonstrated that the conventional threshold estimation method was not suitable for SEMG application. In the conventional method, threshold was estimated based on statistical calculation; while, in SEMG, noises distribution varied. Therefore, estimating threshold value based on surface EMG needs itself offered higher quality, SNR, classification and fatigue identification.
4.
Conclusion
This study demonstrates that the proposed threshold estimation method is able to remove corner frequency and baseline noises. The study also demonstrates the significant of preserving SEMG information in noises removal, especially in predicting PF condition. Classification results demonstrate in this study show that PF and overtraining condition can be identified by SEMG. It also demonstrates that there are quantitative non -invasive method can be employed as new diagnostic tools in evaluate muscle condition during sports training.
Acknowledgement
The author will like to convey highest appreciation to PutraIPS grant, UPM for supporting this research work, and government of Malaysia for MyBrain15.
References
[1] P. Z. Pearce, “A practical approach to the overtraining syndrome.,” Curr. Sports Med. Rep., vol. 1, no. 3, pp. 179–83, Jun. 2002.
[2] K. M. Myrick and D. N. P. Aprn, “Syndrome in Athletes,” TJNP J. Nurse Pract., vol. 11, no. 10, pp. 1018– 1022, 2015.
[3] F. N. Jamaluddin, S. A. Ahmad, S. Bahari, M. Noor, W. Zuha, and W. Hassan, “Feature Selection for Bayes Classification of Prolonged Fatigue on Rectus Femoris Muscle,” in 2017 39th Annual International Conferen ce of the IEEE Engineering in Medicine and Biology Society (EMBC), 2017, pp. 2506–2509.
[4] H. Nie, L. Arendt-nielsen, A. Kawczynski, and P. Madeleine, “Gender effects on trapezius surface EMG during delayed onset muscle soreness due to eccentric shoulder exercise,” J. Electromyogr. Kinesiol., vol. 17, pp. 401– 409, 2007.
[5] J. F. Loss, D. O. Melo, M. La Torre, M. Pasini, L. Arau, L. N. De Oliveira, and L. Pinto, “Comparing the lactate and EMG thresholds of recreational cyclists during incremental pedaling exercise,” Can. J. Physiol. Pharmacol., vol. 86, no. 2008, pp. 272–278, 2008.
[6] J. S. Petrofsky, “Applied Physiology During Exercise on the Bicycle Ergometer,” Eur. J. Appl. Physiol., vol. 15, no. 41, pp. 1–15, 1979.
[7] J. P. Gavin, S. D. Myers, and M. E. T. Willems, “Neuromuscular responses to mild-muscle damaging eccentric exercise in a low glycogen state,” J. Electromyogr. Kinesiol., vol. 25, pp. 53–60, 2015.
[8] H. Ishii and Yy. N. N, “Effect of Lactate Accumulation during Exercise-induced Muscle Fatigue on the Sensorimotor Cortex,” J. Phys. Ther. Sci., vol. 24, pp. 1637–1642, 2013.
[9] J. B. Kreher and J. B. Schwartz, “Overtraining Syndrome: A Practical Guide.,” Sports Health, vol. 4, no. 2, pp. 128–38, Mar. 2012.
[10] J. V. Basmajian and C. J. De Luca, Muscles Alive. Their Functions Revealed by Electromyography, 5th ed. Williams & Wilkins, 1985.
[11] F. N. Jamaluddin, S. A. Ahmad, W. Z. Wan Hassan, and S. B. Mohd Noor, “Filtering Corner Frequency using Undecimated Wavelet Transform for Surface EMG,” JESTEC, pp. 1–6, 2016.
[12] A. R. Merletti and P. Torino, “Standards for Reporting EMG Data,” International Society of Electrophysiology and Kinesiology. pp. 1–4, 1999.
[13] H. J. Hermens, B. Freriks, C. Disselhorst-Klug, and G. Rau, “Development of recommendations for SEMG sensors and sensor placement procedures.,” J. Electromyogr. Kinesiol., vol. 10, no. 5, pp. 361–74, Oct. 2000. [14] C. J. De Luca, L. D. Gilmore, M. Kuznets ov, and S. H. Roy, “Filtering the surface EMG signal: Movement
artifact and baseline noise contamination.,” J. Biomech., vol. 43, no. 8, pp. 1573–9, May 2010.
[15] F. N. Jamaluddin, S. A. Ahmad, S. Bahari, W. Z. Wan Hassan, and A. Yaacob, “Estimation of Wavelet
Aided Eng. Technol., vol. 4, no. 6, pp. 517–534, 2012.
[17] A. Phinyomark, C. Limsakul, and P. Phukpattaranont, “EMG Denoising Estimation Based on Adaptive
Wavelet Thresholding for Multifunction Myoelectric Control,” in 2009 Conference on Innovative Technologies in Intelligent Systems and Industrial Applications (CITISIA 2009), 2009, no. July, pp. 171–176.
[18] W. B. Edwards, “Biomechanics and Physiology of Uphill and Downhill Running,” Sport. Medicion, no. August, pp. 1–16, 2016.
[19] S. Pellegrini and A. Rodriguez, “An introductory course in MATLAB,” no. September, 2008. [20] M. Misiti and J. Poggi, “Wavelet Toolbox TM User ’ s Guide R 2014 b,” 2014.