ISSN: 2322 - 4827, Volume 1, Issue 6, 2013: 572-577 Available online at http://www.ijabbr.com
Corresponding Author E-mail: [email protected] 572 | Page
Relationship between Morphological Traits in Rice Restorer Lines
at F
3Generation using Multivariate Analysis
Mostafa Eidi kohnaki*1, Ghaffar Kiani2 and Ghorbanali Nematzadeh2
1
M.Sc. Student in Plant Breeding, Sari Agricultural Sciences and Natural Resources University, Sari, Iran.
2 Department of Biotechnology and Plant Breeding, Sari Agricultural Sciences and Natural ResourcesUniversity, Sari, Iran.
ABSTRACT
In order to evaluate the relationship between morphological characters in rice lines two populations at F3 generation were grown in research field of Agricultural Sciences and Natural Resource University, Sari, Iran, during 2012. Statistical analysis on important agronomic traits showed that maximum standard deviation belonged to total grain number followed by filled grains per panicle and grain yield. Result of correlation analysis revealed positive and significant relation of grain yield per plant with panicle length, panicle per plant, total grain number and filled grains per panicle. Path coefficient analysis indicated that filled grains per panicle had highest direct effect on yield followed by panicle length, plant height, and panicle per plant. Panicle per plant had highest indirect effect on grain yield. This study revealed that selection based on filled grains per panicle, panicle length and panicle per plant will be highly effective for yield improvement in rice breeding programs.
Key Words: Rice, Correlation, Path analysis, Yield, Yield component, F3 generation.
INTRODUCTION
573 | Page
Correlation and path coefficient analysis have been successfully used for plant selection for increasing yields of different crops and provide information about the cause and effect relationship between direct pairs of variables which would in turn help in bringing improvement in seed yield (Tandekar et al, 2008).Bhadru et al, (2011) with study on 93 rice genotypes involving hybrids and their parental lines reported that plant height, filled grains per panicle, days to 50 percent flowering and panicle weight had a significant positive association with yield and also had a positive direct effect on yield both at the phenotypic and genotypic levels. Satish Chandra et al., (2009) with study of path coefficient analysis noted that the numberof grains per panicle exerted the highest direct effect on grain yield followed by days to 50 percent flowering, 1000-grain weight and number of productive tillers per plant. In another investigation Seyoum et al, (2012) studied fourteen rice genotypes and demonstrated that grain per panicle had maximum positive direct effect and highly significant genotypic correlation coefficient with grain yield. selection of parents based on yield alone is often misleading (Abdus et al, 2009; Selvaraj et al, 2011) because grain yield is a complex polygenic character controlled by many genes interacting with the environment and is the product of many factors called yield components.The objective of the present study was to study the relationship between traits, and to determine the direct and indirect effects of effective traits on grain yield.
MATHERIAL AND METHODES
Plant materials used in the present study consisted of two F3 populations (IR60819/ Pajohesh and IR58110 /Pajohesh) that were grown in field of Sari Agricultural Sciences, and Natural Resource University, Sari, Iran, during 2012.The observations were recorded on three randomly selected plants for nine traits including yield and its component traits.Up to 53 superior genotypes were selected based on morphological performance in studied F3 populations and important agronomic traits like, plant height (cm), panicles per plant, panicle length (cm), 1000-grain weight (g),grain length (mm), grain width (mm), filled grains per panicle and grain yield/plant (g) were recorded on those genotypes based on the standard evaluation system (SES) of rice (IRRI, 2002).The statistical analysis, including estimation of descriptive statistics and coefficient of correlation performed using path analysis and SPSS version 16 statistical package.
RESULT AND DISCUSSION
574 | Page
In the present investigation we intend to reveals the possibility of effective selection for improvement of yield and its important components in subsequent segregating populations. Knowledge on interrelationship between yield and its component may facilitate breeder to decide upon the intensity and direction of selection pressure to be given on related traits for the simultaneous improvement of yield contributing traits (Rajamadhan, 2011). Effective improvement in yield may be brought about through selection of yield component characters. Hence, association analysis was undertaken to determine the direction of selection and number of characteristics to be considered in improving grain yield.
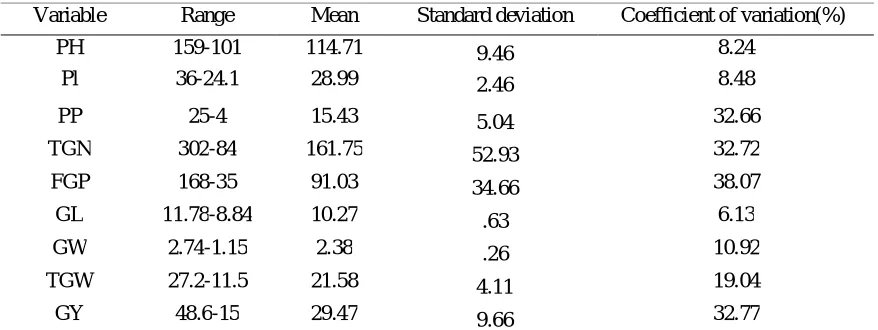
Table 1. Descriptive statistics in fifty-three F3 rice lines for some agronomic traits.
Coefficient of variation(%) Standard deviation Mean Range Variable 8.24 9.46 114.71 159-101 PH 8.48 2.46 28.99 36-24.1 Pl 32.66 5.04 15.43 25-4 PP 32.72 52.93 161.75 302-84 TGN 38.07 34.66 91.03 168-35 FGP 6.13 .63 10.27 11.78-8.84 GL 10.92 .26 2.38 2.74-1.15 GW 19.04 4.11 21.58 27.2-11.5 TGW 32.77 9.66 29.47 48.6-15 GY
PH= plant height (cm), PL= panicle length (cm), PP= panicles per plant, TGN= Total grain number, FGP= filled grains per panicle, GL= grain length, GW= grain width, TGW= 1000-grains weight (g), GY= Grain yield/plant (g).
575 | Page
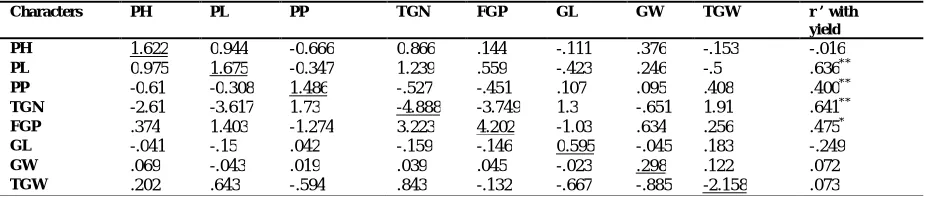
The correlation coefficient alone is inadequate to interpret the cause and effect relationships among the traits and ultimately with yield (Bhadru, 2011). Path coefficient analysis (Table 3) revealed that filled grains per panicle (4.202), has highest direct effect on yield followed by panicle length (1.675), plant height (1.622), and panicle per plant (1.486).This characters have positive direct effect and significant positive association with grain yield indicating that these traits were more contribute towards grain yield in these rice lines,therefore selection for these characters is likely to bring about an overall improvement in single plant yield directly. Panicle per plant had highest indirect effect on grain yield that is also noted in another report (Bagheri et al, 2011; Madhavilatha et al, 2005). It seems that increasing in panicle per plant,led to increasing leaf area or photosynthesis source which will ultimately increase yield. The direct effect of total grain number was negative (-4.888) but it indicated high indirect effect via 1000-grains weight (1.91). Similarly the1000-grains weight has negative direct effect on grain yield (-2.158) but it showed high indirect positive effect on it through the panicle length (0.643).The combined results of both correlation and path analysis revealed that selection based on filled grains per panicle, panicle length and panicle per plant will be highly effective for yield improvement in rice breeding programs.
Table 3. Genotypic direct (diagonal) and indirect effects of different quantitative traits in fifty-three F3 rice lines.
ACKNOWLEDGMENTS
This project was financiallysupported by Genetics & Agricultural Biotechnology Institute of Tabarestan (GABIT).The authors thank to A. Afkhami for technical assistance.
Table 2. Correlation coefficients among grain yield and its components in fifty-three F3 rice lines
Characters PH PL PP TGN FGP GL GW TGW GY
PH 1
PL .582** 1
PP -.410** -.207 1
TGN .534** .740** -.354* 1
FGP .089 .334 -.303 .767** 1
GL -.068 -.252 .072 -.266 -.245 1
GW .232 .147 .064 .133 .151 -.075 1
TGW -.094 -.298 .275* -.391* .061 .309* .410** 1
GY -.016 .636** .400** .641** .475* -.249 .072 .073 1
** and *, significant at 1 and 5% level of probability, respectively.PH= plant height (cm), PL= panicle length (cm), PP= panicles per plant, TGN= Total grain number, FGP= filled grains per panicle, GL= grain length, GW= grain width, TGW= 1000-grains weight (g), GY= Grain yield/plant (g).
Characters PH PL PP TGN FGP GL GW TGW r ’ with
yield
PH 1.622 0.944 -0.666 0.866 .144 -.111 .376 -.153 -.016
PL 0.975 1.675 -0.347 1.239 .559 -.423 .246 -.5 .636**
PP -0.61 -0.308 1.486 -.527 -.451 .107 .095 .408 .400**
TGN -2.61 -3.617 1.73 -4.888 -3.749 1.3 -.651 1.91 .641**
FGP .374 1.403 -1.274 3.223 4.202 -1.03 .634 .256 .475*
GL -.041 -.15 .042 -.159 -.146 0.595 -.045 .183 -.249
GW .069 -.043 .019 .039 .045 -.023 .298 .122 .072
TGW .202 .643 -.594 .843 -.132 -.667 -.885 -2.158 .073
576 | Page
REFERENCES
Ahmadizadeh M, Nori A, Shahbazi H, Aharizad S (2011). Correlated response of morpho physiological traits of grain yield in durum wheat under normal irrigation and drought stress conditions in greenhouse. African Journal of Biotechnology10(85): 19771-19779.
Bagheri N, Babaeian-Jelodar N, Pasha A. (2011). Path coefficient analysis for yield and yield components in diverse rice (Oryza sativa L.) genotypes. Bih Biol 5:32-35.
Basavaraja T, Gangaprasad S., Dhusyantha Kumar B.M, Hittlamani SH (2011). Correlation and path analysis of yield and yield attributes in local rice cultivars (Oryza sativa
L.),Electronic Journal of Plant Breeding, 2(4):523 -526.
Bhadru D, Lokanadha Reddy D, Ramesha M.S (2011). Correlation and path coefficient analysis of yield and yield contributing traits in rice hybrids and their parental lines. Electronic Journal of Plant Breeding, 2(1): 112-116.
FAO (2009). www.fao.org
Gravois K.A, McNew R.W (1993). Genetic relationships among and selection for rice yield and yield components. Crop Science 33:249-252.
Gulzar S Sanghera, Subhash C KASHYAP (2012). Genetic Parameters and Selection Indices in F3 Progenies of Hill Rice Genotypes. Not Sci Biol, 2012, 4(4):110-114.
IRRI (2002). Standard evaluation system for rice (SES). International Rice Research Institute, 54 p.
Kiani Gh, Nematzadeh Gh.A (2012). Correlation and path coefficient studies in F2 populations of rice. Notulae Scientia Biologica, 4(2):124-127.
Tanekar K, Rastogi N.K, Tirkey P, Sahu L (2008). Correlation and path analysis of yeild and its components in rice germplasm accession, plant archives vol. 8. No. 2, 2008 pp.887-889 Madhavilatha L, Reddi Sekhar M, Suneetha Y, Srinivas T (2005). Genetic variability, correlation and path analysis for yield and quality traits in rice (Oryza sativa L.). Res Crops 6(3):527-534.
Mehetre S.S, Mahajan C.R, Patil P.A, Lad S.K, Dhumal P.M. (1994). Variability, heritability, correlation, path analysis and genetic divergence studies in upland rice. Int Rice Res Notes 19:8-9.
Satish Chandra.B., Dayakar Reddy.Tansari. N.A., Sudheer Kumar. S. correlation and path coefficient analysis for yield and yield components in rice (Oryza sativa L.) Agric. Sci. Digest, 29 (1) : 45-47, 2009
577 | Page
coefficient in induced mutants of aromatic non-basmati rice. Tropical agriculture research and extension.vol 11, 60-64.