© Penerbit UTHM
DOI: https://doi.org/10.30880/ijie.2018.10.05.016
*Corresponding author: [email protected]
Preliminary
Reliability
Study
of
Computerized
Neurobehavioural Test Method
Norlida Shaari
1, Azian Hariri
2,*, Nuur Azreen Paiman
2, Nurul Fitriah Nasir
2,
Normayati Nordin
2, Ainun Rahmahwati Ainuddin
3, Norasikin Mat Isa
21
Jabatan Pendidikan Politeknik & Kolej Komuniti, Aras 5, Galeria PjH, Jalan P4w, Persiaran Perdana, Presint 4, 62100 W.P. Putrajaya, MALAYSIA.
2
Faculty of Mechanical and Manufacturing Engineering, Universiti Tun Hussein Onn Malaysia, Parit Raja, Batu Pahat, Johor, MALAYSIA.
3
Occupational Safety, Health and Environment Division, Universiti Tun Hussein Onn Malaysia, Parit Raja, Batu Pahat, Johor, MALAYSIA.
Received 1 August 2018; Accepted 26 August 2018; Available online 30 October 2018
1. Introduction
Neurobehavioural problems can be defined as behavioural impairments related to the relationship between the action of human nervous system and behaviour which associated with brain diseases such as multiple sclerosis (MS), dementia, stroke and brain cancers either temporary or permanent brain impairments [1, 2]. These impairments sometimes can have negatively effect on individual’s ability to hold a job and maintain relationships [3]. There are many causes contribute to neurobehavioural problems including age, gender, level of study, health status, exposure to neurotoxic chemical substances, unhealthy lifestyle, and also influence from environment [2].
Nearly everyone works with or around chemicals and chemical products every day. One study has identified that over 750 chemicals which have direct or indirect effects on the nervous system [4]. In this system comes all phenomena of consciousness, mind, memory, language, sensation, and movement [5]. In an industrial engineering area, at least one third of chemical substances show neurotoxic properties and the workplace threshold limit values for 189 substances out of 693 (27%) have been set based on neurotoxicity data by the American Conference of Governmental Industrial Hygienists (ACGIH), and more than 200 chemicals are recognized as neurotoxicants for humans and the figures keeps growing [6]. Many studies have discovered that, there are
Abstract: The recently developed Neurobehavioural Risk Assessment Evaluation System 1.0 (NeuRAES 1.0) tool aims to assess the neurobehavioural performance in Malaysia. Prior to utilize the advantage of the developed NeuRAES 1.0 tool effectively, it is vital to evaluate its reliability. The study aimed to conduct test and retest of NeuRAES 1.0 and assess the reliability of the NeuRAES 1.0 tool among university students in Universiti Tun Hussein Onn Malaysia (UTHM). With that regard, the reliability of the tool was examined among 40 healthy university students using a test–retest of four computerized tests that are, Benton Visual Retention, Symbol Memory, Trail Making, and Pursuit Aiming, with the test and retest held two weeks apart. The reliability was analyzed for all test measures using the Pearson product-moment correlation coefficient (r) and the intraclass correlation coefficient (ICC). A two-way mixed effect model was applied in this study to determine the ICCs and their 95% confidence intervals. The finding of all parameter measures in all four tests for standard scores were significantly similar, and the improvements of scores were also detected at retest for raw scores. The test–retest scores were found to have the ICC values ranging from low to adequate (0.269 to 0.655). The low ICCs were detected on Memory Symbol Test (r = 0.264, ICC = 0.269), Trail Making Test (Section A: r = 0.377, ICC = 0.383; Section B: r = 0.445, ICC = 0.452), Benton Visual Retention Test (r = 0.511, ICC = 0.517), and Pursuit Aiming Test (Test B: r = 0.567, ICC = 0.574). An adequate ICC was found on Pursuit Aiming Test (Test A: r = 0.649, ICC = 0.655). This demonstrating that the instrument still have not achieved a condition where, a measurement process is capable to produce stable and consistent scores when repeated over time except for Pursuit Aiming Test (Test A). In conclusion, the findings extend our understanding of score changes due to repeat testing. A further review on the test measures with low ICC needs to be considered. Therefore, further studies with larger samples and varied group of populations would be valuable.
enormous deficits in tests of psychomotor function and more neuropsychiatric symptoms among exposed individuals such as headache, dementia, fatigue, insomnia, irritability, memory impairment, affective changes in personality, lack of concentration, depressed mood, sensory disturbances and motor problems have been reported [2, 7, 8].
The World Health Organization (WHO) Neurobehavioural Core Test Battery (NCTB) was designed to address neurobehavioural effects in the occupational and environmental exposure [7]. The exposed individuals have to perform neurobehavioural assessment test to evaluate their functional abilities. The test comprises of tasks that measure performance of any disorder of the nervous system, such as ability to learn, reaction time, memory, and coordination [9].
Previously, the conventional paper-and-pencil NCTB method is popularly used to detect neurobehavioural problems in human populations since it was introduced in 1983 [7]. In the Digital Age presently, the computerized NCTB has been widely used particularly in foreign countries and the reliability has been evaluated by their researchers. However, in Malaysia the use of computerized tests have not widely recognized, in fact, the reliability is still in doubt. Some test developers shared their observation that the repetitive use of computerized neurobehavioural tests are able to have sufficient stability and reliability [8]. The reliability of neurobehavioural tests may be affected by some factors such as racial, cultural backgrounds of a country or others [9]. When characteristics of cultural background are disregarded, test score results may cause to confusion between culturally determined lack of knowledge or underdeveloped skills with brain dysfunction. This statement is highly supported by some authors in their studies on the effects of cultural background on neurobehavioural tests whereby, they have concluded that some cognitive and motor processes were affected by racial or cultural background [10]. These findings were also supported in the studies on Koreans [11]. For example, Anger reported that daily use of chopsticks may affect psychomotor performance while Chung reported that cultural background has a large influence on neurobehavioural test performance, even within Asian populations [9, 12].
Since the use of computerized neurobehavioural tests has not extensively employed in Malaysia, a researcher from University Tun Hussein Onn Malaysia (UTHM) has taken an initiative to develop an instrument of computerized neurobehavioural assessment test known as Neurobehavioural Risk Assessment Evaluation System 1.0 (NeuRAES 1.0) to assess the neurobehavioural performance in Malaysia. NeuRAES 1.0 was develop based on WHO-NCTB and consists of four tests namely Benton Visual Retention Test, Memory Symbol Test, Trail Making Test, and Pursuit Aiming Test which has the similar structure and content as the other computerized tests except for the Memory Symbol Test has been slightly modified (formerly known as digit symbol). All these tests are used to measure the
neurobehavioural performance which involve different functional domains such as visual perception and memory, perceptual-motor speed, visual attention and task switching, as well as motor steadiness [7]. Therefore, prior to utilize the advantage of the developed NeuRAES 1.0 effectively, its reliability needs to be evaluated. Although neurobehaviour problem closely related to the occupational and environmental exposure, this preliminary study was conducted to gather preliminary data on healthy normal people as benchmark dataset for future references as common practice in safety study [13].
2. Materials and method
2.1 Pilot test and study population
Fig.1 shows the flowchart of the process to assess the reliability of NeuRAES 1.0.
Fig.1 Flowchart of the process to assess the reliability of NeuRAES 1.0
Prior to distribute the questionnaire and administer NeuRAES 1.0 tests to the real samples, a pilot test had been done where, involved about five participants. It was
2 weeks interval
Yes
No
End
Pilot test (Students, n = 5)
Result
Discussion and conclusion Result
Analysis
Questionnaire (Students, n = 40) Literature review
NeuRAES 1.0 tests (Students, n = 40)
hard to analyze the status of healthy state of the participants. Thus, a little modification was done in order to make the interpretation of healthy status of participants become much easier.
Therefore, the participants were divided into two group where, participants with history of serious medical problem/are having a serious medical treatment at the moment/have been exposed to neurotoxic chemicals are categorized as unhealthy group. While the other groups was categorized as healthy group without any health problem/in healthy condition except a minor health problem such as cold, cough and fever. Unhealthy group was not allowed to administer the NeuRAES 1.0 tests because they could affect the performance score of test-retest of computerized neurobehavioural tests. Only healthy group was allowed to administer the NeuRAES 1.0 tests.
During pilot test, the same participants that answered the questionnaire also performed the NeuRAES 1.0 tests. A problem had arisen when examiner was recording the participants’ achieved time (in seconds) into a testing log sheet especially for a Trail Making Test. It was found that nearly all the participants were too quick clicking the next instruction to move on the next test. This circumstances made the examiner frequently missed out to write down the achieved time by the participants which displayed on the laptop screen soon after the test was completed. Some participants were able to recall the time achieved but some were not. Nonetheless, for those who unable to recall their achieved time were required to redo the Trail Making Test. In the actual situation, the examiner had to remind the participants to note of their own achieved time every time after completing both sections A and B during performing the Trail Making Test.
During the actual test conducted, the examiner have also taken some measures in order to minimize the error caused by the participant, which tend to contribute to the reliability of computerized tests. To minimize the momentary fluctuations in anxiety, motivation, attention, and fatigue as potential causes of measurement errors, the participants were required to get normal sleep and to avoid drug, alcohol and caffeine intake, heavy smoking and heavy exercise on the days before tests [8, 12, 14].
The modified questionnaire was used for the actual scenario. Forty healthy university students had answered the questionnaire and administered a NeuRAES 1.0 test and retest, with the test and retest held two weeks apart. The questionnaire and the first test session were distributed and administered by the study participants on 13/3/2018, 14/3/2018 and also 18/3/2018 which took place in a room at level 4 in a library building. All neurobehavioural tests were completed in a laptop running Microsoft Windows. All the demographic information was collected from all the participants on that day. The age and gender distributions of the study participants are listed in Table 1.
Table 1 Age and gender distributions of the study participants.
n: frequency
2.2 Questionnaire and interview
Questionnaire and interview are common practice done to get information from the respondent [15]. The objective of answering this questionnaire is to facilitate the specific response or the information such as the participants’ profile, history of participants’ learning activities, the use of personal protective equipment (PPE) and the exposure of chemical substances among the participants, the participants’ health status, unhealthy lifestyle, and also the symptoms which listed by WHO as the common discomforts or troubles in behaviour, feelings and sensations that a participant may experience. During the development of the questionnaire, several factors that influence the neurobehavioural effects are to be considered in the questionnaire [7].
After the participants completed all set of tests given, the examiner will carry out a short interview to ask questions related to the participants’ experience of performing the NeuRAES 1.0 tests, some general questions about their health status, and also the caffeinated and alcoholic beverage intake by the participants on that day. All the responses of these questions somewhat will contribute to the factors of the participants’ test score and need to be taken into account. In addition, it is useful in evaluating correctly any signs on adverse health reactions in participants [7].
2.3 Data collection
Collected data is crucial component to validate the study findings. The neurobehavioural performance of individuals can be evaluated through the test-retest scores obtained in Benton Visual Retention Test, Memory Symbol Test, Trail Making Test, and Pursuit aiming Test with 2 weeks interval between the test and retest. The four scores on the test-retest will then, be standardized with accordance to the recommended standard score by the WHO-NCTB operational guide in order to compare the impact of two brief time intervals on the test-retest reliability of the NeuRAES 1.0 in evaluating the functional change of the participants [9]. The equation for computing the standard score is given by Equation 1 and Equation 2 [7]:
Age (years)
Gender
Total Male
n (%)
Female n (%)
20-25 21 (52.5) 14 (35.0) 35 (87.5)
Standard score = Z-score X 10 + 50 (1) Standard deviation
Z-score = Raw score – Mean (2)
A raw score is defined as a score gained by the participants after the administration of NeuRAES 1.0 tests. While a standard score is based on a normal distribution with a mean and a standard deviation [9]. Furthermore, standard score provides comparable score for each of the tests. Raw scores need to be modified into standard scores in order to make them comparable to scores collected from previous studies and to determine which individual test results are unsatisfactory, in which, they might reflect an abnormal response [7]. In equation (1), the standard score is calculated by multiplying the score by 10 and add 50 to the result [7], where, the Z-score is obtained by taking each raw Z-scores of each tests, subtracting the mean from the raw scores.
These equations are applicable for the calculation of all the tests except for the Trail Making Test. As for the Trail Making Test, there is a slight different in terms of the process in determining its standard score, in which, the higher score gained indicates the poorer performance [7]. Therefore, the positive (+) and negative signs (-) presented by the Z-score should be reversed in order to ensure the resulting score is in positive value.
The performance of neurobehavioural problem is measured based on the scores of four tests as introduced earlier. The procedure to administer Benton Visual Retention Test, participants are required to click one by one a total number of 10 images that will be presented on a laptop screen. Then, the laptop screen will displays an image which contains four options of shape. One of them is identical to the shape presented previously. The participants need to recognize the shape presented previously for ten seconds before proceed to the answer options. Mark will be obtained based on the right answer only. As for Memory Symbol Test, it needs the participants to find the newest symbol that appears on the computer screen. The test will not be proceeded to the next level until the correct answer is clicked. The participants have 90 seconds to finish the test. The mark will be given based on the level of the achievement. For Trail Making Test, participants are required to make a trail on the sequence of number or alphabetical that scattered on the computer screen. This test consists of two parts of task; Section A and Section B. In Section A, all sequences are in numbering order (1 to 25). Meanwhile, in Section B, the sequences are mixture of numbers and alphabetical sequences. The participants need to make a trail based on numbers and alphabetical order (example: 1 – A, 2 – B). The mark will be taken based on the time taken to finish the test. And for the Pursuit Aiming Test, it is done by instructing the participants to place one dot inside each circle by following the pattern given on the laptop screen. This task needs to be performed as quickly as possible. This test encompasses of two repetition of the same pattern; Test A and Test B. The test needs to be
done within 60 seconds for each times. The marks will be given based on the right dot inside the circle.
The important role of an examiner may affect the reliability of computerized tests. Hence, to minimize the error contributed by the examiner in the process of test administration, similar general environmental condition including comfortable room temperature, lighting, and quiet condition were provided to participants in both test and retest sessions [7, 9, 11]. Identical instructions for the method of the tests were given for all the participants [7].
2.4 Data analysis
Mean and standard deviation for this study data were computed by using Microsoft excel. The best way to make comparisons for a data that encompasses with variation in test measures is by standardize the scores as explained previously. Based on the result of standard scores gained, the participants’ scores are then being interpreted in two categories, that are, abnormal/poor neurobehavioural effects (score less than 40) and normal/no neurobehavioural effects (score more than 40) [7]. The Statistical Packages for the Social Sciences (SPSS) version 18.0 were employed to analyze the data collected based on the questionnaire and the test and retest scores of NeuRAES 1.0 tests.
Paired samples t-tests were used to evaluate performance differences of test and retest among the participants. The paired samples t-test compares two means that are from the same individual. The two means typically represent two different times that are, test and retest. The purpose of running the paired samples t-test is to find out if the means of the test and retest scores are significantly different, it's also important to consider how strongly the test and retest scores are associated with one another, particularly when the variables being compared are test and retest measures [15].
3. Results and Discussion
All the study participants involved were consist of normal and healthy students. The data distribution is normal and in this discussion, the results of the analysis involved mean and standard deviation of performance scores for all participants of test and retest using raw scores and standard scores. However, there were some difference in values have been identified between these two results particularly, in terms of the mean, standard deviation and p-value after data analysis done. Table 2 and 3 showing the mean and standard deviation of performance scores for all participants of test and retest using raw scores and standard scores. The mean difference scores for each test and retest also presented.
From the analysis result of the test and retest using raw scores, the mean and standard deviation for all test measures shown a variation in values which much easier to be discussed as shown in Table 2. Hence, the discussion on participants’ test and retest performance scores based on the analysis result of test-retest raw scores. From the result shown, it was identified that Benton Visual Retention Test, Memory Symbol Test, Trail Making Test and Pursuit Aiming Test (Test A) were increased at retest based on the increase in mean values occurred at retest. This indicates that participants did very well in these measures at retest.
As for Trail Making Test, the parameter is measured in time taken (in seconds) to complete the task for each sections, therefore, there is a slight different in terms of interpretation of the results. The lower time taken by the participants in completing the tasks shown a better performance. It was observed that Pursuit Aiming Test (Test B) was decreased at retest. The amount of decrease in number of correct dot was actually quite small on average (-0.15%). Although the difference scores of NeuRAES 1.0 test-retest were statistically fairly small significant, the percentage differences were slightly larger for some measures such as Trail Making Test (Section A = 10.41%; Section B = 15.79%) and Memory Symbol Test (20.16%) compared to other measures, which ranged between 0.15% - 5.22%. This shows that improvements were largest in the motor perceptual speed (based on Memory Symbol Test), followed by the memory visual attention and task switching (Trail Making Test). While the smallest improvements was identified in visual perception and memory as well as motor steadiness (based on Benton Visual Retention Test and Pursuit Aiming Test for Test B).
Based on the results presented in Table 2, a slight improvements were noted for Benton Visual Retention Test (mean = 0.23) and Pursuit Aiming Test (Test B, mean = -0.12). Significant practice effects were identified on Memory Symbol Test, Trail Making Test, and Pursuit Aiming Test (Test A). This input shows that participants did better in retest than the test on all measures except for Pursuit Aiming Test (Test B). Overall, improvement of scores were detected on parameter measures in all four tests for test-retest raw scores except for Pursuit Aiming Test (Test B), this may be due to practice effects. Practice effects refer to gains in scores on cognitive tests
that occur when a person is retested on the same instrument or tested more than once on very similar ones [9, 11]. These gains are due to the experience of having taken the test previously and also may influence on retest results which can increase their overall score [18]. These significant practice effects were identified with faster completion of Section A and B of the Trail Making Test and an increase in the number of correct symbol on Memory Symbol Test as well as an increase in the number of correct dot for Test A on the Pursuit Aiming Test. The practice effects (or learning effects) were observed through the magnitude of the score difference between the test and the retest [11].
According to Farahat and Rohlman, this circumstances is expected to occur, as re-administration of the same measures tend to result in improved performance particularly at short time intervals [10]. Numerous studies have also shown a general test taking benefit in which enhanced performance may occur after repeated examination, even with different neurobehavioural test items [18]. It was expected that participants in this study would demonstrate a somewhat higher performance the second time due to practice effects. However, the actual degree of practice effect varied on each test measures [18]. For this study, the practice effect is obviously seen in the number of correct symbol on Memory Symbol Test than in other test measures. A possible explanation is that tests with a single solution, especially if it can be easily conceptualized once it is achieved, are more tend to show significant practice effects [10].
Several factors contributed to the possibility of practice effects in this case including, participants were aware of the questions on the test, therefore, they may become more adept because they were repeating the test [6, 10, 18]. Participants’ motivation or attention during perform the test may contribute to their performance on neurobehavioural tests, especially when the test is administered a second time [9]. Commonly, participants initially may be excited to perform the tests during the first session, but then their enthusiasm decreases the second time due to some reasons for example they might be afraid of getting a lower score than the first test. Therefore, it is very important to maintain the motivation of the participants when tests are to be taken repeatedly.
Statistical significance is determined by looking at the p-value [16]. The p-value provides the probability of observing the test results under the null hypothesis. A low p-value result indicates lower probability to get null hypothesis [16, 21]. While, the similarity in test and retest results reported in higher p-value (p≈1.00). The null hypotheses of this case assumes that the true mean difference between the paired samples is zero, which represents that test and retest scores are similar. The limit value used for determining statistical significance was a value of 0.05 or less [19].
measures. WHO in its previous case study said that, a person with a score of 25 on the Benton Visual Retention
Test did as poorly as a person with a score of 25 on the very different Trail Making Test [7]. In this scenario, it is
Table 2 Mean and standard deviation of performance scores of test and retest, test and retest difference, and p-value of NeuRAES 1.0 tests using raw scores.
SD: Standard deviation. a
p-value of paired t-test. b (Difference x 100)/test score.
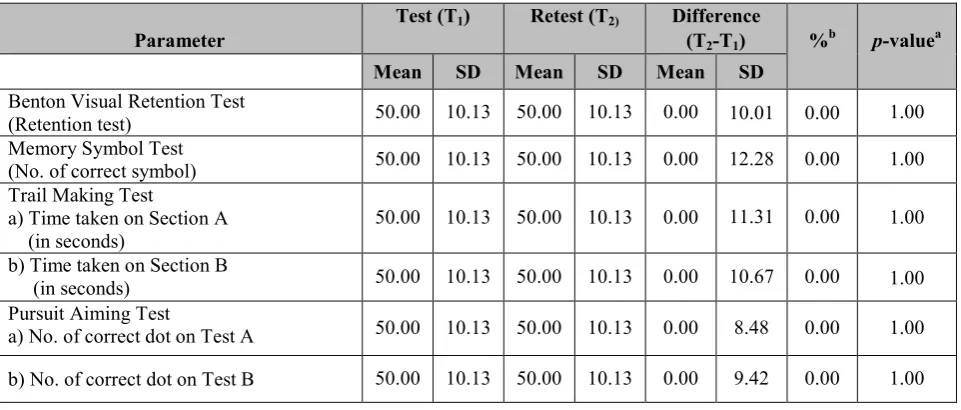
Table 3 Mean and standard deviation of performance scores of test and retest, test and retest difference, and p-value of NeuRAES 1.0 tests using standard scores.
Parameter
Test (T1) Retest (T2) Difference
(T2-T1) %b p-valuea
Mean SD Mean SD Mean SD
Benton Visual Retention Test
(Retention test) 50.00 10.13 50.00 10.13 0.00 10.01 0.00 1.00
Memory Symbol Test
(No. of correct symbol) 50.00 10.13 50.00 10.13 0.00 12.28 0.00 1.00 Trail Making Test
a) Time taken on Section A (in seconds)
50.00 10.13 50.00 10.13 0.00 11.31 0.00 1.00
b) Time taken on Section B
(in seconds) 50.00 10.13 50.00 10.13 0.00 10.67 0.00 1.00
Pursuit Aiming Test
a) No. of correct dot on Test A 50.00 10.13 50.00 10.13 0.00 8.48 0.00 1.00
b) No. of correct dot on Test B 50.00 10.13 50.00 10.13 0.00 9.42 0.00 1.00
SD: Standard deviation. a
p-value of paired t-test. b
(Difference x 100)/test score.
clearly seen that the measures for both tests were totally different where, Benton Visual Retention Test is measured in retention test, while the Trail Making Test is measured in time taken to complete the test. This evident supports that the data analysis using test-retest raw scores
is not relevant to be applied in considering the statistical significance of test-retest because the interpretation of the result will be totally in contrast and definitely will affect the result obtained. Hence, the statistical significance of a paired samples t-test results for this study based on the test-retest standard scores as shown in Table 3.
Parameter
Test (T1) Retest (T2) Difference
(T2-T1) %b p-valuea
Mean SD Mean SD Mean SD
Benton Visual Retention Test
(Retention test) 9.45 0.75 9.68 0.53 +0.23 0.66 +2.43 0.037
Memory Symbol Test
(No. of correct symbol) 15.23 2.29 18.3 2.89 +3.07 3.18 +20.16 0.000 Trail Making Test
a) Time taken on Section A (in seconds)
20.18 4.72 18.08 3.18 -2.10 4.59 -10.41 0.006
b) Time taken on Section B
(in seconds) 30.58 6.71 25.75 7.11 -4.83 7.28 -15.79 0.000
Pursuit Aiming Test
a) No. of correct dot on Test A 75.25 8.81 79.18 8.35 +3.93 7.20 +5.22 0.001
The analysis result of the test and retest with standard scores shows the mean and standard deviation for all test measures were equal in values where, mean equal to 50.00; SD equal to 10.13 as shown in Table 3. The mean value of 50 is equivalent for all measures represents the average (mean) score on those tests. How the most of the participants scores are spread either close to the mean, or, far above/below the mean is determined by standard deviation [19]. It is difficult to find mean difference scores by looking at the standard scores result due to the identical mean given by all measures. This explains the reason of the discussion on participants’ test-retest performance scores is based on the analysis result of test-retest raw scores.
While, the p-values given by the analysis of test and retest standard scores for all test measures were a comparable value that is, 1.00. Overall, the statistical significance of a paired samples t-test results based on the test and retest standard scores shows that the test and retest scores differences were significantly similar for all tests as can be seen in Table 3.
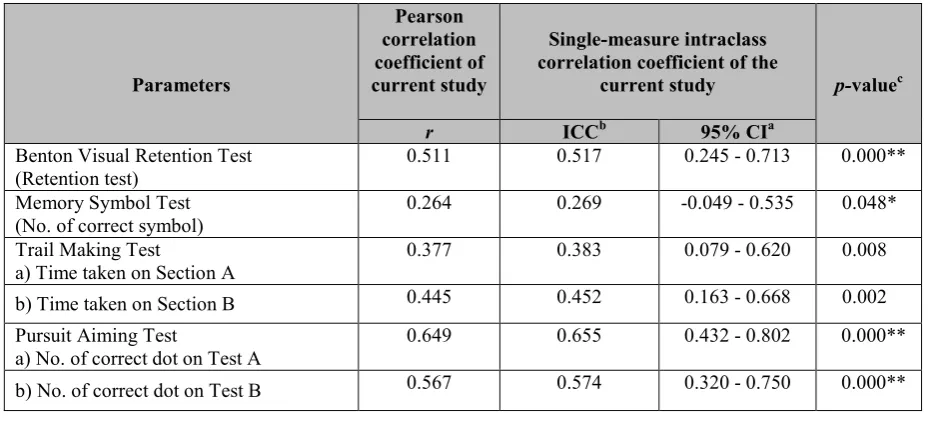
When NeuRAES 1.0 tests need to be administered to individuals or groups more than once to recognize the changes in their neurobehavioural functions over time, the reliability of the test is vital dimension [11]. In this context of study, test and retest reliability coefficient is a measure of how consistent the results of a test are over time [9, 10]. Therefore, the reliability of the administered NeuRAES 1.0 tests was evaluated by Pearson product– moment correlation coefficient (r) and intraclass correlation coefficient (ICC) at a 2 week interval. The Pearson correlations and intraclass correlations coefficient, their 95% confidence intervals and p-value of the administrated NeuRAES1.0 tests are summarized in Table 4.
According to the data acquired, the ICCs of the study ranged from 0.269 to 0.655 while, the range of Pearson coefficients of the study were from 0.264 to 0.649. It was observed that, the difference of ICCs obtained and Pearson coefficient values were not significant, they were about 0.004 – 0.006 points only. The results gained shown that most of the measures in NueRAES 1.0 demonstrated low ICCs across sessions separated by two weeks. The low ICCs were found on Memory Symbol Test (ICC = 0.269, r = 0.264), Trail Making Test (Section A: ICC = 0.383, r = 0.377; Section B: ICC = 0.452, r = 0.445), Benton Visual Retention Test (ICC = 0.517, r = 0.511), and Pursuit Aiming Test (Test B: ICC = 0.574, r = 0.567). Nevertheless, the best part in this study was, an adequate ICC was found on Pursuit Aiming Test (Test A: ICC = 0.655, r = 0.649) where, the ICC was greater than 0.6. No high correlation coefficient was detected.
This finding clearly revealed that reliabilities for most measures in NeuRAES 1.0 tests were still have not achieved a condition where, a measurement process is capable to produce stable and consistent scores when repeated over time except for Pursuit Aiming Test (Test A). The ICC reflects the differences in the mean values and degrees of correlation of the two sets of measures [11]. The dissimilarity of the ICCs and Pearson
coefficients indicate that the participants in each session did not present the tendency to retain their absolute scores and relative ranks across the test sessions, whereas in the reality, it was observed that most of the participants made some efforts in maintaining their scores across testing occasions by showing a better improvement in most of measures. The variation scores signify an indication of the effect of practice that have been discussed earlier [8]. Although most of the measures in NueRAES 1.0 tests demonstrated correlation coefficients lower than 0.6, it was observed that there were positive correlation coefficients between test-retest in all these measures. This input also important to be taken into account to find out how strongly the test and retest scores are associated with one another [21]. These information can be seen in column 5 of Table 4 where, they are observed through the paired samples correlation result. Therefore, we should consider the possible factors that affect this result. Multiple factors may contributed to the low reliability coefficients have been identified. The first factor that influenced the reliability coefficients was the limited sample size. Samples size used in this study were too small if compared to other previous studies. A sample size that is too small reduces the power of the study and increases the margin of error, which can lead to study provide less conclusive results [20]. In fact, in the formula the sample size is directly proportional to Z-score and inversely proportional to the margin of error. Consequently, reducing the sample size reduces the confidence level of the study, which is related to the Z-score. Decreasing the sample size also increases the margin of error [20]. Therefore, when a small sample size is applied, researcher needs to solve less conclusive results which provide low reliability coefficient of the data. Based on some literature reviews done for computerized neurobehavioural test-retest, it can be concluded that most of the sampling size used by the researchers was quite large for about not less than fifty participants. Nonetheless, the decision of the samples size taken for this study was only 40 due to time constraints to complete the study.
if a test is so easy that every student gets most or all of the items correct or so difficult that every student gets most or all of the items wrong.
From the information obtained through the final question in the interview session, participants were given an opportunity to share their experience in performing the
Table 4 Pearson correlations and intraclass correlations coefficient, their 95% confidence intervals and p-value of the administrated NeuRAES1.0 tests.
Parameters
Pearson correlation coefficient of current study
Single-measure intraclass correlation coefficient of the
current study p-valuec
r ICCb 95% CIa
Benton Visual Retention Test (Retention test)
0.511 0.517 0.245 - 0.713 0.000**
Memory Symbol Test (No. of correct symbol)
0.264 0.269 -0.049 - 0.535 0.048*
Trail Making Test
a) Time taken on Section A
0.377 0.383 0.079 - 0.620 0.008
b) Time taken on Section B 0.445 0.452 0.163 - 0.668 0.002
Pursuit Aiming Test
a) No. of correct dot on Test A
0.649 0.655 0.432 - 0.802 0.000**
b) No. of correct dot on Test B 0.567 0.574 0.320 - 0.750 0.000**
a
Confidence interval (95%). b Intraclass correlation coefficient c p-value of ICC.
* p < 0.05 ** p < 0.01
NeuRAES 1.0 tests. On average, more than 50.0% participants reported there had some difficulties in performing the computer test at test session, however this percentage decreased to 40.0% at retest. This indicated that the participants were getting familiar with the form of the tasks during the test session therefore, it made much easier for them to perform the test on the second time. Moreover, it was observed that participants had higher confidence levels in performing the computer test at retest compared to a test session where, it can be seen that some of participants had a slightly awkward feeling at the first time of performing the computer test. From the statistical analysis acquired, it was found that a small proportion of participants (15.0%) reported had a lot difficulties to perform the computer test at test session, this percentage nevertheless, dropped dramatically to zero (0.0%) at retest. This shown that the participants were smarter in controlling the constraints that came especially when handling mouse during performing the computer test.
The third factor that contributed to the low reliability in this study was the group variability. In this study, the group of participants being tested was consist of university students only, which is homogeneous in ability. Therefore, the reliability of the test scores was likely lowered. In general, the more heterogeneous the group of participants who take the test, the more reliable the measure will be [10, 22].
The fourth factor was testing environmental condition. Some errors in the testing situation was occurred such as vibration distractions that came from participants’ cellphones which placed on the testing table during performed the computer test, the lighting from the laptop was less than ideal thus, made the participants were uncomfortable with the condition and ended up sat in poor posture which can lead to test scores to vary [7]. Based on the observation that recorded into a testing log sheet, it was found that some participants claimed that they had some difficulties on the Pursuit Aiming Test where, when they clicked on the selected dot sometimes the mouse provided could not detect the selected dot accurately which, resulting in a concentration distractions in completing the Test A and B. Moreover, there were several participants had watery eyes caused by staring at computer screen too long at a time particularly, when they were too focused in acquiring as much as possible the number of correct dot. This probably occurred due to a matter related to the lighting source mentioned earlier. Apart from that, it was discovered that it was a huge challenge for some female participants in performing the Memory Symbol Test. This is identified through the complaints claimed by some female participants, in which, when the number of new symbols that appeared on the laptop screen increased, they found that it was hard to identify which one of the latest symbol.
fluctuations. They may raise or lower the reliability of the test scores. Among of momentary fluctuations that been identified including anxiety regarding non-completion of assignments, laboratory reports, or unfinished experiment for final year project, not ready for sitting an academic test or mistake in giving the answer in the test and knowing no way to change it [11], which may affect the reliability of test scores. In addition, according to Dikmen and Temkin in a journal published in 2001, test-retest methods are only suitable to use with tests of characteristics that are assumed to be stable over time, such as intelligence [18]. They are unsuitable for tests of unstable characteristics like emotional states such as anger, tired or ill the day of the test because it affect the scores [18].
Based on the responses gained through the interview session, most participants were lack of sleep due to the academic test season. When participants did not get enough sleep, it made them drowsy, tired which also slow their responses. This situation can negatively affect their memory and increase their stress levels during performing the NeuRAES 1.0 tests. From one study that published in 2010 concluded that, most people who lack of sleep will have problems paying attentions and making quick decisions under pressure such as academic exams [14]. Therefore, this evident supports that unstable emotional states tend to contribute to the lower reliability of test-retest scores.
The result of interview has shown that during the test session, it was observed that more than a half of participants (55.0%) reported they get about the usual amount of sleep prior to administer the NeuRAES 1.0 tests. While about 45.0% of participants reported they get less than usual amount of sleep. However, when participants were re-interviewed during the retest session, this scenario took place on the contrary, where, a large proportion of participants (60.0%) reported they get less than usual amount of sleep and about 40.0% of participants get about the usual amount of sleep. Approximately there was a 15.0% increase in participants who get less sleep at the retest week.
According to the responses gained from the participants, it can be concluded that nearly all the participants were involved with academic test for their courses on the week of the NeuRAES 1.0 retest done. Thus, they spent more times for revision activities, in addition, had to do other works such as assignments, laboratory reports and had some project discussions among the group members. This input explains the reasons of most participants were lack of sleep on that week.
Therefore, from the factors that have been discussed, it can be summarized that the NeuRAES 1.0 tests have not achieved the criterion as a reliable instrument to assess neurobehavioural problems. The difference in expectation result suggest that the reliability of NeuRAES 1.0 tests can be improvised in the future study.
4. Conclusion
The finding of study shown all parameter measures in all four tests for test and retest scores were significantly similar and the improvements of test-retest scores were also detected. Practice effects occur when a person is retested on the same instrument. The p-values given by the standard data results shows that test and retest scores differences were significantly similar for all tests.
An adequate reliability was detected on the Pursuit Aiming Test. This finding suggests that Pursuit Aiming Test (Test A) has some benefits over the other neurobehavioural test measures to be utilized in periodical assessment of the neurobehavioural performance. Although most measures in NeuRAES 1.0 tests demonstrated low correlation coefficients, this does not mean that all these measures have poor reliabilities because, there were positive correlation coefficients between the test-retest scores in all these measures. The possible factors that affect this result including a small samples size used, the difficulty level and clarity of expression of a test measure, group variability, testing environmental condition, and momentary fluctuations such as unstable emotional states among the study participants. Therefore, it is important to identify these factors prior the test-retest to be administered to individuals or groups.
Based on the finding gained and by taking into consideration the limitations of study area, some useful recommendations have been outlined to improve the quality of finding results in further study:
i. Increasing the amount of samples size in performing the neurobehavioural test and retest (for example more than fifty participants) in order to obtain a definite results, which able to provide a high reliability coefficient of the data.
ii. The findings regarding the reliability of neurobehavioural tests should be extended to a various group of participants. The group of participants who take the test may be involve the participants from industry that exposed to chemical that may affect their neurobehavioral system.
iii. The rule of testing room preparation requires further evaluation to overcome the issues arise such as vibration distractions by participants’ cellphones and the poor quality of lighting by the test instrument itself during the neurobehavioural test and retest session.
Acknowledgement
This research was supported by Ministry of Education Malaysia under the Fundamental Research Grant Scheme (FRGS) vote 1539 in Universiti Tun Hussein Onn Malaysia. The authors also gratefully acknowledge Research Management Centre (RMC) of Universiti Tun Hussein Onn Malaysia on their endless support.
References
Dictionary (2017). Retrieved on September 28, 2017, from http://merriam webster.com/medical/ neurobehavioural. Medical.
[2] A. J. Michael, B. Francois, and S. F. Dick, Eds. Handbook of Clinical Neurology Amsterdam, Elsevier B.V., Volume 110, (2013), pp. 377–389. [3] Grandjean P, Landrigan PJ. Neurobehavioural
effects of developmental toxicity. Lancet Neurology. Volume 13, (2014), pp. 330–338.
[4] National Academies Press. Guidelines for neurotoxicity risk assessment (1998).
[5] Khaleel, A. Nervous System. Health and Medicine. (2015). Retrieved on November 3, 2017 from https://www.slideshare.net/khaleelya/nervous-system-43607868.
[6] American Conference of Governmental Industrial Hygienists (ACGIH). TLVs® and BEIs® based on the documentation of the threshold limit values for chemical substances and physical agents & biological indices, (2014).
[7] World Health Organization (WHO). Operational guide for the WHO neurobehavioral core test battery, (1986).
[8] Rohlman, D.S., Gimenes, L.S., Eckerman, D.A., Kang, S.K., Farahat, F.M., and Anger, W.K. Development of the behavioral assessment and research system (BARS) to detect and characterize neurotoxicity in humans. Neurotoxicology, Volume 24, pp. 523–31.
[9] Sakong, J., Kang, P., Kim, C., Hwang, T., and Jeon, M. Evaluation of reliability of traditional and computerized neurobehavioral tests, Neurotoxicology, Volume 28, (2007), pp. 235–239. [10] Farahat, F. M., Rohlman, D. S., Storzbach, D.,
Ammerman, T., and Anger, W.K.. Measures of short-term test – retest reliability of computerized neurobehavioral tests. Neurotoxicology, Volume 24, (2003), pp. 513–521.
[11] Lee, K., Jeon, M., Hwang, T., Kim, C., and Sakong, J. Evaluation of reliability of computerized neurobehavioral tests in Korean children. Neurotoxicology, Vol 33, (2012), pp. 1362–1367. [12] Chung, J., Sakong, J., Kang, P., Kim, C., Lee, K.,
Jeon, M., Sung, N., Ahn, S., and Won, K.. Cross-cultural comparison of neurobehavioral performance in Asian workers, Neurotoxicolog, Volume 24, (2003), pp. 533–540.
[13] Muhammad Faris Roslan, Afandi Ahmad, and Abbes Amira (2018). Real-Time High Jump Wearable Device with ESP8266 for High-Performance and Low-Injury. International Journal of Integrated Engineering, Volume 10, (2018), pp. 14-19.
[14] Bovim G, Naess P, Helle J, and Sand T. Caffeine influence on the motor steadiness battery in neuropscycological tests. J Clin Exp Neuropsychol., Volume 72, (1995),pp. 472-476.
[15] K. Ambak, H. Hashim, I. Yusoff, and B. David. An Evaluation on the Compliance to Safety Helmet Usage among Motorcyclists in Batu Pahat, Johor.
International Journal of Integrated Engineering Volume 2, (2010), pp. 45-51,
[16] Andy, F.. Discovering statistics using SPSS. (3rd ed.). London: SAGE Publication Ltd, (2009). [17] Shrout, P. E., and Fleiss, J. L.). Intraclass
correlations uses in assessing rater reliability. Psychol Bull, Volume 86, (1979), pp.420–428. [18] Dikmen, S. S., Heaton, R. K., Grant, I., and Temkin,
N. R.. Test–retest reliability and practice effects of expanded Halstead–Reitan neuropsychological test battery. Journal of Int Neuropsychol Soc, Volume 5, (2001), pp. 346–356.
[19]Temkin, N.R., Heaton, R.K., Grant, I., and Dikmen,S.S. Detecting significant change in neuropsychological test performance: a complication of four models. Journal of Int Neuropsychol Soc, Volume 5, (1999), pp. 357–69. [20] Lwanga, S.K., and Lemeshow, S.. Sample size
determination in health studies: a practical manual. Geneva: World Health Organization, (1991). [21] Bland, J. M., and Altman, D.G. Measurement error
and correlation coefficients. BMJ, Volume 313, (1996), pp. 41–42.