Volume 2010, Article ID 153102,17pages doi:10.1155/2010/153102
Research Article
FloorNet: Deployment and Evaluation of a Multihop
Wireless 802.11 Testbed
Pablo Serrano,
1Carlos J. Bernardos,
1Antonio de la Oliva,
1Albert Banchs,
1, 2Ignacio Soto,
1and Michael Zink
31Departamento de Ingenier´ıa Telem´atica, Universidad Carlos III de Madrid, Avenida Universidad 30, 28911 Legan´es, Spain 2IMDEA Networks, Avenida del Mar Mediterr´aneo 22, 28918 Legan´es, Spain
3Department of Electrical & Computer Engineering, University of Massachusetts Amherst, 151 Holdsworth Way,
Amherst, MA 01003, USA
Correspondence should be addressed to Pablo Serrano,[email protected]
Received 30 June 2009; Revised 12 October 2009; Accepted 24 November 2009
Academic Editor: Faouzi Bader
Copyright © 2010 Pablo Serrano et al. This is an open access article distributed under the Creative Commons Attribution License, which permits unrestricted use, distribution, and reproduction in any medium, provided the original work is properly cited.
A lot of attention has been given to multihop wireless networks lately, but further research—in particular, through experimentation—is needed. This attention has motivated an increase in the number of 802.11-based deployments, both indoor and outdoor. These testbeds, which require a significant amount of resources during both deployment and maintenance, are used to run measurements in order to analyze and understand the limitation and differences between analytical or simulation-based figures and the results from real-life experimentation. This paper makes two major contributions: (i) first, we describe a novel wireless multihop testbed, which we name FloorNet, that is deployed and operated under the false floor of a lab in our Computer Science building. This false floor provides a strong physical protection that prevents disconnections or misplacements, as well as radio shielding (to some extent) thanks to the false floor panels—this later feature is assessed through experimentation; (ii) second, by running exhaustive and controlled experiments we are able to analyze the performance limits of commercial off -the-shelf hardware, as well as to derive practical design criteria for the deployment and configuration of mesh networks. These results both provide valuable insights of wireless multihop performance and prove that FloorNet constitutes a valuable asset to research on wireless mesh networks.
1. Introduction
Nowadays, there are many 802.11-based deployments, both indoor [1–5] and outdoor [6–8], with this success being primarily motivated by the low cost and wide availability of Wireless LAN (WLAN) devices. These deployments are used for a variety of purposes, for example,
(i) to provide communication in rural areas [9–11], (ii) as a distributed infrastructure for the supervision of
enterprise-sized WLANs [12,13],
(iii) to build community mesh networks, both by private companies or by universities [14,15],
(iv) as a research infrastructure to understand and assess the impact of the assumptions made by theoretical analysis, or wherein to develop heuristics and
algo-rithms for network optimization and configuration [1,4,16],
(v) as a way of providing home networking [17].
In this paper, we present FloorNet, a research-motivated testbed that is comprised of 24 wireless routers which are installed under the false floor in one of the rooms of our Computer Science (CS) building. Out of the potential locations for such a medium-size testbed (e.g., wiring closets, lowered ceilings, private offices), we decided to deploy it under the false floor because of following reasons.
(i) Many CS/Information Technology (IT) buildings have false floors, which can be seen as an “unused” and “unclaimed” large space with a lot of room for cables and devices.
(ii) This space is easily accessible but physically well protected, and therefore the risk of physical damage, disconnecting wires, or even moving the equipment is null (note that even slight changes in the relative location of the wireless devices can change the results obtained from the same experiment [18]).
(iii) In addition, this space is also provided with gridded power and wired network connectivity (sockets are usually uniformly distributed through the room).
Finding a convenient, simple, and cost-efficient way to install a multihop wireless testbed is only one part of the challenge of building a realistic multi-hop testbed. In addition, a characterization of the testbed is required to determine how the environment (interference from other wireless devices, isolation through metal in the floor) can impact experiments. This is done for a series of single link measurements; that is, only one wireless link between two routers is active at a time. Results from these experiments show that 802.11 devices can benefit from this isolation, depending on the surrounding sources of interference. We also assess the devices’ performance under large frame-per-second rates, and investigate if transmission power can be used as a means to emulate a variety of multi-hop scenarios in the testbed—which is indeed the case for 802.11a. Note that this feature results in the ability to change topology without physically moving the hardware or using attenuators.
With the above, we use our testbed to analyze two diff er-ent research scenarios: first, we conduct extensive experimer-ents in which two links are active simultaneously. Here our goal is to investigate how these two links interfere with each other based on channel distance and transmission power; second, we compare different channel and power allocation algorithms in a multi-hop configuration. Results from these experiments not only demonstrate the research capabilities provided by FloorNet, but also provide valuable insights of wireless multihop performance.
The rest of the paper is organized as follows.Section 2
describes the testbed, equipment, costs, and configuration;
Section 3analyzes the behavior of single links in the testbed;
Section 4 goes a step further and studies the behavior of pairs of links working simultaneously and how they influence each other;Section 5analyzes the performance of multihop communications;Section 6lists the lessons learned during the set up of the testbed and the experiments; and finally
Section 7concludes the paper.
2. Description of FloorNet
In this section we describe FloorNet, a wireless mesh testbed deployed under the false floor of one of the labs of our CS building, both technically and in terms of cost. We also assess the isolation provided by the false floor, as well as the performance limits of the hardware used.
2.1. Experimental Setup. FloorNet is composed of 24 routers,
as shown in Figure 1. Since cost is a key factor that dete-rmines the feasibility of mesh deployments, we use com-mercial off-the-shelf (COTS) wireless routers to assess the performance that can be achieved with nonspecialized hardware. In particular, we use 2 different devices.
(i) Linksys WRT54GL v1.1. This is a small and very pop-ular home and office broadband router, equipped with a 200 MHz processor, an IEEE 802.11b/g WLAN interface, and an IEEE 802.3 Ethernet interface con-nected to a Virtual LAN (VLAN) capable 5-port switch.
(ii) Asus WL-500GP v1.0. This small residential router is equipped with a 266 MHz processor, an IEEE 802.11b/g WLAN interface and an IEEE 802.3 Eth-ernet interface connected to a VLAN capable 5-port switch. (Note that v2.0 does not provide this feature.) This version of the router has a mini-PCI slot that allows to change the original wireless card. We remove the original Broadcom card and insert instead an Atheros based 802.11a/b/g (Alfa Networks AWPCI085S) one. This card is supported by the Madwifi (http://www.madwifi.org/) driver. Because of the different frequency band used by 802.11a, we exchange the original 2.4 GHz antenna for a dual-band and low gain (8 dBi) external antenna (Asus WL-ANT 168) for all the Asus routers.
The firmware of both types of routers can be replaced with an open source Linux-based firmware. We install the OpenWRT (http://www.openwrt.org/) [19] Kamikaze 7.09 distribution with a Linux-2.4 kernel in the routers. This firmware gives us more flexibility in the use and configuration of the routers than the original firmware.
A wired interface of each of the routers is used to perform several control and management plane operations, such as the global synchronization of the local time of all the routers, the remote execution of tests, and the retrieval of the results for offline processing. Two central nodes (PCs, not shown inFigure 1) are used to control and monitor all the routers of our deployment through the wired interfaces. They also serve as traffic source and sink for most of the tests (we assess the impact of the entity generating traffic in Section 2.3). By this way, management traffic does not interfere with the actual measurement data on the wireless medium. All the routers and the central nodes are connected to a pair of 24-port Gigabit D-LINK DGS-1224T switches (not shown in
Figure 1).
R104 R004
R108 R008 R107
R007 R103
R003 R102
R002
R106 R006 R101
R001
R105 R005
R110 R010
R112 R012 R111
R011 R109
R009
9.6 m
12 m
Linksys WRT54 GLv1.1, Broadcom BCM43XX IEEE 802.11 b/g (integrated) R0XX
Asus WL-500 GPv1.0, Atheros AR5006×
AR5414 IEEE 802.11 a/b/g (mini-PCI) R1XX
Figure 1: Physical deployment of FloorNet.
60 MHz 20 MHz 22 MHz
36 5.18
40 5.2
44 5.22
48 5.24
52 5.26
56 5.28
60 5.3
64 5.32
100 5.5
104 5.52
108 5.54
112 5.56
116 5.58
120 5.6
124 5.62
128 5.64
132 5.66
136 5.68
140 5.7 Channel
Center frequency (GHz)
IEEE 802.11a
Channel Center frequency (GHz)
IEEE 802.11 (b/g)
1 2.412
2 2.417
3 2.422
4 2.427
5 2.432
6 2.437
7 2.442
8 2.447
9 2.452
10 2.457
11 2.462
12 2.467
13 2.472
Figure 2: Available 802.11g and 802.11a channels in Spain.
nodes. The wireless parameters (e.g., SSID, mode, transmis-sion power, etc.) can also be changed remotely. This allows us to dynamically modify the network topology as required by the different experiments.
We configure all the devices to use the country settings for Spain. This has an impact on the channels that can be used—Figure 2shows the 802.11a and 802.11b/g channels for Spain—and on the maximum allowed transmission power levels. We disable 802.11b compatibility mode in the Linksys routers by setting theGOnly flag but we keep the devicesrate adaptation [20] algorithms enabled. By this way,
we have a smoother transition between connectivity and no connectivity situations, while we avoid performance drops caused by the use of 802.11b compatibility mode in 802.11g networks [21].
2.2. Cost. One of the key features of FloorNet is that it is
a cheap but powerful testbed. The following list gives an overview on the estimated cost of the equipment used.
(iii) Alfa Networks AWPCI085S mini-PCI card: 36 C per unit.
(iv) Asus WL-ANT 168 antenna: 22 C per unit.
In addition to the previous equipment, we only need a pair of Ethernet switches, the wiring, two PCs, and a ro-om with false floor (which is quite cro-ommon in offices/ laboratories where computer equipment is installed). With this deployment we are able to run automatized experiments with little human interaction and maintenance. An estima-tion of the overall cost of the testbed is 4200 C.
2.3. Impact of the Entity Generating Traffic. In our testbed,
as described in Section 2.1, we use PCs to generate traffic while wireless devices are used only to forward it to the final destination. This closely resembles real wireless deployments. An alternative configuration, that can be quite tempting, is to generate the traffic in the wireless routers, by this way reducing the equipment needed and the corresponding management operations.
This alternative configuration would be feasible only if generating the traffic in the wireless devices does not affect the behavior of the testbed. The concern is that traffic generation can impose a severe burden to the (typically small) capacity of the off-the-shelf devices used in the testbed. To assess the extent to which traffic generation can reduce the forwarding ability of these devices, we perform the following experiment. Using the PCs to generate traffic
with iperf-2.0.2 (http://sourceforge.net/projects/iperf/),
we measure the maximum UDP bandwidth achievable for different frame sizes (i.e., different frames per second). In this way, the frames generated by one of the PC are sent through the wired Ethernet to a first wireless device, that sends it over the wireless medium to the second device, that finally forwards the frames to the receiving PC. The devices used were R104 and R108 for the case of Asus devices, and R004 and R008 for the Linksys devices (note that the experiments are not performed simultaneously).
After we finish this round of experiments, we repeat the measurement, but in this case using the wireless devices themselves to generate the traffic. By this way, the frames are generated at the wireless router and sent over the wireless medium to be received at the other wireless device. We run these two configurations for the following three cases: (i) using the Linksys devices, (ii) using the Asus devices configured in 802.11g mode, and (iii) using the Asus devices configured in 802.11a mode. We also measure using
cyclesoak (we had to download the source code of the
tool from http://www.tux.org/pub/sites/www.zip.com.au/ %257Eakpm/linux/zc.tar.gzand cross-compile it to run on the MIPS architecture of the devices) the CPU utilization in all cases, with this being always larger than 90% which confirms that the CPU usage is a limiting factor for throughput (however, note that the CPUs of the Linksys and the Asus have different capacity).
We perform the same measurement 5 times to obtain the average, maximum, and minimum values. The results from these experiments, also compared against the maximum
theoretical performance [22], are given in Figure 3. We highlight the following results from these experiments.
(i) The entity used to generate traffic can have a significant impact on the performance. Therefore, in general it is not safe to generate traffic using COTS wireless devices and assume that the scenario is closely resembling the performance of real wireless deployments—in these, traffic is generated by the end hosts, while the devices are devoted to forwarding. In particular, for the cases of Asus 802.11a and Linksys 802.11g, the resulting performance is significantly different depending on the entity generating the traffic.
(ii) On the other hand, for the case of Asus 802.11g the performance is very similar regardless of the entity generating traffic. Note that, for this case, the best performance obtained is well below the theoretical maximum, while for the case of Asus 802.11a the performance using the PCs is closer. Motivated by this result, we conjecture that the radio access is acting like a bottleneck that prevents the performance of the “PCs” and “Devices” cases to diverge.
(iii) For the Linksys 802.11g case the relative performance of each approach depends on the frame size. For small frame sizes, the largest throughput is obtained using the wireless routers to generate traffic; for large frame sizes, the largest throughput is obtained using the desktop machines. We conjecture that this is caused because the Linksys is not able to cope with the processing burden of receiving-forwarding-transmitting a large number of small frames per second. On the other hand, the Asus router does not show this behavior.
(iv) For the case of 802.11g and using large frame sizes and the desktop machines, the performance obtained with the Linksys devices is slightly larger than the one obtained with the Asus devices. We conjecture that the reason for this small improvement in the crowded 802.11g is that the Linksys is provided with two antennae for space diversity.
The main conclusion from the above results is that, indeed, the entity generating traffic can introduce a bias in the performance obtained, and therefore before running extensive measurements in a testbed great care has to be put in the performance assessment of the devices. Note that from now on all experiments are performed using a frame size of 1500 bytes and using the PCs to generate traffic.
2.4. False Floor Isolation. Apart from the physical protection,
100 300 500 700 900 1100 1300 1500 Frame size (bytes)
Linksys 802.11 g 5
15 25 35
Thr
o
ug
hput
(Mbps)
100 300 500 700 900 1100 1300 1500 Frame size (bytes)
Asus 802.11 g 5
15 25 35
Thr
o
ug
hput
(Mbps)
100 300 500 700 900 1100 1300 1500 Frame size (bytes)
Asus 802.11 a 5
15 25 35
Thr
o
ug
hput
(Mbps)
Maximum Devices PCs
Figure 3: Impact of using the wireless devices to generate traffic.
Table 1: Impact of the false floor on the link performance.
Device Tx Power Above Below RSSI Throughput RSSI Throughput Linksys 1 dBm −39.0 17.8 Mbps −53.4 21.2 Mbps (802.11g) 19 dBm −28.0 19.5 Mbps −42.3 22.7 Mbps Asus 5 dBm 52.0 29.7 Mbps 46.4 29.8 Mbps (802.11a) 17 dBm 73.4 29.6 Mbps 69.2 29.6 Mbps
the case of Linksys, and the pair R109, R110 for the case of Asus) and measure the throughput obtained with a UDP unidirectional communication for 30 seconds. We repeat the measurement 5 times for two values of the transmission power. We also record the RSSI value reported by the wireless device (RSSI, Received Signal Strength Indication, is a measurement, reported by the receiving device, of received signal strength. The value of RSSI is vendor dependent and has not units). Next, we place both devices under the false floor and repeat the process. The average values of the 5 runs for each configuration are presented inTable 1.
Out of the results of the table, it is clear that the false floor has some impact on the values obtained for each configuration. Considering throughput, the results can be summarized as follows.
(i) For the case of 802.11g, the throughput values obtained when both devices are placed under the false floor are noticeable larger (>15%) than when both devices are above the floor.
(ii) For the case of the 802.11a devices, however, there is no difference in terms of throughput between the configurations.
Therefore, it seems that the false floor provides, at least for the case of the Linksys devices, a better environment for the performance of experiments (we performed additional experiments to assess the ability of the false floorpanels to
−60 −55 −50 −45 −40 −35 −30 −25 −20 RSSI
10 12 14 16 18 20 22 24
Thr
o
ug
hpu
t
(Mbps)
Above Below
Figure 4: Performance of a single 802.11g link above and below the
false floor.
attenuate a wireless communication, and indeed crossing the false floor resulted in a throughput degradation of approximately 30% for both the 802.11a and 802.11g cases). For 802.11a, on the other hand, there is no difference—a result that one could expect in advance, given that while the 2.4 GHz is crowded, there is less activity in the 5 GHz band (we will further verify this inSection 3.1).
Considering the reported RSSI values ofTable 1, a first (and expected) result is that, for the same scenario, the larger the transmission power used, the larger the RSSI. However, there is a second and nonintuitive result: the RSSI values are
smaller when both devices should have been “shielded” by the false floor. Furthermore, for the case of the Linksys devices
To analyze this result, we repeat the experiments for the Linksys devices, considering 5 different values for the transmission power (namely, 1, 5, 10, 15, and 19 dBm). Each measurement is repeated five times. Then we plot the values of throughput obtained versus the reported RSSI values in
Figure 4, where we use circles to represent values when both devices are below, and black squares to represent values when both devices are above the floor. We observe the following results.
(i) When both devices are below the false floor, the throughput values are larger and present less vari-ability, and there seems to be a small positive correlation with the RSSI value—this would be the “expected” behavior in interference-free environ-ments, as proved in [23].
(ii) When both devices are above the false floor, indeed the RSSIs reported are larger, but there is more vari-ation both in the RSSI values and in the throughput obtained (which is smaller than when both devices are below the false floor).
The behavior where both devices are above the false floor corresponds to an interference-prone scenario (in the next section we will further confirm the presence of other 802.11g sources) that suffers from“RF-pollution” (as discussed in [23]). This is causing a bias in the measurement of the RSSI values: only those packets successfully received are considered. Out of these measurements, therefore, we derive two main conclusions: (i) the false floor does provide FloorNet with some shielding from external sources, and (ii) for indoor testing one has to be cautious when relating RSSI and throughput.
3. Single Link Measurements
In this section we run extensive experiments to characterize the performance limits of the wireless links that can be used with FloorNet. To this aim, we first measure the achievable performance at each channel through 24 hour measurements for the maximum transmission power, and then we analyze the impact of the transmission power used on the throughput experienced by each link. The results obtained prove the variety of scenarios that can be emulated with FloorNet.
3.1. Impact of the Time of the Day. In order to calibrate the
testbed and check for possible interference sources which may affect the results presented in the following sections, we measure the performance obtained with both the 802.11g and 802.11a devices during a 24 hour period. The results from this analysis will be used to select the time frame in which our measurements are more protected from external interference.
First, we analyze the performance of a unidirectional wireless communication between two Linksys devices using 802.11g. To that aim, we use iperf to generate traffic from one desktop machine to the other desktop machine, using the wireless link between the devices R011 and R012 (see
Figure 1). The traffic generated consists of a UDP flow of
0 : 00 6 : 00 12 : 00 18 : 00 24 : 00 Time of the day
0 5 10 15 20 25
Thr
o
ug
hpu
t
(Mbps)
0 : 00 6 : 00 12 : 00 18 : 00 24 : 00 Time of the day
0 1 2 3 4 5
×103
1 2 3 4 5
6 7 8 9 10
11 12 13
Fr
am
es
Figure 5: Performance of 802.11g in our testbed for each available
channel.
35 Mbps, using frames of 1500 bytes during an interval of 30 seconds. In order to test every possible channel, after each 30 second sample the channel used is changed to the next one, using the full set of available channels in Spain which span from channel 1 to channel 13 (seeFigure 2).
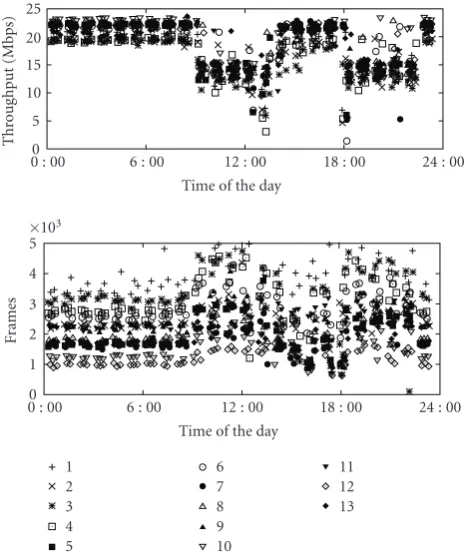
The results obtained are shown inFigure 5, where we plot the bandwidth obtained and the frames from other traffic sources observed during the experiment. The maximum theoretical achievable bandwidth for IEEE 802.11g and for a packet size of 1500 bytes is above 30 Mbps [22]. As shown in Figure 5, this maximum achievable bandwidth is never obtained.
Results from this test for a 24 hour time span can be summarized as follows.
(i) The achievable bandwidth varies between two dis-tinct states. The first state corresponds to bandwidth rates in the order of 20–25 Mbps, spanning between the nighttime up to 9 hours and between 14 hours and 18 hours. The second state corresponds to lower bandwidth rates, between 10 and 15 Mbps, spanning between 9 hours and 14 hours and between 18 hours and 21 hours.
(ii) In the fist state (from 21 hours to 9 hours and from 14 hours to 18 hours), the performance is quite stable. Note that the achieved bandwidth is approximately the same at night hours than from 14 hours to 18 hours. To relate performance to the influence of external interference sources, we also plot inFigure 5
0 : 00 6 : 00 12 : 00 18 : 00 24 : 00 Time of the day
28 29 30
Thr
o
ug
hpu
t
(Mbps)
0 : 00 6 : 00 12 : 00 18 : 00 24 : 00 Time of the day
0 2 4 6 8 10
Fr
am
es
36 40 44 48 52
56 60 64 100 104
108 112 116 120 124
128 132 136 140
Figure 6: Performance of 802.11a in our testbed for each.
ours. This graph shows how the number of frames detected is quite high, explaining the constant drop in performance across all the results, also showing how the number of frames is quite stable during night and slightly more unstable from 14 hours to 18 hours. This amount of interference is due to the fact of the testbed being deployed in a CS lab, where interference sources are always active, even at night, corresponding to the different ubiquitous WLAN networks of the building.
(iii) In the second state (from 9 hours to 14 hours and 18 hours to 21 hours) performance is quite unpre-dictable. During these periods of time, the number of frames from external sources increases, showing also the instability trend across all channels. We argue that this time period matches perfectly with the schedule of the undergrad students using the lab for research activities (e.g., Bluetooth devices): students arrive at 9 hours, working until lunch time (14 hours), and resuming after classes from 18 hours to 21 hours.
We conclude that the presence of external interference in the 2.4 GHz band is unavoidable, even for our testbed deployed under the false floor (that, as we saw inSection 2.4, provides some isolation).
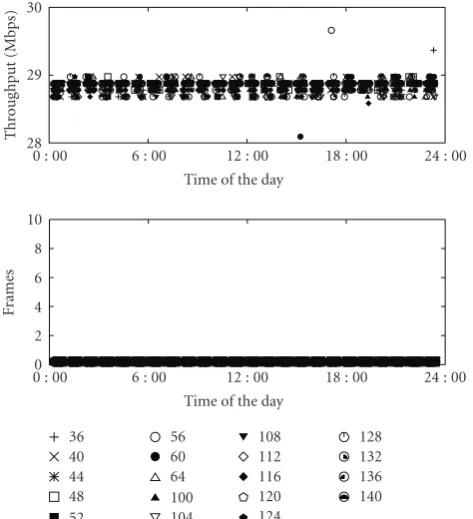
We next repeat the experiment but for the 802.11a case, using the Asus devices (R111, R112). The experimental methodology is exactly the same as for 802.11g but the channels used span between 36–64 and 100–140, as shown in
Figure 2. Results are given inFigure 6. As expected, 802.11a channels provide a better and more stable performance, since 802.11a is not commonly used in Spain and, furthermore,
20 40 60 80 100 120
Link no. 0
5 10 15 20 25 30
Thr
o
ug
hpu
t
(Mbps)
1 dBm 5 dBm 10 dBm
15 dBm 19 dBm
Figure 7: Impact of the transmission power on the connectivity of
the 802.11g testbed.
the false floor provides noticeable isolation. The results show an almost-constant achievable bandwidth of approximately 28.7 Mbps, while there are practically no frames from external sources.
We conclude that while results from 802.11a measure-ments do not depend on the time of the day, for the case of 802.11g “office hours” can introduce a significant bias. Therefore, the rest of 802.11g experiments is run during nighttime to lessen the impact of interference, while there is no need to careful plan 802.11a experiments (we note, however, that for some wireless experiments it may be useful to run experiments during working hours to, e.g., assess the sensibility of agiven protocol to interference).
3.2. Impact of the Transmission Power. One of the key
20 40 60 80 100 120 Link no.
0 5 10 15 20 25 30
Thr
o
ug
hpu
t
(Mbps)
5 dBm 9 dBm
13 dBm 17 dBm
Figure 8: Impact of the transmission power on the connectivity of
the 802.11a testbed.
−90 −80 −70 −60 −50 −40 −30 −20 RSSI
0 5 10 15 20 25
Thr
o
ug
hpu
t
(Mbps)
Figure 9: Relation between the obtained bandwidth and the
reported RSSI by the 802.11g devices.
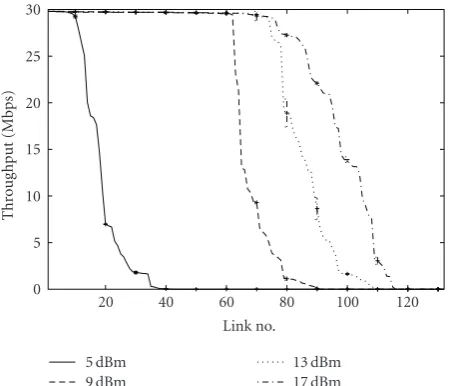
the results for 802.11a in Figure 8. Note that we plot the minimum and maximum values obtained every 10 links for clarity reasons.
Figure 7 shows that a high degree of connectivity is achieved in 802.11g even with the lowest transmission power. Actually, most of the results overlap, and changing the transmission power affects the performance of only about 30% of the links. This means that 802.11g, with its larger transmission range, does not support the creation of diverse layer 2 connectivity patterns in our testbed.
The situation in 802.11a, as shown inFigure 8, is very different. By using various transmission power levels we can modify the connectivity of different nodes in the testbed. Note that even at the maximum power not all the nodes are directly connected. Another important consideration is that the plot shows quite steep slopes, which means that by varying the transmission power we can easily change the state of several links, ranging from a no-connectivity
10 20 30 40 50 60 70
RSSI 0
5 10 15 20 25 30
Thr
o
ug
hpu
t
(Mbps)
Figure 10: Relation between the obtained bandwidth and the
reported RSSI by the 802.11a devices.
state to maximum performance throughput. Therefore, the main conclusion is that in our 802.11a testbed we can use the transmission power to set up different direct link connections between the nodes involved, enabling the generation of diverse multi-hop topologies (these results are consistent with the simulation study in [24] about the differences in coverage and bandwidth between 802.11a and 802.11g).
During the measurements we also sample the RSSI reported by the receiving device. Then we plot in Figure 9
(for 802.11g) and Figure 10 (for 802.11a) the relation between the bandwidth and the relative quality measure-ment. Both figures show that once a certain RSSI is achieved, we get the maximum bandwidth in the link, and therefore (because of the shielding provided by the false floor) it can be used to predict the link performance (as reported in [11]). In both cases the slopes are steep, so this confirms the previous conclusion that by varying the transmission power we can change from having no connectivity to a maximum throughput link. Another interesting consideration is that the dispersion in 802.11g is larger than in 802.11a; while in 802.11a, for a large range of values of RSSI we have a very stable high bandwidth, in 802.11g we have much more variation in the bandwidth achieved.
4. Two Links Measurements
In this section, we take advantage of our testbed to run extensive automatized experiments to analyze deployments where two different links are active at the same time. More specifically, as a use case of FloorNet we will aim at deriving a set of “configuration rules” in order to maximize the performance of multiple link scenarios. To that aim, we consider the following two possible scenarios, illustrated in
Figure 11.
RX04 RX08
RX01 i RX05
j Far links
R104 R108
R101 R105
i Close links j
Figure 11: Far links (top) and close links (bottom) scenarios.
CloseHere we have the opposite situation, the potentially interfering node is much closer than the receiver of the transmission.
Note that we are talking about relative distances between the sender, the intended receiver, and potential interferer(s). Still, in all cases the absolute distances between each pair of devices are substantially larger than the far-field threshold, to prevent close-field interference (as reported by, e.g., [25]). This far-field thresholddis given by [26]
d= 2D2
λ , (1)
whereDis the antenna diameter andλis the wavelength of the radio wave.
4.1. 802.11g—Far links. We first analyze, with our 802.11g devices, the case where the potential interfering source is far away, that is the scenario on the left side of Figure 11. We consider three different configurations, (a) both linksiandj are using channel 13, that is., channel distanced=0; (b) the
2 4 6 8 10 12 14 16 18
Tx power (dBm) Ri
single+Rjsingle
30 40 50
Thr
o
ug
hpu
t
(Mbps)
2 4 6 8 10 12 14 16 18
Tx power (dBm) Ri
both+Rjboth
15 20 25
Thr
o
ug
hpu
t
(Mbps)
d=0 d=5 d=10
Figure 12: 802.11g links: impact of the channel distance and
transmission power on the total throughput.
channels are configured at a distanced=5, more specifically, link i uses channel 13 and link j uses channel 8; (c) the configured channels are 13 and 3, respectively, resulting in a channel distanced=10. For each of these configurations we change the transmission power each device is using, from 1 dBm to 19 dBm in steps of 2 dBm, and measure four different throughput rates.
(i)Risingle(R
j
single): the bandwidth measured in linki(link
j) when only one link is active.
(ii)Riboth(R
j
both): the bandwidth measured in linki(link j) when the two links are active.
The above is repeated 5 times. We then plot inFigure 12
the sum of the bandwidth for both links when they are transmitting simultaneously (Riboth+ R
j
both) or at different
times (Ri
single + R
j
single), for the three different channel
separation scenarios (we also plot in the figure the minimum and maximum values measured). Note that the comparison of these two metrics is a proper estimation of the impact of the interference between the two links. Indeed, in absence of interference the two sums will take the same value, while in case the links interfere with each other, the sum of bandwidth rates will be smaller when both links are simultaneously active (Ri
both+R
j
both) than when they are not (Risingle+R
j
single).
From the results shown in Figure 12, we make the following observations.
5 6 7 8 9 10 Tx power (dBm)
15 16 17 18 19 20 21
Thr
o
ug
hpu
t
(Mbps)
Figure 13: Impact of the transmission power configured on the
performance of a single 802.11g link.
(ii) Both channels interfere, regardless of the configura-tion used. Note that ford=0 the assumed behavior would be a channel sharing of approximately 50% (depending on the capture effect and the efficiency of the CSMA/CA mechanism), and indeed this is approximately the case. Together, the sum of rates is approximately 18 Mbps, while in case they do not transmit at the same time the total throughput is around 40 Mbps.
(iii) On the other hand, the cases ofd = 5 andd = 10 are quite unexpected as nonoverlapping channels (see
Figure 2) are assumed to not interfere at far distances, but we find that instead they do severely interfere with each other (we repeated the experiment for different configuration of the channels used in links
i and j obtaining similar results).
Motivated by the “notch” at 7 dBm, we next extensively analyze the performance of a single link for different values of the transmission power used. To this aim, we run the 30-second UDP tests between two devices for a sweep of the values of the transmission power between 5 dBm and 10 dBm and repeat the experiment 10 times. The results of each mea-surement are depicted inFigure 13. Indeed, the figure shows that the Linksys devices introduce a drop in performance when using a transmission power close to 7 dBm: even the best performance out of 10 measurements for the 6, 7, 8 dBm values is well below the worst performance of the other values. Therefore, not only the Linksys devices interfere with each other when using non-overlapping channels, but also they can introduce a bias in performance depending on the values of the transmission power used.
The key conclusions that we draw from the above experiments using the off-the-shelf 802.11g equipment are: (i) the equipment suffers from severe interference, even when non-overlapping channels are used, and (ii) there is an unexpected drop in performance that depends on the trans-mission power used (we repeated the measurements using different pairs of Linksys devices and we obtained similar
6 8 10 12 14 16
Tx power (dBm) 0
10 20 30 40 50 60
Thr
o
ug
hpu
t
(Mbps)
d=0:Risingle+Rjsingle
d=0:Riboth+Rjboth
d=8:Risingle+Rjsingle
d=8:Riboth+Rjboth Figure 14: 802.11a links: impact of the channel distance and
transmission power on the total throughput.
performance. We also measured the reported RSSI values, and they did not show any relation with the transmission power used). Despite the fact that it is well known that multi-interface devices typically suffer from inter-card interference (see, e.g.,[25, 27, 28]), our results are indeed unexpected as devices are placed at distances larger than the far field threshold. Furthermore, we have not found in the literature any reference to this faulty performance that depends on the configured transmission power. These results, that constitute part of the main contributions of the paper, add to the growing evidence of deviations from expected behavior of off-the-shelf 802.11 devices (e.g., [18,29,30]).
Based on these results, as well as on the external interfer-ence in the 802.11g band that we observed in the experiment ofSection 3, we conclude that (at least with our equipment) 802.11g is not well suited to derive general configuration rules for the design of mesh networks. Following this conclusion, in the rest of the paper we focus on the 802.11a technology only.
4.2. 802.11a—Far links. Following the previous section, we next focus on understanding the impact of the interference in 802.11a when the potentially interfering nodes are relatively far away. To this aim, we first repeat the experiment reported above for 802.11a. The results of this experiment are plotted inFigure 14.
We can see from the figure that the behavior is quite different from the one observed with the 802.11g devices. In particular, we observe the following:
(i) First, the transmission power used does have a noticeable impact on the performance. Indeed, for 5 dBm the connectivity is quite poor, and only for 13 dBm the maximum throughput is reached. Note that this is quite in line with the results from
(ii) When there is no channel separation (d=0) and the transmission power is above 12 dBm, using both links at the same time results in a performance drop of approximately 50%, as the total throughput obtained is around 25 Mbps while the sum of the rates each link would obtain independently is approximately 58 Mbps.
(iii) For the case of complete channel separation (d = 8), we have the expected behavior that there is no interference between links, but only a negligible per-formance drop—due to the increased radio activity.
Therefore, as opposed to the 802.11g case, with 802.11a channels there is indeed a clear channel separation. In particular, a key conclusion is that the observed behavior
matches the expected theoretical one as there is no interference
among non-overlapping channels.
The above experiments focused on two channel separa-tion values, namely,d=0 andd=8. In order to gain insight into the performance with other distances (d= {0, 4, 8, 12}), we proceed as follows. We define the ratioηas the efficiency provided by a given channel separation (Note that these types of throughput ratios have been used before to estimate interference; see [31].)
η= R
i
both+R
j
both Ri
single+R
j
single
. (2)
Note that the above metric should be 1 in absence of interference and close to 0.5 in case of strong interference, corresponding to an equal sharing of the channel’s band-width. The results for η are shown in Figure 15, with the following observations.
(i) For frequencies separated a distanced=8 or larger, there is a small performance drop of approximately 2%, which confirms the previous result and shows that for this distance as well as any larger distances the interference between channels is negligible.
(ii) The use of channels that overlap (d = 4) leads to a performance drop of approximately 10% (η = 0.9). Despite it is obvious that overlapping channels should reduce the overall performance, this perfor-mance drop is quite small as compared tod=0. This shows that although there is some penalty paid by using overlapping channels, the resulting interference does not strongly impact the performance (this is a result that we will further explore inSection 5).
(iii) Finally, when there is no channel separation (d=0) the sensitivity of 802.11a to the received power results in a large dependence of η with the transmission power used, that ranges fromη=1 toη=0.4.
The last result for d = 0 is somehow surprising and deserves more attention. Indeed, while we could have expected a 50% penalty due to interference, in Figure 15
there is no loss of efficiency for the 7 dBm case. To further
6 8 10 12 14 16
Tx power (dBm) 0
0.2 0.4 0.6 0.8 1
η
d=0 d=4
d=8 d=12
Figure 15: Far links, 802.11a: impact of channel separation and
transmitted power on channel efficiency.
explore this result, we introduce the following fairness measurement:
φi=
Ri
both Ri
both+R
j
both
. (3)
With this ratio we are able to identify asymmetries in the links performance if results deviate from the reference value of 0.5 (i.e., both links get the same bandwidth). The results for the same configurations ofFigure 15are depicted inFigure 16. Indeed, with the aid ofφi it is possible to get
insights on channel performance.
(i) DespiteFigure 15shows that, regardless of the trans-mission power used, there is almost no loss inηfor distances d = {8, 12}, this result is deceiving: the values of φi in Figure 16 prove that until 13 dBm
linkjis getting most of the bandwidth. We conclude that below this power, link i is suffering from low radio conditions, and therefore those configurations should be avoided.
(ii) The use of overlapping channels (d = 4), again, provides better values than the case ofd = 0. For the former there is a slight asymmetry (around 0.45) at the maximum transmission power, while for the latter the best value is around 0.15. Therefore we conclude that, due to the sensitivity of 802.11a links to channel conditions, capture effect is quite common and any channel separation helps to lessen its effects. With the above, we have seen that with the use of η andφi it is possible to assess the performance of different
8 10 12 14 16 Tx power (dBm)
0 0.1 0.2 0.3 0.4 0.5
φi
d=0 d=4
d=8 d=12
Figure 16: Far links, 802.11a: impact of channel separation and
transmitted power on throughput.
6 8 10 12 14 16
Tx power (dBm) 0
5 10 15 20 25 30
Thr
o
ug
hpu
t
(Mbps)
η
d=0:Ri
both
d=0:Rj
both
d=4:Ri
both
d=4:Rj
both
Figure 17: Impact of channel separation and transmitted power on
bandwidth share.
apparently suffer from asymmetric radio link conditions and perform the following experiment. We set a transmission power of 17 dBm on the link that obtained the smallest share of bandwidth (the weak link) and perform a sweep on the transmission power of the other link (the strong link), measuring the bandwidth each link obtains when both are active at the same time. The results are depicted inFigure 17. The results confirm that the observed asymmetry is due to the different channel conditions, as the links experience the same throughput only for different transmission power. For the case of d = 0, this occurs when the second link is using approximately 8 dBm that is, the difference in the transmission power is around 9 dB (despite the physical deployment is quite similar for the two pairs of routers). On the other hand, for the case ofd = 4 instead
8 10 12 14 16
Tx power (dBm) 0
0.1 0.2 0.3 0.4 0.5 0.6 0.7 0.8 0.9 1
η
d=0 d=4
d=8 d=12
Figure 18: Close links, 802.11a: impact of channel separation and
transmitted power on channel efficiency.
8 10 12 14 16
Tx power (dBm) 0
0.1 0.2 0.3 0.4 0.5 0.6
φi
d=0 d=4
d=8 d=12
Figure 19: Close links, 802.11a: impact of channel separation and
transmitted power on bandwidth share.
of a single point there is a range of transmission power (approximately, 7–11 dBm) that leads to similar bandwidth performance. Therefore, for this setting, a careless power configuration provides the best performance using non-overlapping channels, while this requirement can be relaxed if the transmission power is carefully tuned. We will revisit this claim inSection 5.
could be that it is the only possible configuration). To that aim, we consider the “close links” scenario ofFigure 11and compute the values forηandφi for different values of the
transmission power, with the results shown in Figures18and
19.
For the case of completely separated channels (d = {8, 12}), it is clear that the results show a similar behavior to the far links case. However, when there is partial overlapping (d = 4) or no channel separation at all (d = 0), there are significant differences between the two cases.
(i) With close links, there is some additional perfor-mance loss as compared to the far links case when there is no channel separation (d=0). In particular, the η values obtained are smaller than for the far links scenario starting from 7 dBm when both links are active. The explanation for this behavior is the fact that the capture effect does not help to improve
performance but rather it worsens it: in case of a collision, the “surviving” frame will be the one from the closest sender; that is, the one from the interferer (and therefore will be discarded by the non-intended receiver).
(ii) In addition to the above, we further observe that with close links we obtain better fairness, with a φi value that almost reaches 0.4 for the maximum
transmission power. This is explained by the fact that having both frames discarded in case of a collision helps to improve the fairness.
(iii) On the other hand, the use of partially overlapped channels does not have the same benefits as in the far links scenario. Indeed, while in the far links case we had an efficiency of η > 0.9, in this case the overall efficiency also drops approximately to 50%. Furthermore, this reduction comes also with a performance drop ofφi, that while inFigure 16could
reach valuesφi≥0.4, for this case they do not deviate
significantly from 0.2.
From the experiments reported in this section we conclude that with the use of the 802.11g devices there is little to gain from a careful deployment and parameter tuning, since we have a degraded performance regardless of the configuration of these parameters. However, 802.11a devices follow the expected behavior and substantially benefit from careful planning and therefore pave the way for the analysis and design of optimal configuration strategies. In fact, we have just seen that for the case of two links configuration, depending on the relative distances between nodes, some configurations might be worth exploring like, for example, tuning the transmission power to save channel spectrum in the far links scenario.
5. Multihop Measurements
Armed with the results from the previous single and two links experiments, we now address the case of an 802.11a multihop wireless mesh. To that aim, we configure the routing tables of
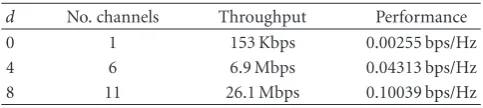
Table 2: Spectrum efficiency of each configuration.
d No. channels Throughput Performance
0 1 153 Kbps 0.00255 bps/Hz
4 6 6.9 Mbps 0.04313 bps/Hz
8 11 26.1 Mbps 0.10039 bps/Hz
the desktop machines and the routers to build the topology illustrated inFigure 20that consists of up to 6 wireless hops. Note that the maximum performance achievable should be bounded by the best performance obtained for the case of single 802.11a links, that is, approximately 29 Mbps (see, e.g.,
Figure 6).
Next, we first assess the impact of channel configuration in that scenario. To that aim, we run a 30-second UDP test between the desktop machines through the 6 wireless hops and measure the bandwidth at the end of each hop. We initially do this for the following three different “na¨ıve” channel allocation strategies (all of them with the transmission power always set to 17 dBm):
(i)d = 0: in this case, all the links use the same channel; because of the resulting interference, we do not expect the performance of this configuration to be optimal.
(ii)d = 4: for this strategy, the first wireless link is configured on channel 100, the next wireless hop uses channel 104 and so on, until channel 120 is assigned on the last 802.11a hop. Note that with this configuration there is partial overlapping between consecutive links. Therefore, also for this case, the performance may be far from the maximum achievable value.
(iii)d= 8: in this resource-aggressive strategy, each link is configured on non-overlapping channels, with no frequency overlap or reuse. Note that for this last case, the only limiting factor is—at least, in principle—the ability of the 802.11a devices to forward traffic from the wired to the wireless interface, and therefore we would expect to achieve maximum performance.
The results for the above three approaches are shown in
Figure 21. We observe that, as expected, the most spectrum consuming approach (d=8) provides the best performance with 26.1 Mbps. The partially overlapping configuration (d = 4) shows quite a poor performance, around 25% of the maximum achieved performance. Furthermore, the approach that uses the same channel for all links (d = 0) leads to almost null throughput. Note that this last result confirms the finding of [32], which observed that throughput drops to zero in a single-channel scenario. This is caused because the first station occupies the channel all the time without giving the second station any channel time, and therefore traffic gets stacked at the second station (which matches indeed with the results that we get inFigure 21).
R104 R108
R103 R107
R102 R106
R101 R105 R109 R111
R110 R112
Figure 20: Multihop scenario.
1 2 3 4 5 6
Hop no. 0
5 10 15 20 25 30 35
Thr
o
ug
hpu
t
(Mbps)
d=0 d=4 d=8
Figure 21: Performance of multihop, 802.11a, 17 dBm.
terms of bps/Hz provided by each approach. According to the results obtained, we observe that the non-overlapping approach (d = 8) not only provides the best performance in terms of throughput, but also in terms of spectral efficiency. Therefore, for these “na¨ıve” configurations where the transmission power is set to the maximum value, we conclude that there is little motivation for the reuse of parts of the spectrum. However, motivated by the results from
Section 4.2, as well as the previous work considering multi-WLAN deployments [33, 34], we also want to assess if a more careful adjustment of transmission power and channel allocation can lead to a performance improvement. In partic-ular, we investigate if, by using a less nave strategy to adjust transmission power and to choose the channel frequency, a better spectral efficiency for thed = 4 configuration (i.e.,
1: Configure the transmission to transverse only link 1. 2: Set channel 100 on link 1
3: Search on the{TxPower}values for the best throughput
4: Configure link 1 with the best TxPower found in Step 3.
5: for Link #ifrom 2 to 6 do
6: Configure the routing to also transverse linki
7: for Channel∈ {100, 104, 108, 112, 116, 120}do
8: for TxPower∈ {8, 11, 14, 17}dBm do 9: Save the channel and TxPower that provides
the best performance
10: end for
11: end for
12: Set linkito use the best channel and TxPower 13: end for
Algorithm 1: Heuristic for the configuration of the multihop
scenario.
using a total of 6 channels) can be achieved. To that aim, we have designed the heuristic described inAlgorithm 1. Note that the heuristic reduces the search space by configuring each link in a hop-by-hop approach, and therefore we are aiming at a configuration that, although suboptimal, requires affordable configuration time (an exhaustive search for this scenario would require running experiments for more than 20 days).
nave approach ford = 4. The achieved throughput is 19.1 Mbps, resulting in an efficiency of approximately 0.11938 bps/Hz which represents an improvement of about 10% as compared to the completely non-overlapping approach (i.e., thed=8 case inTable 2). From this and the previous results of this section, we draw the following key conclusions.
(i) Using nonoverlapping channels yields the maximum achievable throughput since interference is com-pletely avoided. Even though this strategy is the one that uses more spectrum, it is nonetheless the one that gives the best spectrum efficiency unless a careful planning of the channel assignment and transmission powers is followed.
(ii) With careful planning, gains in spectrum efficiency of up to about 10% can be achieved by using partially overlapping channels. However, this gain requires substantial planning effort, and unless this effort is made, a better strategy is to use nonoverlapping channels.
6. Lessons Learned
In this section, we enumerate the most important lessons learned from the design, deployment, and usage of FloorNet. We divide these lessons in two different categories: (i) those mostly related to the deployment of the testbed, and (ii) those related to the results from experimental tests.
6.1. Testbed Deployment. It is feasible to install and operate 802.11-based mesh testbeds under false floors. The first and
most important result is that it is possible to deploy wireless 802.11 testbeds under the false floor, and indeed they constitute a valuable research asset. For instance, we demonstrate inSection 5how the testbed is used to evaluate a channel configuration algorithm.
802.11 indoor testbeds suffer from interferences, both
intra-(i.e., neighboring wireless networks) and intertechnology (e.g., Bluetooth). This is particularly evident for the case of 802.11b/g WLANs that operate in the overpopulated 2.4 GHz band.
External interference measurement or estimation is crucial to understand experimental results. Along with the devices
used to perform a given experiment, the deployment of a parallel infrastructure to monitor all the activity in the channel is helpful to understand possible deviations from the expected results.
The false floor provides shielding from external radio sources, which is particularly convenient for the crowded
2.4 GHz band. Despite we believe that the physical protection from the false floor is enough motivation to deploy testbeds like FloorNet, this comes with the added benefit of partial radio isolation.
Careful node placement is crucial. The distance between
antennae/nodes has to be larger than the far-field threshold to avoid near-field unpredictable effects, which are hard to identify. These issues arise not only for devices using the same physical layer, but also when using 802.11g and 802.11a devices.
Off-the-shelf routers have very limited resources. Note that
this has huge impact on (and therefore conditions) the types of tests and measurements that can be conducted in a testbed. For instance, these routers are not powerful enough to generate, process, and/or forward frames at some traffic rates.
Wiring also deserves some attention. We found that
using cheap Ethernet switches (like common 5 to 8-port home switches) causes unexpected performance drops, such as intermittent disconnections or throughput bottlenecks. Therefore, instead of using cheap switches it is better to spend the money on wiring and use high-performance switches with star-alike topologies.
Avoid performing simultaneous tests. Even if the network
is partitioned and the devices are physically distant from each other, still there are a few sources of measurement bias. For instance, desktop machines, typically equipped with 100 Mbps Fast Ethernet cards, cannot generate more than approximately 90 Mbps of traffic (depending on the frame size) and therefore cannot saturate more than three 802.11a/g links.
Periodic soft rebooting of the testbed is useful. Off -the-shelf devices are more prone to software bugs and hardware problems, thus their uptimes are typically short, and after some days operating under stressing conditions (e.g., at full forwarding speed) they start to malfunction or even halt. Therefore, it is recommended to perform a soft reboot between series of tests.
Be careful when changing wireless settings, since some
particular combinations of the, for example, iwconfig command may not result in the desired configuration. It is therefore very important to verify applied changes and to identify conflicting settings.
Do not always use the same SSID. It is better to use different network names every time a new test is initiated or a new network has to be created. Using always the same SSID might cause that several stations remain joined to an old network or rejoin it despite a change of frequency, leading to unexpected problems.
6.2. Operation Results. For indoor testing and using COTS devices, it is more convenient to use 802.11a than 802.11g, to generate diverse multihop topologies. By changing the
transmission power, the connectivity of some links can be controlled, thus allowing for the generation of diverse multihop topologies without the need of using additional specialized hardware (attenuators) like [35]. Without these, with 802.11g, all the testbed is within one hop radio coverage, even for the minimum transmission power.
Asymmetries in bandwidth sharing are quite common and hard to predict. Therefore, conducting fairness measurements
is critical to understand performance results deviating from the expected ones. The capture effect is quite common in real
deployments [36] and it is one of the main reasons of these anomalies. Only through a careful setting of the transmission power these asymmetries can be lessened.
Single-channel wireless multihop networks provides very low throughput. Note that the throughput obtained in our
RoofNet [7], despite we are using a physical layer with higher transmission rates. It is therefore critical to use different channels and to reuse frequencies when possible.
Using non-overlapping channels provide the most efficient use of the spectrum. Despite for some configurations a careful
setting of the transmission power can improve the efficiency, the complexity required does not seem to be worth the benefits.
7. Summary
In this paper we have presented FloorNet, a novel wireless mesh testbed deployed under the false floor that is based on commercial off-the-shelf equipment. We have analyzed and assessed its unique characteristics, that we believe constitute strong support for the deployment of these type of testbeds. First, the false floor provides the testbed with physical protection, a feature that saves a lot of time because of, for example, the absence of wire disconnections. We believe that this feature itself constitutes a major reason for the deployment of testbeds like ours. Second, despite the relatively small size of the deployment, we claim that it is a valuable research tool for both the 802.11g and the 802.11a cases. For the case of 802.11g, it constitutes a physically stable research platform to run experiments under the presence of interfering sources. For the case of 802.11a the connectivity of the testbed can be easily controlled through a proper adjustment of the transmission power, supporting the creation of a large variety of scenarios.
Along with the description and assessment of the features of our testbed, we have also conducted extensive measurements to derive configuration guidelines for wireless mesh networks, which further validate the usefulness of our testbed. One of the major findings is the nonideal behavior of off-the-shelf hardware, as seen in both (i) the impact of the entity generating traffic in the measurements, and in (ii) the strong interference between (assumed) non-overlapping channels. We have also identified, by means of experimen-tation in different scenarios, in which circumstances it is possible to optimize the transmission power to, for example, achieve channel fairness or improve the spectrum efficiency.
Acknowledgments
The authors would like to thank the anonymous reviewers for their comments to improve the paper. They thank also Francisco Ramos and Miguel Flores for their support in setting up the testbed infrastructure. The research leading to these results has received funding from the European Com-munity’s Seventh Framework Programme (FP7/2007-2013) under Grant agreement no.214994 (CARMEN project). It was also partly funded by the Ministry of Science and Inno-vation of Spain, under the QUARTET project (TIN2009-13992-C02-01), and the National Science foundation under Project ECE EEC-0313747 001.
References
[1] R. Draves, J. Padhye, and B. Zill, “Routing in multi-radio, multihop wireless mesh networks,” in Proceedings of the 10th
Annual International Conference on Mobile Computing and Networking, pp. 114–128, ACM, New York, NY, USA, 2004.
[2] H. Lundgren, K. Ramachandran, E. Belding-Royer, et al., “Experiences from the design, deployment, and usage of the UCSB MeshNet testbed,” IEEE Wireless Communications, vol. 13, no. 2, pp. 18–29, 2006.
[3] V. Navda, A. Kashyap, and S. Das, “Design and evaluation of iMesh: an infrastructure-mode wireless mesh network,” in Proceedings of the 6th IEEE International Symposium on a
World of Wireless Mobile and Multimedia Networks (WoWMoM ’05), pp. 164–170, 2005.
[4] J. De Bruyne, W. Joseph, L. Verloock, and L. Martens, “Eval-uation of link performance of an indoor 802.11g network,” in Proceedings of the 5th IEEE Consumer Communications and
Networking Conference (CCNC ’08), pp. 425–429, January
2008.
[5] P. Serrano, A. De La Oliva, C. J. Bernardos, I. Soto, A. Banchs, and A. Azcorra, “A CARMEN mesh experience: deployment and results,” in Proceedings of IEEE Workshop on Hot Topics in
Mesh Networking (HotMESH ’09), June 2009.
[6] J. Camp, J. Robinson, C. Steger, and E. Knightly, “Measure-ment driven deploy“Measure-ment of a two-tier urban mesh access network,” in Proceedings of the 4th International Conference on
Mobile Systems, Applications and Services (MobiSys ’06), pp.
96–109, ACM, New York, NY, USA, 2006.
[7] D. Aguayo, J. Bicket, S. Biswas, G. Judd, and R. Morris, “Link-level measurements from an 802.11b mesh network,” ACM
SIGCOMM Computer Communication Review, vol. 34, no. 4,
pp. 121–132, 2004.
[8] Y. Takahashi, Y. Owada, H. Okada, and K. Mase, “A wireless mesh network testbed in rural mountain areas,” in Proceedings
of the 2nd ACM International Workshop on Wireless Network Testbeds, Experimental Evaluation and Characterization (WiN-TECH ’07), pp. 91–92, ACM, New York, NY, USA, 2007.
[9] K. Chebrolu and B. Raman, “FRACTEL: a fresh perspective on (rural) mesh networks,” in Proceedings of the ACM SIGCOMM
Workshop on Networked Systems for Developing Regions (NSDR ’07), August 2007.
[10] D. Gokhale, S. Sen, K. Chebrolu, and B. Raman, “On the feasibility of the link abstraction in (rural) mesh networks,” in Proceedings of the 27th IEEE Communications Society
Conference on Computer Communications (INFOCOM ’08),
pp. 61–65, April 2008.
[11] B. Raman and K. Chebrolu, “Experiences in using WiFi for rural internet in India,” IEEE Communications Magazine, vol. 45, no. 1, pp. 104–110, 2007.
[12] D. Gupta, P. Mohapatra, and C.-N. Chuah, “Efficient monitor-ing in wireless mesh networks: overheads and accuracy trade-offs,” in Proceedings of the 5th IEEE International Conference
on Mobile Ad-Hoc and Sensor Systems (MASS ’08), pp. 13–23,
2008.
[13] Y.-C. Cheng, J. Bellardo, P. Benk¨o, A. C. Snoeren, G. M. Voelker, and S. Savage, “Jigsaw: solving the puzzle of enterprise 802.11 analysis,” ACM SIGCOMM Computer Communication
Review, vol. 36, no. 4, pp. 39–50, 2006.
[14] X. Li, R. Stewart, S. Murphy, E. Fallon, A. Hanley, and S. Roy, “Performance evaluation of Meraki wireless mesh networks,” in Proceedings of the 7th Annual Information Technology and
Telecommunications Conference (IT&T ’07), p. 156, 2007,
general chairs letter.
[16] K.-H. Kim and K. G. Shin, “On accurate measurement of link quality in multi-hop wireless mesh networks,” in Proceedings of
the 12th Annual International Conference on Mobile Computing and Networking (MOBICOM ’06), pp. 38–49, Association for
Computing Machinery, New York, NY, USA, 2006.
[17] T. He, S.-H. G. Chan, and C.-F. Wong, “HomeMesh: a low-cost indoor wireless mesh for home networking,” IEEE
Communications Magazine, vol. 46, no. 12, pp. 79–85, 2008.
[18] P. Serrano, M. Zink, and J. Kurose, “Assessing the fidelity of COTS 802.11 sniffers,” in Proceedings of the 28th IEEE
Com-munications Society Conference on Computer ComCom-munications (INFOCOM ’09), pp. 1089–1097, April 2009.
[19] F. Fainelli, “The OpenWrt embedded development frame-work,” in Proceedings of the Free and Open Source Software
Developers European Meeting, 2008.
[20] M. Lacage, M. H. Manshaei, and T. Turletti, “IEEE 802.11 rate adaptation: a practical approach,” in Proceedings of the
7th ACM Symposium on Modeling, Analysis and Simulation of Wireless and Mobile Systems (MSWiM ’04), pp. 126–134, ACM,
New York, NY, USA, 2004.
[21] C. J. Bernardos, I. Soto, and A. Banchs, “IEEE 802.11 standards,” in Medium Access Control in Wireless Networks, Nova Science, New York, NY, USA, 2008.
[22] M. Bredel and M. Fidler, “A measurement study of bandwidth estimation in IEEE 802.11g wireless LANs using the DCF,” in Proceedings of the 7th International IFIP-TC6 Networking
Conference, vol. 4982 of Lecture Notes in Computer Science, pp.
314–325, 2008.
[23] B. Raman, K. Chebrolu, D. Gokhale, and S. Sen, “On the feasibility of the link abstraction in wireless mesh networks,”
IEEE/ACM Transactions on Networking, vol. 17, no. 2, pp. 528–
541, 2009.
[24] A. Doufexi, S. Armour, B.-S. Lee, A. Nix, and D. Bull, “An evaluation of the performance of IEEE 802.11a and 802.11g wireless local area networks in a corporate office environment,” in Proceedings of IEEE International Conference
on Communications (ICC ’03), vol. 2, pp. 1196–1200, 2003.
[25] C.-M. Cheng, P.-H. Hsiao, H. T. Kung, and D. Vlah, “Par-allel use of multiple channels in multi-hop 802.11 wireless networks,” in Proceedings of IEEE Military Communications
Conference (MILCOM ’06), pp. 1–9, 2006.
[26] C. Balanis, Antenna Theory and Design, John Wiley & Sons, New York, NY, USA, 1996.
[27] J. Robinson, K. Papagiannaki, C. Diot, X. Guo, and L. Krishnamurthy, “Experimenting with a multi-radio mesh networking testbed,” in Proceedings of the 1st workshop on
Wireless Network Measurements (WiNMee ’05), Riva del Garda,
Italy, April 2005.
[28] P. Fuxj¨ager, D. Valerio, and F. Ricciato, “The myth of non-overlapping channels: interference measurements in IEEE 802.11,” in Proceedings of the 4th Annual Conference on Wireless
on Demand Network Systems and Services (WONS ’07), pp. 1–
8, 2007.
[29] G. Bianchi, A. Di Stefano, C. Giaconia, L. Scalia, G. Terrazzino, and I. Tinnirello, “Experimental assessment of the backoff behavior of commercial IEEE 802.11b network cards,” in
Proceedings of IEEE Communications Society Conference on Computer Communications (INFOCOM ’07), pp. 1181–1189,
2007.
[30] D. Giustiniano, G. Bianchi, L. Scalia, and I. Tinnirello, “An explanation for unexpected 802.11 outdoor link-level measurement results,” in Proceedings of the 27th IEEE
Com-munications Society Conference on Computer ComCom-munications (INFOCOM ’08), pp. 2432–2440, April 2008.
[31] J. Padhye, S. Agarwal, V. Padmanabhan, L. Qiu, A. Rao, and B. Zill, “Estimation of link interference in static multi-hop wireless networks,” in Proceedings of the 5th ACM SIGCOMM
Conference on Internet Measurement, p. 28, USENIX
Associa-tion, 2005.
[32] A. Aziz, D. Starobinski, and P. Thiran, “Elucidating the instability of random access wireless mesh networks,” in
Proceedings of the 6th Annual IEEE Communications Society Conference on Sensor, Mesh and Ad Hoc Communications and Networks (SECON ’09), pp. 1–9, June 2009.
[33] I. Broustis, K. Papagiannaki, S. V. Krishnamurthy, M. Falout-sos, and V. Mhatre, “MDG: measurement-driven guidelines for 802.11 WLAN design,” in Proceedings of the 13th Annual
International Conference on Mobile Computing and Networking (MOBICOM ’07), pp. 254–265, ACM, New York, NY, USA,
2007.
[34] V. P. Mhatre, K. Papagiannaki, and F. Baccelli, “Interference mitigation through power control in high density 802.11 WLANs,” in Proceedings of IEEE Communications Society
Conference on Computer Communications (INFOCOM ’07),
pp. 535–543, 2007.
[35] Y. Su and T. Gross, “Validation of a miniaturized wireless network testbed,” in Proceedings of the 3rd ACM International
Workshop on Wireless Network Testbeds, Experimental Evalua-tion and CharacterizaEvalua-tion (MOBICOM ’08), pp. 25–32, ACM,
New York, NY, USA, 2008.