I
I
n
n
t
t
e
e
r
r
n
n
a
a
t
t
i
i
o
o
n
n
a
a
l
l
J
J
o
o
u
u
r
r
n
n
a
a
l
l
o
o
f
f
B
B
i
i
o
o
l
l
o
o
g
g
i
i
c
c
a
a
l
l
S
S
c
c
i
i
e
e
n
n
c
c
e
e
s
s
2010; 6(4):382-395 © Ivyspring International Publisher. All rights reserved Research Paper
E2F-1 binding affinity for pRb is not the only determinant of the E2F-1
ac-tivity
Fikret Sahin
1, 2,, Todd L. Sladek
1, 31. Department of Microbiology and Immunology, Finch University of Health Sciences/Chicago Medical School (now Ro-salind Franklin University), 3333 Green Bay Road, North Chicago, Illinois 60064-3095, USA
2. Current address: Microbiology Department, School of Medicine, Ankara University, Sihhiye-Ankara, Turkey 3. Current address: 3802 Sagamore Drive, Greensboro, NC 27410, USA
Corresponding author: Fikret Şahin, MD. PhD., Microbiology Department, School of Medicine, Ankara University, Basic Science Buildings, 3rd floor, Sihhiye-Ankara, Turkey 06100. Home: 011 90-312 491 1951; Cell phone: 0535 721 2043;
[email protected]; Fax: 011 90- 312 310 6370
Received: 2010.04.12; Accepted: 2010.07.02; Published: 2010.07.04
Abstract
E2F-1 is the major cellular target of pRB and is regulated by pRB during cell proliferation. Interaction between pRB and E2F-1 is dependent on the phosphorylation status of pRB. Despite the fact that E2F-1 and pRB have antagonistic activities when they are overexpressed, the role of the E2F-1-pRB interaction in cell growth largely remains unknown. Ideally, it would be better to study the properties of a pRB mutant that fails to bind to E2F, but retains all other activities. To date, no pRB mutation has been characterized in sufficient detail to show that it specifically eliminates E2F binding but leaves other interactions intact. An alternative approach to this issue is to ask whether mutations that change E2F proteins binding affinity to pRB are sufficient to change cell growth in aspect of cell cycle and tumor formation. Therefore, we used the E2F-1 mutants including E2F-1/S332-7A, E2F-1/S375A, E2F-1/S403A, E2F-1/Y411A and E2F-1/L132Q that have different binding affinities for pRB to better understand the roles of the E2F-1 phosphorylation and E2F-1-pRB interaction in the cell cycle, as well as in transformation and gene expression. Data presented in this study suggests that in vivo phosphorylation at amino acids 332-337, 375 and 403 is important for the E2F-1 and pRB interaction in vivo. However, although E2F-1 mutants 332-7, 375 and 403 showed similar binding affinity to pRB, they showed different characteristics in transformation efficiency, G0 accumulation, and target gene experiments.
Key words: E2F-1, Rb, Cell cycle, cmyc, dhfr, TK, cdc2
1. Introduction
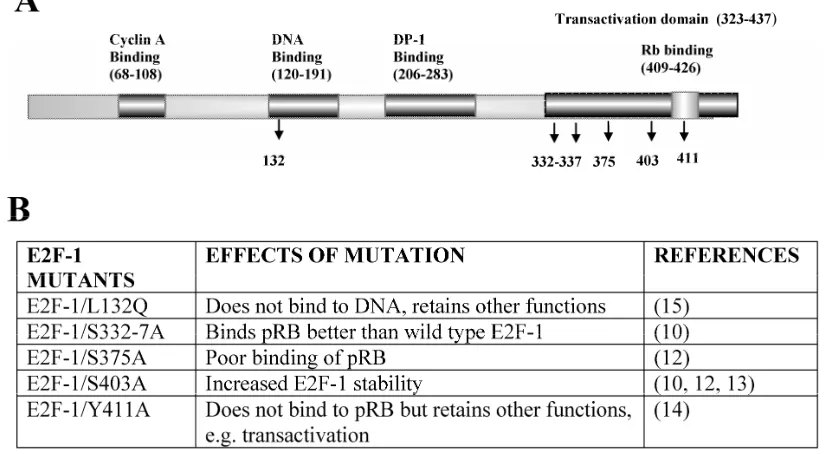
The E2F family of transcription factors play a critical role in cell proliferation control [1, 2]. pRB was defined as the major cellular target of and revealed the regulation of E2F activity [3, 4]. Studies showed that E2F binds to the pocket domain of pRB [5]. The pRB-binding domain on the E2F-1 molecule is located at the C-terminus and is close to the transactivation domain. The C-terminal domain is required for effi-cient pRB/E2F interaction and its functional
activity of surrounding transcription factors on the promoters [9]. The balance between these two activi-ties in vivo is still in question.
An ideal study to investigate the role of the E2F-1-pRB interaction in cell growth would be to study the properties of a pRB mutant that fails to bind to E2F, but retains all other activities. However, many of the pRB-binding proteins interact with similar re-gions of pRB and the commonly used tumor–derived mutant alleles encode proteins that fail to interact with multiple pRB-binding proteins. To date, no pRB mutation has been characterized in sufficient detail to show that it specifically eliminates E2F binding but leaves other interactions intact. An alternative ap-proach to this issue is to ask whether mutations that change E2F proteins binding affinity to pRB are suffi-cient to change cell growth in aspect of cell cycle and tumor formation. Therefore we used the E2F-1 mu-tants including E2F-1/S332-7A, E2F-1/S375A, E2F-1/S403A, E2F-1/Y411A and E2F-1/L132Q that have different binding affinities for pRB to better un-derstand the roles of the E2F-1 phosphorylation and E2F-1-pRB interaction in the cell cycle, as well as in transformation and gene expression. E2F-1 mutants and their previously known characteristics were shown in Fig. 1. Studies have shown that
phosphory-lation of E2F-1 in vitro on serine residues 332 and 337
prevented its binding to pRB, and mutation of these serine residues increased E2F-1 binding to pRB [10]. Phosphorylation of E2F-1 on serines 332 and 337 was
shown to increase in cells in the late G1 phase of the
cell cycle. Late G1 is when pRB becomes
phosphory-lated and subsequently releases E2F bound to it [11]. Therefore, phosphorylation of E2F-1 on serines 332 and 337, as well as phosphorylation of pRB, could assist in dissociation of the pRB/E2F-1 complex in the
late G1 phase. In contrast, others have shown that
phosphorylation of E2F-1 in vitro on serine 375
pro-motes binding of E2F-1 to pRB, and serine to alanine mutation of this residue decreased the E2F-1 binding to pRB [12]. Another mutant is E2F-1/S403A [10]. Peptide mapping of E2F-1/S403A did not reveal any changes in phosphorylation compared to the map of E2F-1/wt [12]. Interestingly, it has been shown in another study that site 403 is also phosphorylated and this phosphorylation increases the E2F-1 degradation [13]. Mutation S403A increased the stability of the E2F-1. The binding of the E2F-1/S403A mutant to pRB was found to be same as E2F-1/wt pRB binding in the yeast two-hybrid system [12]. An E2F-1 mutant has been described in which tyrosine 411 has been re-placed with alanine. This mutation inhibited E2F-1’s
binding to pRB in a two-hybrid yeast system and in
vivo [14]. Although the site of mutation is within the transactivation domain of E2F-1, it did not change E2F-1’s full transcriptional potential. Another mutant is E2F-1/L132Q. The mutant no longer binds to DNA, but retains other activities such as pRB binding and transactivation [15]. In these experiments, however,
effects of these mutants, in vivo binding to pRB,
alte-ration of the cell cycle phenotype and tumor forma-tion, were not reported.
In this study, we showed that in vivo phospho-rylation at amino acids 332-337, 375 and 403 is im-portant for the E2F-1 and pRB interaction. However, although E2F-1 mutants 332-7, 375 and 403 showed similar binding affinity to pRB, they showed different
characteristics in transformation efficiency, G0
accu-mulation, and target gene experiments. More impor-tantly, findings suggest that free E2F-1 provides the tumor cells with a growth advantage beyond simply
shortening G1.
2. Materials and Methods
2.1. Cells and virusesψ-CRE, a murine fibroblast cell line was used in
these experiments [16]. The cells were grown in DMEM supplemented with 5% (vol/vol) fetal bovine
serum and 5% calf serum in a 5% CO2 atmosphere at
370C [17]. Retroviral vector, Linker Neo CMV E2F-1
was used to express E2F-1/wt and E2F-1/mutant genes as described below. Linker Neo CMV E2F-1 is identical to Linker CMV T [18] except that the large T antigen gene from simian virus 40 was replaced by a cDNA, approximately 1326 bps long, encoding E2F-1/wt [19] and E2F-1 mutants [8, 12, 15]. Mutant cDNAs including E2F-1/S332-7A, E2F-1/S375A, and E2F-1/S403A [12] were obtained from Dr. A. Zante-ma, mutant E2F-1/L132Q [15] was obtained from Dr. J. R. Nevins and E2F-1/Y411A [8] was obtained from Dr. K. Helin. pX17 is a retroviral vector [20], similar to Linker Neo CMV E2F-1, encodes the neomycin resis-tance gene but does not encode E2F-1 gene. pX17 was used as negative control in the experiments. To pro-duce infectious virus, the recombinant plasmids en-coding Linker Neo CMV E2F-1s were transfected to-gether with helper virus containing vector (SV-A-MLV-env) which encoded genes needed to complement the linker virus, but did not encode whole virus [21], into Cos-7 packaging cells using the calcium-phosphate transfection method [18]. Two to three days later, virus containing medium was col-lected from these cells and used to infect established
ψ-CRE murine cell lines [17]. E2F-1 wt and E2F-1
mutants expressing cells used in the experiments were chosen from at least 5 different CRE cell lines for each of individual E2F-1. Each cell lines were pre-pared from the different retroviral infection experi-ments and cell clones were pooled from cells growing in the presence of G418. All the experiments including cell cycle analysis, transformation and gene expres-sion analysis were run simultaneously from the same group of cells.
2.2. Immunoblotting
To prepare cell-free extracts, an equal number of cells were split into dishes. Nearly confluent dishes of cells were washed with sterile TBS (10 mM Tris [pH 8.0], 50 mM NaCl), and then lysed by addition of 1 ml of lysis buffer (50 mM Tris [pH 8.0], 5 mM EDTA, 150 mM NaCl, 0.5% NP-40, 1 mM PMSF and 0.01 mg of aprotinin per ml [22] to the cell monolayer. Cells were scraped from the dishes into microfuge tubes and incubated on ice for 30 min with inversion. Lysed cells
were centrifuged at 11,150 x g for 10 min at 40C to
remove cell debris. The total extract volume was
de-termined, and frozen in aliquots at -700C. In addition
to the plate of cells used to make extracts, an identical plate was trypsinized and the cells counted to deter-mine cell number. In this way a volume of extract corresponding to a given cell number could be
ana-lyzed by SDS-PAGE. Extract prepared from 4x10⁴ cells
was used. From the previous studies, it is known that overexpression of E2F-1 decreases the cell size. Therefore we used the cell number to equilibrate the individual cell extracts on immunoblots. To this lume of extract was added one-sixth of the total vo-lume of loading buffer (48 mM Tris [pH 6.8], 18.5%
SDS, 3.94 M β-mercaptoethanol, 31% glycerol and 3%
bromophenol blue) and the mixture was boiled for 3 min. Proteins were analyzed by SDS-PAGE using 10% gels [23].
2.3. Antibodies
The antibody used in immunoblotting for detec-tion of E2F-1, was rabbit anti-human E2F-1 (C-20), polyclonal antibody (Santa Cruz Biotechnology; Santa Cruz, CA). The secondary antibodies used in immu-noblotting were horseradish peroxidase conjugated sheep anti-mouse (Sigma) and donkey anti-rabbit (Amersham), which were used for reaction with mo-noclonal and polyclonal primary antibodies, respec-tively. The antibodies used for immunoprecipitation of E2F-1 and pRb were KH95 (Santa Cruz Biotech-nology) and G3-245 (Pharmingen; San Diego, CA) monoclonal antibodies, respectively. All these anti-bodies have been shown to react with mouse proteins.
2.4. Soft agar assays
Five or ten thousand cells were plated in 1 ml of top agar composed of DMEM supplemented with 5% fetal bovine serum and 5% calf serum and containing 0.38% Noble agar [24]. This suspension was seeded into 35-mm diameter dishes over a 2 ml layer of soli-dified bottom agar containing DMEM and 0.5% Noble agar. Dishes were maintained at 37°C in a humidified
5% CO2 atmosphere. After 3 weeks, colonies were
either photographed or counted. For photomicro-graphs, dishes were stained with p-iodonitrotetrazolium violet [25] and photographed. For counting, colonies were visualized with a micro-scope using low power magnification and those greater than 50 µm in diameter were counted. Six mi-croscope fields per dish were counted and used to calculate the total number of colonies on the entire dish (based on dish surface area). Colony counts were obtained from four dishes each cell line for per expe-riment [26]. The data are expressed as the means of counts from five independent experiments.
2.5. Cell cycle synchronization
To synchronize cells by serum starvation, 5 x 10⁵
cells were seeded into 10-cm dishes. Forty-eight hrs later, cells were washed with PBS and DMEM sup-plemented with 0.5% fetal bovine serum was then added. After 60 h, cells were stimulated into the cell cycle by addition of complete medium (DMEM sup-plemented with 5% (vol/vol) fetal bovine serum and 5% calf serum). Samples for total RNA preparation and flow cytometry were collected at time 0 and ap-propriate intervals thereafter as indicated.
2.6. Flow cytometry
To analyze cellular DNA content, cells were
fixed and stained [27] [24]. Briefly, 106 trypsinized
cells were washed three times with PBS and then fixed
by incubation with 50 μl of 0.125% paraformaldehyde
at 370C for 5 min. Then 450 μl of ice-cold methanol
was added to the sample. The fixed cells were washed three times with 0.1% Triton X-100 in PBS and treated with RNase A (0.04 Kunitz units) for 30 min. The cells
were then stained with 50 μg of propidium iodide per
ml. Cell analysis was performed using a Coulter EPICS Elite EPS flow cytometer (Coulter Electronics; Miami, FL). Excitation used the 488-nm line of an ar-gon laser operating at 100 mW. Red fluorescence was collected above 570 nm. A doublet discriminator (peak versus integrated red signal) was used as the primary gate to eliminate cell aggregates. Red fluo-rescence was displayed on a linear scale. The fraction
of the total cell population present in each of the G1, S
and G2/M cell cycle phases was obtained from DNA
histograms by mathematical modeling using MPLUS software (Phoenix Flow Systems; San Diego, CA [18].
2.7. Immunoprecipitation
Immunoprecipitations were performed using 300 µg of cell-free extract prepared as described in the immunoblotting procedure. The extracts were prec-leared by incubation with Protein G Plus-/Protein A-Agarose beads (Oncogene Science; Uniondale, NY) that had been treated with BSA. The BSA-treated beads were prepared by incubating Protein G Plus-/Protein A-Agarose beads on a rotating platform in lysis buffer containing 1% BSA at 4°C for 2 h. The BSA-treated beads were then washed twice in lysis buffer and added to the cell-free extract. The extract containing the BSA-treated beads was incubated at 4°C for 3 h on a rotating platform. Beads were then removed from the extracts by centrifugation at 3150 x g for 5 min at 4°C. E2F-1 or pRB was immunopreci-pitated from precleared extracts by adding 2 µg of specific antibodies and 20 µl of BSA treated Protein G Plus-/Protein A-Agarose beads [24]. This mixture was incubated for 15 h and centrifuged as described above. The immune complexes were washed 4 times with lysis buffer and then analyzed by SDS-PAGE and immunoblotted as described above.
2.8. Total RNA isolation
2.9. Primers used in the MRT-PCR
All primers for E2F-1 target genes were designed with the Primer3: WWW primer tool program
(http://biotools.umassmed.edu/bioapps/primer3_www.cgi)
and are described previously [24]. Primers were made by IDT, Inc. (Coralville, IA).
2.10. Semiquantitative Multiplex RT-PCR
Multiplex RT-PCR was performed using Pro-mega’s Access RT-PCR system [24]. Importantly, RT-PCR was used first to determine the linear range of target genes. Second, the linear range of the internal
standard was determined using β-actin and β-actin
competimer (QuantumRNA β-actin internal
stan-dards, Ambion). Conditions for MRT-PCR were
op-timized after determining the β-actin and β-actin
competimer ratio. PCR cycles were optimized so that the target gene would be in the linear range. Reactions contained AMV-RT and Tfl DNA polymerase, AMV/Tfl Reaction Buffer, dNTP mix, specific
up-stream and downup-stream primers, β-actin and β-actin
competimer primers, MgSO4, and RNA template. The
PCR machine was programmed as follows: 480C for 45
min to synthesize first strand cDNA; 940C for 2 min to
denature template; 940C 45 sec for denaturation; at
600C for 45 sec for annealing; and 680C for 1 min for
extension. The PCR products were run in a 1.5% aga-rose gel and the gel was stained with EtBr. EtBr sig-nals were analyzed by computer assisted densitome-try.
3. Results
3.1. Overexpression of E2F-1/wt and E2F-1/mutant genes in
ψ-CRE cell line
We used the mouse fibroblast ψ-CRE cell line
because it has the highest amount of pRB protein among the cell lines C3H10T1/2, BALB/c-3T3 and NIH 3T3 (data was not shown) we evaluated. We es-tablished 7 cell lines using retroviral vectors that overexpress the control pX17 (the retroviral vector with no insert, negative control), E2F-1/wt (positive control), or E2F-1/mutants that have different bind-ing affinities for pRB. E2F-1 mutants and their pre-viously known characteristics were shown in Fig. 1.
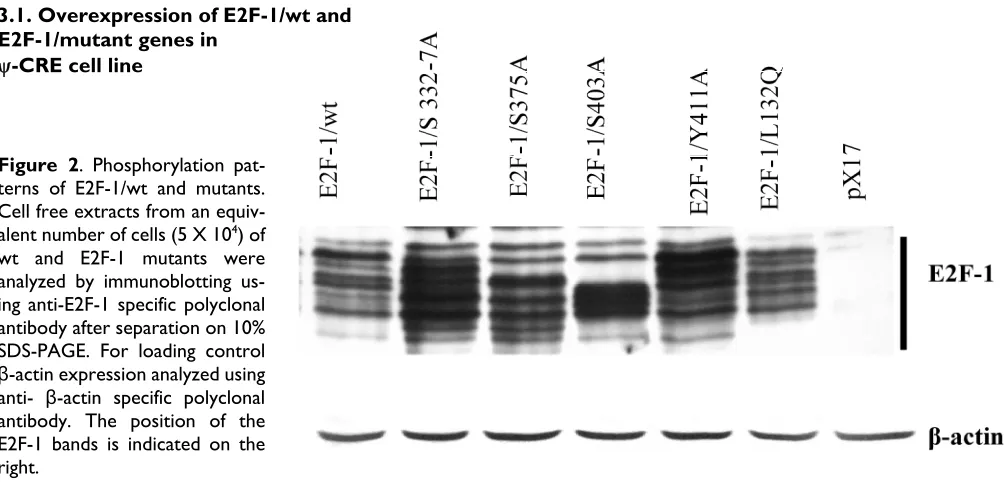
Since the phenotypes produced by any given E2F-1 are likely to depend on the amount of E2F-1 expressed, it was necessary to compare the cells that expressed E2F-1 at roughly equivalent levels. There-fore individual E2F-1 wt and each E2F-1 mutant was chosen from at least 5 different CRE cell lines for each of individual E2F-1 such that all chosen cell lines had approximately equivalent levels of E2F-1. Fig. 2 shows the chosen cell lines expressing E2F-1. These cell lines were called E2F-1/wt, E2F-1/S332-7A, E2F-1/S375A, E2F-1/S403A, E2F-1/Y411A and E2F-1/L132Q. In addition, pX17 viruses containing cells were used as control. Each cell lines were prepared from the dif-ferent retroviral infection experiments and cell clones were pooled from cells growing in the presence of G418. All the experiments including cell cycle analy-sis, transformation and gene expression were run si-multaneously from the same group of cells. The cell lines shown in Fig. 2 were used for the remaining ex-periments of this manuscript.
Figure 2. Phosphorylation pat-terns of E2F-1/wt and mutants. Cell free extracts from an equiv-alent number of cells (5 X 10⁴) of wt and E2F-1 mutants were analyzed by immunoblotting us-ing anti-E2F-1 specific polyclonal antibody after separation on 10% SDS-PAGE. For loading control
3.2. E2F-1 overexpressing cells show different phenotypic characteristics
Microscopic examination of E2F-1 overexpress-ing cells in cell culture showed some different cha-racteristics. Some E2F-1 overexpressing cells were much larger than normal and contained more than one nucleus. Multiple nuclei are characteristic of transformed cells [28, 29]. All the E2F-1 overexpress-ing cell lines were multinucleated to varyoverexpress-ing degrees. However, it was most striking in cells overexpressing the E2F-1/S332-7A and E2F-1/Y411A mutants (Fig. 3).
3.3. The E2F-1/wt and E2F-1/mutants showed banding patterns dependent on phosphorylation
Previously we showed that E2F-1/wt could be separated into a series of different bands by SDS-PAGE. These bands were shown to be differen-tially phosphorylated forms of E2F-1 [30]. Similar to these results, this study confirmed that immunoblot analysis of cell extracts from the overexpressing E2F-1/wt cells displayed 8-10 different E2F-1 bands that reacted with the anti-E2F-1 specific antibody. E2F-1 mutants except E2F-1/L132Q used in this study showed different banding patterns than those of E2F-1/wt (Fig. 2). Some of E2F-1 mutants also showed 8-10 bands. However, the density distribution of E2F-1/mutants’ bands was different than that of the E2F-1/wt.
3.4. Interaction between E2F-1/wt or E2F-1/mutants and pRB
As mentioned previously in introduction part, the E2F-1 mutant pRB interactions were mostly
de-scribed in vitro and in the yeast two-hybrid system.
Therefore it would be important to show E2F-1
mu-tants pRB binding in cell. To test in vivo affinity of the
E2F-1 mutant proteins for pRB, E2F-1 was immuno-precipitated from extracts made from asynchronously growing E2F-1/wt or E2F-1/mutant cell lines using an anti-E2F-1-specific antibody. The immunoprecipi-tated proteins were then divided into two equal ali-quots. One aliquot of the immunoprecipitated pro-teins was blotted onto nitrocellulose membranes fol-lowing resolution by SDS-PAGE and then probed with an anti-E2F-1 specific antibody. The other aliquot was treated similarly and then probed with an
an-ti-pRB specific antibody. In this way, it was possible to determine the amount of pRB co-immunoprecipitated with E2F-1, relative to the total amount of E2F-1 present in each of the cell lines (Fig. 4).
After the E2F-1/wt/pRB binding ratio was normalized to 1, we observed that E2F-1/S332-7A/pRB and E2F-1/S403A/pRB binding increased approximately 3-fold compared to that of E2F-1/wt-pRB binding (Fig. 4). E2F-1/S375A/pRB binding increased approximately 2.5-fold to that of E2F-1/wt/pRB binding. E2F-1/Y411A/pRB binding, on the other hand, decreased approximately 4-fold in comparison to E2F-1/wt/pRB binding. The E2F-1/L132Q/pRB binding ratio was found to be essentially equal to the E2F-1/wt/pRB binding ratio as expected.
3.5. Transformation of cells overexpressing E2F-1/wt or E2F-1/mutants
As shown previously, overexpression of E2F-1 increase the transformation of cell, therefore we aimed to see how E2F-1 mutants would change the transformation efficiency [26, 31].
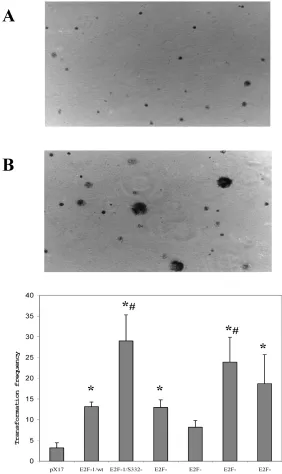
Since anchorage-independent growth of fibrob-last correlates highly with tumor formation in animals [32], anchorage-independent growth of E2F-1 over-expressing cells was tested by plating the cells in soft agar medium and assaying the ability of the cells to form colonies. Fig. 5 A and B shows
mi-crograph of control (pX17) and the E2F-1 overexpressing cells after growth in soft agar for three weeks. The micrographs show that E2F-1 overexpressing cells formed colonies in soft agar and were therefore capable of proliferating in an an-chorage-independent manner.
All the E2F-1 expressing cell lines (E2F-1/wt and E2F-1/mutants), except the
E2F-1/S403A mutant, showed significant increases in transformation, compared to the control (pX17) cell line. The mutants E2F-1/S332-7A and E2F-1/Y411A showed a significant increase from the E2F-1/wt overexpressing cell line. The E2F-1/S375A and E2F-1/L132Q mutants overexpressing cell lines showed a significant difference in colony number compared to the mock control, but no difference compared to E2F-1/wt overexpressing cells. The E2F-1/S403A mutant did not significantly increase the transformation frequency compared to control (pX17) (Fig. 5).
Figure 5. Representative soft agar fields de-monstrating colony formation by transformed cells. Cells were plated in soft agar medium, stained and photographed as described in ma-terials and methods. Colonies greater than 50
3.6. The E2F-1/wt and E2F-1/mutants change G0/G1 checkpoint controls.
Overexpression of E2F-1 in cells alters cell growth regulation, as reported previously [2]. In this
study, the G0/G1 phase accumulation of the different
E2F-1 mutants was determined by using flow cyto-metric analysis.
All of the E2F-1 mutants, except E2F-1/L132Q, showed significantly less
ac-cumulation in G0, compared to the control (pX17)
cells. Furthermore, E2F-1/Y411A and E2F-1/S403A
showed less accumulation in G0/G1 as compared to
E2F-1/wt expressing cells (Fig. 6). However, the other E2F-1 mutants were not significantly different from the E2F-1/wt cells.
Figure 6. Cell cycle analysis of cell lines expressing E2F-1 mu-tants. A. Cells were starved in 0.5% FBS for 60 hours, at which time the first samples were taken to measure the G0 value of the different E2F-1 mutants and wt. Cells are fixed with methanol, treated with RNAse, stained with propidium iodide, and then ana-lyzed by flow cytometry. DNA histograms were analyzed by the program Mplus. The x-axis shows the DNA content and the y-axis shows cell number. B. Number of E2F-1/wt or E2F-1/mutant over-expressing cells in G0/G1 phase. Values are mean ± S.E.M., n=3, *P< 0.05 compared to control
3.7. Effects of E2F-1/wt or E2F-1/mutants on target gene expression
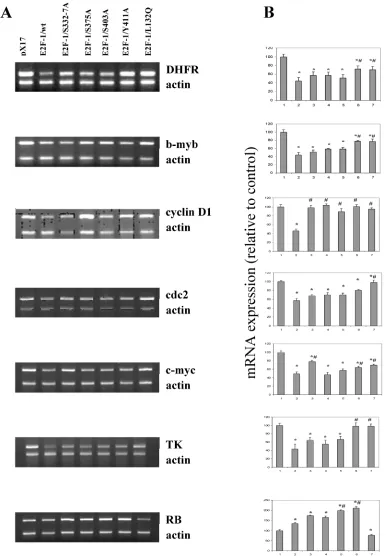
It seems likely that the different phenotypic changes that occur in the mutants are a result of changes produced by alterations in the expression of E2F-1 target genes. E2F-1 target genes, such as RB, c-myc, b-myb, DHFR, TK, cdc2, cyclin D and others, are important cell cycle regulators. Therefore effects of E2F-1 mutants on target gene expression were com-pared to E2F-1/wt and control (pX17) using semi-quantitative Multiplex RT-PCR.
Results obtained from the asynchronized proli-ferating cells showed that, overall, endogenous E2F-1 target genes, including DHFR, b-myb, cyclin D1, cdc2, c-myc, TK and RB, were deregulated in E2F-1/wt and mutants overexpressing cells (Fig. 7). Based on the results obtained, although not all of them are statisti-cally significant, the expression levels of genes in-cluding the DHFR, b-myb, cdc2, c-myc, cyclinD1 and TK were showed similar result and were less re-pressed in cell lines overexpressing E2F-1/S332-7A, E2F-1/S375A, E2F-1/S403A, E2F-1/Y411A and E2F-1/L132Q compared to the expression of the same genes in the cell lines overexpressing E2F-1/wt. The expression of cyclinD1 in all cells expressing E2F-1 mutants are statistically less repressed compared to the cell expressing E2F-1/wt. In addition to cyclin D1, the expression of the DHFR, b-myb, c-myc in the cells expressing E2F-1/Y411A or E2F-1/L132Q is less re-pressed statistically compared to E2F-1/wt and the expression of the cdc2 in the cells expressing E2F-1/L132Q is less repressed statistically compared to E2F-1/wt.
Very different results were observed with RB expression (Fig. 7) than those described for the other target genes, which showed lowered expression in cells overexpressing E2F-1 compared to the control (pX17). RB expression was significantly higher in the E2F-1/wt and E2F-1/mutants except in the E2F-1/L132Q as compared to controls. Fig. 7 shows that RB expression increased about two-fold in the cells overexpressing E2F-1/S403A and E2F-1/Y411A compared to that of controls. They were also signifi-cantly higher than the RB expression in cells overex-pressing E2F-1/wt. The most interesting results were obtained with the E2F-1/L132Q, which is the only mutant in which RB expression is lower than that of the control.
4. Discussion
The structural consequences of E2F-1 phospho-rylation are currently unknown. However from this
data it is suggested that phosphorylation induces conformational changes resulting in the promotion of E2F-1-pRB interaction. Ser-332-337, ser-375 and ser-403 are not in the minimal domain of E2F-1 that is necessary and sufficient to interact with pRB. This makes it unlikely that phosphorylation is merely act-ing to sterically change the interaction with pRB. Thus, the regulatory effects of phosphorylation of these residues must act at a distance. Together these facts suggest that changes in phosphorylation affect the affinity of E2F-1 for pRB via conformational changes.
The interaction between E2F-1 and pRB changed with different E2F-1 mutants. Data presented in this
study suggests that in vivo phosphorylation at amino
acids 332-337, 375 and 403 is important for the E2F-1 and pRB interaction. Contrary to previous report [12], the E2F-1/S375A and E2F-1/S403A mutants bound more pRB compared to E2F-1/wt as measured in immunoprecipitation assays (Fig. 4). This discrepancy may arise from the fact that the previous experiments
were done in vitro using extracts from insect cells
ex-pressing E2F-1 and a pRB GST fusion protein. Indeed, it has been shown that site 403 is also phosphorylated and this phosphorylation increases the E2F-1 degra-dation in another experiment [13]. Mutation of phos-phorylation site S403 increased the stability of the E2F-1. Morever, it was shown that E2F-1 is stabilized by its interaction with pRB [33]. Therefore, it is rea-sonable to think that increased affinity of mutant 403 to pRB increases the stability of 403 mutant.
The cell cycle and transformation efficiency re-sults for the E2F-1/Y411A mutant could be predicted and correlated well with known information. For example, it was shown earlier that its overexpression in the cell pushes the cell into S phase more efficiently compared to E2F-1/wt [14]. The same result was found in this study. Its binding affinity to pRB was
also found to be in agreement with earlier in vitro
studies. Transformation efficiency results were also well correlated with the result of cell cycle and E2F-1/Y411A pRB-binding experiments in this study. Therefore, free E2F-1, unbound to pRB, increased S
phase entry and transformation of ψ-CRE cell. These
results provided direct evidence for the biological significance of the E2F-1 and E2F-1/pRB interaction for proper cell cycle and tumor formation.
higher transformation efficiency compared to the pX17 in this study similar to previous study done in melanocytes [34], it did not show the expected result for the cell cycle. For example, overexpression of E2F-1/L132Q did not significantly push the cell into S phase more than control (Fig. 6). Therefore, it is in-teresting to consider the possibility that free E2F-1 provides the tumor cells with a growth advantage
beyond simply shortening G1. This idea is also
sup-ported by the target gene expression results, which is described in the following paragraphs.
Data also shows that although E2F-1 mutants 332-7, 375 and 403 showed similar binding affinity to pRB, they showed different characteristics in
trans-formation efficiency, G0/G1 accumulation, and target
gene experiments. Interestingly, the E2F-1/S332-7A mutant was more efficient in transforming cells than E2F-1/wt. Another interesting result was seen in the E2F-1/S403A mutant. Although the E2F-1/S403A mutant binds pRB as efficiently as the E2F-1/S332-7A mutant, it did not show an increase in transformation efficiency. Unexpectedly, the E2F-1/S403A mutant
showed less accumulation in G0 than the E2F-1/wt.
This finding was inconsistent with very low E2F-1/S403A transformation efficiency. Although there is no clue to explain these phenotypic changes with the known effects of mutants, it might be possi-ble to explain these different characteristics to some degree with the results from the target gene experi-ments. For example, c-myc oncogene expression was the least repressed in the E2F-1/S332-7A mutant ex-pressing cells that produced one of the greatest numbers of transformed colonies. In the E2F-1/S403A expressing cells, RB gene expression was higher than that E2F-1/wt, which may be one of the reasons for having the lowest rate of transformation. It is worth mentioning that the E2F-1 target genes are not limited to those we checked in this study [35]. Therefore, it is possible that some other target genes might be af-fected by the alteration of RB expression or by other target genes causing some unexpected phenotypic changes.
The changes in target gene expression by the different mutants can be explained to some degree by the context of pRB binding to the particular E2F-1’s. For example, RB expression increased in E2F-1/wt overexpressing cell lines compared to that of control. In the same cell lines, all target gene expression, in-cluding DHFR, b-myb, cdc-2, c-myc, cyclin D1 and TK were repressed compared to the control. Therefore, high amounts of E2F-1 and RB repressed expression of many of the target gene. This explanation will be more meaningful when the higher DNA binding af-finity of E2F-1/pRB complex compared to free E2F-1
and increased stability of E2F-1/pRB is considered [33, 36].
However, it is not possible to use the same rea-soning to explain the effects of the E2F-1/S332-7A, E2F-1/S375A and E2F-1/S403A mutants. E2F-1/S332-7A, E2F-1/S375A and E2F-1/S403A overexpression increased RB expression more than that E2F-1/wt. Furthermore, it was shown that the E2F-1/S332-7A, E2F-1/S375A, E2F-1/S403A mutants bind pRB better than the E2F-1/wt binds to pRB in this study (Fig 4). Following the reasoning used above; there should be more E2F-1/pRB complexes on the target gene promoter and more repression on the target gene compared to the cells overexpressing E2F-1/wt. However, the opposite was found. There-fore, in addition to pRB regulation on target gene promoter, some other factor must be effecting the target gene promoter. For example, Previous studies have shown that phosphorylation of E2F-1 changes its binding to DNA [37]. Similarly, it would be possible that mutation on E2F-1/S332-7A, E2F-1/S375A and E2F-1/S403A might affect E2F-1-DNA binding, and subsequently transcription. It is also possible that since the mutation of Serine sites 332-7, 375 and 403 is in the transactivation domain of E2F-1, which may change activation directly. Difference of the effects of mutant E2F-1, such as E2F-1/S403A increase RB ex-pression more than E2F-1/S332-7A and 375 might be also related with the conformational changes of indi-vidual mutants.
The target gene expression results present an interesting and unexpected result. For example, overexpression of E2F-1/wt increased the transfor-mation efficiency, however target genes expression known that related with cell proliferation or tumuro-genesis including c-myc, b-myb, cyclin D1, cdc2 and TK were decreased. Surprisingly, pRB, a tumor sup-pressor protein, expression level was increased. This result might suggest two things: first, there might be other target genes that have a more decisive role on the tumor formation other than what we studied. Second, exogenous E2F-1 induces transformation di-rectly independent of its target genes. However, both suggestions are unlikely since the target genes we checked are well known oncogenes and regulated by E2F-1 as shown in this study (Fig. 7). Recently, we showed that E2F-1 acts in different ways, not only depending on the target gene but also depending on different stages of the cell cycle. For example, E2F-1 acts as part of the repression complex with pRB in the expression of DHFR, b-myb, TK and cdc2 in asyn-chronously growing cells; on the other hand, E2F-1 acts as an activator in the expression of the same genes in cells that are re-entering the cycle [24]. Therefore, cell cycle dependent activity of the E2F-1 might be the main determinant of growth regulation of the target genes followed by tumor formation.
Abbreviations
E2F: Early-Region-2 Transcription-Factor-1; Rb: Retinoblastoma.
Conflict of Interest
There are no conflicts of interest and financial
disclosure in the subjectmatter of our paper.
References
1. Iaquinta PJ, Lees JA. Life and death decisions by the E2F tran-scription factors. Curr Opin Cell Biol 2007,19:649-657.
2. Muller H, Helin K. The E2F transcription factors: key regulators of cell proliferation. Biochim Biophys Acta 2000,1470:M1-12. 3. Stengel KR, Thangavel C, Solomon DA, Angus SP, Zheng Y,
Knudsen ES. RB/p107/130 pocket proteins: Protein dynamics and interactions with target gene promoters. J Biol Chem 2009;284(29):19265-71.
4. Sun A, Bagella L, Tutton S, Romano G, Giordano A. From G0 to S phase: a view of the roles played by the retinoblastoma (Rb) family members in the Rb-E2F pathway. J Cell Biochem 2007,102:1400-1404.
5. Welch PJ, Wang JY. Disruption of retinoblastoma protein func-tion by coexpression of its C pocket fragment. Genes Dev 1995,9:31-46.
6. Hiebert SW, Blake M, Azizkhan J, Nevins JR. Role of E2F tran-scription factor in E1A-mediated trans activation of cellular genes. J Virol 1991,65:3547-3552.
7. Black AR, Azizkhan-Clifford J. Regulation of E2F: a family of transcription factors involved in proliferation control. Gene 1999,237:281-302.
8. Helin K, Harlow E, Fattaey A. Inhibition of E2F-1 transactiva-tion by direct binding of the retinoblastoma protein. Mol Cell Biol 1993,13:6501-6508.
9. Sellers WR, Rodgers JW, Kaelin WGJr. A potent transrepression domain in the retinoblastoma protein induces a cell cycle arrest when bound to E2F sites. Proc Natl Acad Sci U S A 1995,92:11544-11548.
10. Fagan R, Flint KJ, Jones N. Phosphorylation of E2F-1 modulates its interaction with the retinoblastoma gene product and the adenoviral E4 19 kDa protein. Cell 1994,78:799-811.
11. Emili A, Ingles CJ. Promoter-dependent photocross-linking of the acidic transcriptional activator E2F-1 to the TATA-binding protein. J Biol Chem 1995,270:13674-13680.
12. Peeper DS, Keblusek P, Helin K, Toebes M, van der Eb AJ, Zantema A. Phosphorylation of a specific cdk site in E2F-1 af-fects its electrophoretic mobility and promotes pRB-binding in vitro. Oncogene 1995,10:39-48.
13. Vandel L, Kouzarides T. Residues phosphorylated by TFIIH are required for E2F-1 degradation during S-phase. Embo J 1999,18:4280-4291.
14. Shan B, Durfee T, Lee WH. Disruption of RB/E2F-1 interaction by single point mutations in E2F-1 enhances S-phase entry and apoptosis. Proc Natl Acad Sci U S A 1996,93:679-684.
15. Cress WD, Johnson DG, Nevins JR. A genetic analysis of the E2F1 gene distinguishes regulation by Rb, p107, and adenovi-rus E4. Mol Cell Biol 1993,13:6314-6325.
16. Danos O, Mulligan RC. Safe and efficient generation of recom-binant retroviruses with amphotropic and ecotropic host ranges. Proc Natl Acad Sci U S A 1988,85:6460-6464.
17. Sladek TL, Jacobberger JW. Rapid titration of retroviral vectors encoding intracellular antigens by flow cytometry. J Virol 1990,64:3135-3138.
18. Sladek TL, Jacobberger JW. Dependence of SV40 large T-antigen cell cycle regulation on T-antigen expression levels. Oncogene 1992,7:1305-1313.
19. Helin K, Lees JA, Vidal M, Dyson N, Harlow E, Fattaey A. A cDNA encoding a pRB-binding protein with properties of the transcription factor E2F. Cell 1992,70:337-350.
20. Sladek TL, Jacobberger JW. Simian virus 40 large T-antigen expression decreases the G1 and increases the G2 + M cell cycle phase durations in exponentially growing cells. J Virol 1992,66:1059-1065.
21. Landau NR, Littman DR. Packaging system for rapid produc-tion of murine leukemia virus vectors with variable tropism. J Virol 1992,66:5110-5113.
22. Kierstead TD, Tevethia MJ. Association of p53 binding and immortalization of primary C57BL/6 mouse embryo fibroblasts by using simian virus 40 T-antigen mutants bearing internal overlapping deletion mutations. J Virol 1993,67:1817-1829. 23. Laemmli UK. Cleavage of structural proteins during the
as-sembly of the head of bacteriophage T4. Nature 1970,227:680-685.
24. Sahin F, Sladek TL. E2F-1 has dual roles depending on the cell cycle. Int J Biol Sci, 2010;6:116-128.
25. Jat PS, Cepko CL, Mulligan RC, Sharp PA. Recombinant retro-viruses encoding simian virus 40 large T antigen and polyo-mavirus large and middle T antigens. Mol Cell Biol 1986,6:1204-1217.
26. Yang XH, Sladek TL. Overexpression of the E2F-1 transcription factor gene mediates cell transformation. Gene Expr 1995,4:195-204.
28. Kellokumpu-Lehtinen P, Soderstrom KO, Kortekangas A, Nordman E. Ultrastructural effects of irradiation on squamous cell carcinoma of the head and neck. Cancer 1989,63:1108-1118. 29. Nakano T, Oka K. Transition of Ki-67 index of uterine cervical
tumors during radiation therapy. Immunohistochemical study. Cancer 1991,68:517-523.
30. Yang XH, Sladek TL. Novel phosphorylated forms of E2F-1 transcription factor bind to the retinoblastoma protein in cells overexpressing an E2F-1 cDNA. Biochem Biophys Res Com-mun 1997,232:336-339.
31. Johnson DG, Cress WD, Jakoi L, Nevins JR. Oncogenic capacity of the E2F1 gene. Proc Natl Acad Sci U S A 1994,91:12823-12827. 32. Barrett JC, Crawford BD, Mixter LO, Schechtman LM, Ts'o PO, Pollack R. Correlation of in vitro growth properties and tumo-rigenicity of Syrian hamster cell lines. Cancer Res 1979,39:1504-1510.
33. Hateboer G, Kerkhoven RM, Shvarts A, Bernards R, Beijers-bergen RL. Degradation of E2F by the ubiquitin-proteasome
pathway: regulation by retinoblastoma family proteins and adenovirus transforming proteins. Genes Dev 1996,10:2960-2970.
34. Halaban R, Cheng E, Zhang Y, Mandigo CE, Miglarese MR. Release of cell cycle constraints in mouse melanocytes by overexpressed mutant E2F1E132, but not by deletion of p16INK4A or p21WAF1/CIP1. Oncogene 1998,16:2489-2501. 35. Muller H, Bracken AP, Vernell R, et al. E2Fs regulate the
ex-pression of genes involved in differentiation, development, proliferation, and apoptosis. Genes Dev 2001,15:267-285. 36. Campanero MR, Flemington EK. Regulation of E2F through
ubiquitin-proteasome-dependent degradation: stabilization by the pRB tumor suppressor protein. Proc Natl Acad Sci U S A 1997,94:2221-2226.
37. Sugarman JL, Schonthal AH, Glass CK. Identification of a cell-type-specific and E2F-independent mechanism for repres-sion of cdc2 transcription. Mol Cell Biol 1995,15:3282-3290.
Figures
Figure S1. Densitometry analysis of the immunoblot of the wilt type and mutant E2F-1s. Immunoblot of wilt type and mutant E2F –1s were analyzed by computer assisted densitometry analyzes. X axis shows the molecular weight of the protein, Y-axis shows optic density of the individual bands.
Figure S2. Equivalent amount cell free extracts from of the cell lines were analyzed by immunoblotting using anti-pRb specific polyclonal antibody after separation on 10% SDS-PAGE. The position of the pRb and actin bands is indicated on the right.
pRb
β
-actin
C3H10T
1/2
ψ
-CRE
BA
LB/
c-3T3
NI
H 3T