Available online on 15.06.2019 at http://jddtonline.info
Journal of Drug Delivery and Therapeutics
Open Access to Pharmaceutical and Medical Research© 2011-18, publisher and licensee JDDT, This is an Open Access article which permits unrestricted non-commercial use, provided the original work is properly cited
Open Access
Research Article
Formulation and Evaluation of Extended Release Floating Matrix Tablet of
Eperisone Hydrochloride by Direct Compression Method
Ekta
1*, Priyanshi Jain
1, Shailesh Jain
1, Mohammed Azaz Khan
21 Patel College of Pharmacy, Ratibad, Bhabdhada Road Bhopal (MP) 462044
2 Pinnacle Biomedical Research Institute (PBRI), Bharat Scout and Guides Campus, Shanti Marg, Shamla Hills, Bhopal (MP) 462003
ABSTRACT
Increased complications and costs of marketing of innovative drugs focused greater attention to the development of sustained release (SR) or controlled release (CR) drug delivery systems. Delivery systems extended release or controlled release rate can ach ieve predictable and reproducible, the extended duration of activity for the short time of life - drugs, reduced toxicity and dose reduction request, the optimized therapy and better patient compliance. It is controlled primarily by the type and the proportion of the polymers used in the preparation. Eperisone hydrochloride is a centrally acting muscle relaxant acting through poly and mono-synaptic reflexes in the spinal cord, exhibits vasodilator effect, increases blood flow and inhibits the pain reflex pathway. The objective of present work was to develop and evaluated oral extended release floating matrix tablet of eperisone HCl prepared by the method of direct compression, using hydroxy propyl methyl cellulose (HPMC K15, HPMC K4) and PVP K30 as matrix formation polymers. Sodium bicarbonate and citric acid was used as gas generating agents. The FTIR spectra of the eperisone HCl and other excipients alone and in combination show the compatibility of the drug and excipients. Nine formulations of different polymer percentages were formulated (F1-F9). Pre-compression parameters were evaluated. The influence of matrix forming agents and binary mixtures of them on eperisone HCl release was investigated. The formulated tablets were characterized by thickness and diameter, drug content, hardness, friability, uniformity of weight, In vitro buoyancy studies and dissolution rate studies. The formulated tablets had acceptable physicochemical characters. The data obtained from the in-vitro dissolution studies of optimized batch F7 were fitted in different models. The optimized formulation F7 showed 99.45±0.45% drug content and floating lag times of 65±4 sec. Drug release mechanism was found to be first order kinetics. Eperisone HCl floating tablets exhibited increased gastric residence time, there by improved bioavailability and therapeutic effect of the drug.
Keywords: Sustained release, Eperisone hydrochloride, Direct compression, Pre and post compression parameters
Article Info:Received 18 April 2019; Review Completed 21 May 2019; Accepted 25 May 2019; Available online 15 June 2019
Cite this article as:
Ekta, Jain P, Jain S, Khan MA, Formulation and Evaluation of Extended Release Floating Matrix Tablet of Eperisone Hydrochloride by Direct Compression Method, Journal of Drug Delivery and Therapeutics. 2019; 9(3-s):86-92 http://dx.doi.org/10.22270/jddt.v9i3-s.2798
*Address for Correspondence:
Miss Ekta, Patel College of Pharmacy, Ratibad, Bhabdhada Road Bhopal (MP) 462044 India
INTRODUCTION
Oral controlled drug delivery system provides the continuous oral delivery of drugs at predictable and reproducible kinetics for a predetermined period throughout the course of Gastro Intestinal (GI) transit. Conventional oral controlled dosage forms suffer from mainly two adversities the short gastric retention time and unpredictable gastric emptying time1. A relatively short GI transit time of most drug products impedes the formulation of single daily dosage forms. Altering the gastric emptying can overwhelm these problems. Therefore it is desirable, to formulate a controlled release dosage form that gives an extended GI residence time. One of the most feasible approaches for achieving a prolonged and predictable drug delivery profiles in the
formulation, dual benefits of buoyancy as well as sustained action are achieved with an intention to maintain the steady state of drug release5. Hydrophilic matrix system is one of the easiest approaches for developing modified and sustained release dosage forms. A polymer like hydroxyl propyl methyl cellulose (HPMC) function as a pH independent gelling agent and drug release is shown by swelling and erosion mechanism occurring simultaneously contributing to overall drug release6.Matrix system is the commonly used method for modulating the drug release7. The manufacture of matrix tablets by direct compression is cheaper, simpler process, broad regulatory acceptance and allows flexibility in obtaining desirable release profiles8. Eperisone hydrochloride which is chemically known as 4’-ethyl-2-methyl-3-piperidino propiophenone hydrochloride, has chemical formula C17H25NO and belongs to the class of
muscular relaxants, having molar mass 259.387g/mol9. The
drug acts by acting on central nervous stem cells providing relaxation of both skeletal and vascular smooth muscles10. Oral eperisone is effectively used three times daily (t.i.d) at dosage regimen of 100 mg. It is well known for use in the treatment of muscular spasm, lower back pain, cervical spondolysis and in spastic paralysis in terms of cerebrovascular disease. The drug is well tolerated at doses of with mild GI symptoms involving nausea; abdominal cramps, headache and dizziness are the commonly observed adverse effects10-12. The drug is rapid absorption after oral administration. It has biological half-life of about 1-4.3 hour, its rapid elimination rules out risk of accumulation13. The present study is to develop a floatable drug delivery system of eperisone hydrochloride using hydroxy propyl methyl cellulose, PVP K30 for sustained drug delivery and gastric retentive property. Thus the study aims to improve the oral bioavailability of the drug and to achieve extended retention in the stomach which may result in prolonged absorption.
MATERIALS AND METHODS
MaterialsEperisone hydrochloride was obtained as a gift sample from Macleod’s Pvt Ltd. (India). Hydroxy propyl methyl cellulose (HPMC K4 &K15) was procured from Colorcon Asia Bio limited. (India). PVP K30, Citric acid, Magnesium stearate, Sodium bicarbonate, Talc, Lactose, were procured from S. D. Fine Chem. Ltd, Mumbai, India. All other chemicals and solvents used were analytical grades.
Methods
Preformulation studies
Standardization of eperisone HCl by UV-Visible spectrophotometry
Preparation of standard stock solution
10mg of eperisone HCl was weighed accurately and transferred to 10 ml volumetric flask, and the volume was adjusted to the mark with the 0.1 N HCl to give a stock solution of 1000 ppm or µg/ml. This solution was suitably diluted with 0.1 N HCl to obtain a concentration of 15μg/ml. The resultant solution was scanned in the range of 200-400 nm using UV double beam spectrophotometer (Labindia U.V. 3000 +).
Standard calibration of eperisone HCl in 0.1N HCl
100 mg of eperisone HCl was accurately weighed and dissolved in100 ml of 0.1N HCl to obtain a concentration of 1000μg/ml. From the above 10 ml was withdrawn and diluted to 100 ml to obtain a concentration of 100μg/ml. From this stock solution aliquots of 0.5, 1.0, 1.5, 2.0 and 2.5 ml were diluted in 10 ml volumetric flask with water to give concentrations in the range of 5-25μg/ml, respectively, absorbance was measured at 276 nm.
Identification eperisone HCl by IR
Identification of eperisone HCl was done by FTIR spectroscopy with respect to marker compound. Eperisone HCl was obtained as white crystalline powder. It was identified from the result of IR spectrum as per specification.
Preparation of floating matrix tablets of eperisone HCl
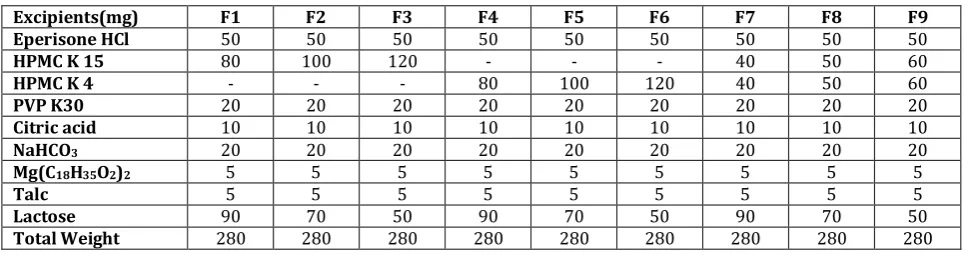
Eperisone HCl matrix floating tablets were prepared by direct compression method employing sodium bicarbonate and citric acid as gas-generating agent. HPMC and PVP K30 were used as rate controlling polymers. The concentrations of the excipients were optimized as showed in table 1. The drug was mixed with the rate retarding polymers and other excipients in ascending order of their weights. The powder mix was blended for 20 min to have uniform distribution of drug in the formulation. Then magnesium stearate and talc were added. About 280 mg of the powder mix was weighed accurately and fed into the die and compressed using 10 mm round surface punches14. The composition of formulation was given in table 1.
Table 1 Composition of SR matrix floating tablet of eperisone HCl
Excipients(mg) F1 F2 F3 F4 F5 F6 F7 F8 F9
Eperisone HCl 50 50 50 50 50 50 50 50 50
HPMC K 15 80 100 120 - - - 40 50 60
HPMC K 4 - - - 80 100 120 40 50 60
PVP K30 20 20 20 20 20 20 20 20 20
Citric acid 10 10 10 10 10 10 10 10 10
NaHCO3 20 20 20 20 20 20 20 20 20
Mg(C18H35O2)2 5 5 5 5 5 5 5 5 5
Talc 5 5 5 5 5 5 5 5 5
Lactose 90 70 50 90 70 50 90 70 50
Total Weight 280 280 280 280 280 280 280 280 280
Evaluation of eperisone HCl floating matrix tablets Pre-compression parameters
Angle of repose
The angle of repose of blends was determined by the funnel method. The accurately weighed blend was taken in the
Tan Ѳ= h/r
Where, “h” is the height of the heap and “r” is the radius of the heap of granules.
Bulk density (BD)
An accurately weighed powder blend from each formula was lightly shaken to break any agglomerates formed and it was introduced in to a measuring cylinder. The volume occupied by the powder was measured which gave bulk volume. The BD of powder blends was determined using the following formula16.
Tapped bulk density (TBD)
An accurately weighed powder blend from each formula was lightly shaken to break any agglomerates formed and it was introduced into a measuring cylinder. The measuring cylinder was tapped until no further change in volume was noted which gave the tapped volume. The TBD of powder
blends was determined using the following formula17.
Carr’s compressibility index
The Carr’s compressibility index was calculated from bulk density (BD) and tapped density of the blend. A quantity of 2 g of blend from each formulation, filled into a 10 ml of measuring cylinder. Initial bulk volume was measured, and cylinder was allowed to tap from the height of 2.5 cm. The tapped frequency was 25±2/min to measure the tapped volume of the blend. The BD and tapped density were calculated by using the bulk volume and tapped volume. Carr’s compressibility index was calculated using the following formula18,19.
Hausner’s ratio
It is the measurement of frictional resistance of the drug. The ideal range should be 1.2-1.5, it was determined by the ratio of tapped density and bulk density.
HR = Tapped Density/ Bulk Density
Post-compression parameters
All the tablets were evaluated for following different parameters which includes;
General appearance
Ten tablets from different batches were randomly selected and organoleptic properties such as color, shape, were evaluated. Appearance was judged visually. Very good (+++), good (++), fair (+) poor (-), very poor (- -).
Thickness and diameter
Thickness and diameter of tablets were determined using Vernier caliper. Five tablets from each batch were used and an average value was calculated.
Drug content
Twenty tablets were taken and amount of drug present in each tablet was determined. The tablets were crushed in a mortar and the powder equivalent to 100mg of drug was transferred to 100ml standard flask. The powder was dissolved in 50 ml of 0.1 N HCl and made up to volume with
of 0.1 N HCl. The sample was mixed thoroughly and filtered through a 0.45μ membrane filter. The filtered solution was diluted suitably and for drug content by UV spectrophotometer at λ max of 276 nm using of 0.1 N HCl as blank.
Hardness
For each formulation, the hardness of five tablets was determined using the Monsanto hardness tester (Cadmach).
Friability
From each batch, ten tablets were accurately weighed and placed in the friability test apparatus (Roche friabilator). Apparatus was operated at 25 rpm for 4 minutes and tablets were observed while rotating. The tablets were then taken after 100 rotations, dedusted and reweighed. The friability was calculated as the percentage weight loss.
% friability was calculated as follows % Friability = (W1 – W2) x 100/W1
Where W1 = Initial weight of the 10 tablets, W2 = Final weight of the 10 tablets after testing.
Friability values below 0.5-1% are generally acceptable
Uniformity of weight
Twenty tablets were randomly selected from each batch individually weighed, the average weight and standard deviation of 20 tablets was calculated.
In vitro buoyancy studies
In vitro buoyancy was determined by floating lag time as per
the method described by Rosa et al. The tablets were placed
separately in a 100 ml glass beaker containing simulated gastric fluid (SGF), pH 1.2 as per USP. The time required for the tablet to rise to the surface and float was determined as floating lag time20.
Dissolution rate studies
In vitro drug release of the sample was carried out using
USP- type II dissolution apparatus (Paddle type). The dissolution medium, 900 ml 0.1N HCl was placed into the dissolution flask maintaining the temperature of 37±0.50C
and rpm of 75.One eperisone HCl tablet was placed in each
basket of dissolution apparatus. The apparatus was allowed to run for 10 hours. Sample measuring 5 ml were withdrawn after every 1 hour up to 10 hours using 10ml pipette. The
fresh dissolution mediums (370C) were replaced every time
with the same quantity of the sample and take the absorbance at 276.0 nm using spectroscopy.
Mathematical treatment of in-vitro release data
The quantitative analysis of the values obtained in dissolution/release tests is easier when mathematical formulas that express the dissolution results as a function of some of the dosage forms characteristics are used.
1. Zero-order kinetics: The pharmaceutical dosage forms following this profile release the same amount of drug by unit of time and it is the ideal method of drug release in order to achieve a pharmacological prolonged action. The following relation can, in a simple way, express this model:
Qt = Qo + Ko t
2. First-order kinetics: The following relation expresses this model:
where Qt is the amount of drug dissolved in time t, Qo is the initial amount of drug in the solution and K1 is the zero order release constant.
In this way a graphic of the decimal logarithm of the released amount of drug versus time will be linear. The pharmaceutical dosage forms following this dissolution profile, such as those containing water-soluble drugs in porous matrices, release drug in a way that is proportional to the amount of drug remaining in its interior, in such way, that the amount of drug released by unit of time diminish.
3. Higuchi model: Higuchi developed several theoretical models to study the release of water-soluble and low soluble drugs in semi-solid and/or solid matrixes. Mathematical expressions were obtained for drug particles dispersed in a uniform matrix behaving as the diffusion media.
The simplified Higuchi model is expressed as:
Where Q is the amount of drug released in time t and KH is
the Higuchi dissolution constant. Higuchi model describes drug release as a diffusion process based in the Fick’s law, square root time dependent. This relation can be used to describe the drug dissolution from several types of modified release pharmaceutical dosage forms such as transdermal systems and matrix tablets with water-soluble drugs.
4. Korsmeyer-Peppas model: Korsmeyer et al. used a simple empirical equation to describe general solute release behaviour from controlled release polymer matrices:
Where Mt/M is fraction of drug released, a is kinetic constant, t is release time and n is the diffusional exponent for drug release. ’n’ is the slope value of log Mt/M versus log time curve. Peppas stated that the above equation could adequately describe the release of solutes from slabs, spheres, cylinders and discs, regardless of the release mechanism. Peppas used this n value in order to characterize different release mechanisms, concluding for values for a slab, of n =0.5 for fickian diffusion and higher values of n, between 0.5 and 1.0, or n =1.0, for mass transfer following a non-fickian model. In case of a cylinder n =0.45 instead of 0.5, and 0.89 instead of 1.0. This equation can only be used in systems with a drug diffusion coefficient fairly concentration independent. To the determination of the exponent n the portion of the release curve where Mt/M < 0.6 should only be used. To use this equation it is also necessary that release occurs in a one-dimensional way and that the system width-thickness or length-thickness relation be at least 10. A modified form of this equation was
developed to accommodate the lag time (l) in the beginning
of the drug release from the pharmaceutical dosage form:
When there is the possibility of a burst effect, b, this equation becomes:
In the absence of lag time or burst effect, l and bvalue would
be zero and only atn is used. This mathematical model, also
known as Power Law, has been used very frequently to describe release from several different pharmaceutical modified release dosage forms21-23.
RESULTS AND DISCUSSIONS
Eperisone HCl was found to be white crystalline powder in appearance, odourless and tasteless. Solubility of eperisone HCl was freely soluble in methanol, ethanol and water, soluble in chloroform and 0.1N HCl, Slightly soluble in 0.1N NaOH and Insoluble in 7.2 phosphate buffer. The melting point of eperisone HCl was 169-171°C and percentage of loss on drying, moisture content of eperisone
HCl was found to be 0.25%, 0.13% respectively. The λ max of
eperisone HCl was found to be 276 nm by using U.V. spectrophotometer (Labindia-3000+) in linearity range 5-25 µg/ml Fig.1. Identification of eperisone HCl was done by FTIR spectroscopy with respect to marker compound. It was identified from the result of IR spectrum as per specification Fig.2.
Figure 1 Calibration curve of eperisone hydrochloride
Figure 2 IR Spectra of eperisone hydrochloride
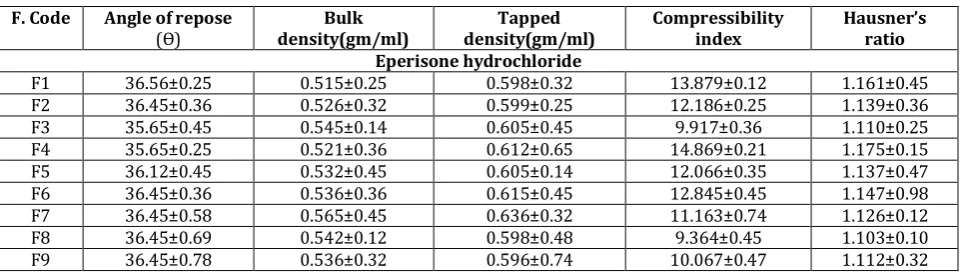
Tablet powder blend was subjected to various pre-compression parameters Table 2. The angle of repose values indicates that the powder blend has good flow properties. The bulk density of all the formulations was found to be in the range of 0.515±0.25 to 0.565±0.45 (gm/ml) showing that the powder has good flow properties. The tapped density of all the formulations was found to be in the range of 0.596±0.74 to 0.636±0.32 showing the powder has good flow properties. The compressibility index and Hauser’s ratio of all the formulations were found to be ranging
between 9.364±0.45 to14.869±0.21 and1.103±0.10
Table 2 Result of pre-compression properties of eperisone hydrochloride tablets blend F. Code Angle of repose
(Ѳ) density(gm/ml) Bulk density(gm/ml) Tapped Compressibility index Hausner’sratio Eperisone hydrochloride
F1 36.56±0.25 0.515±0.25 0.598±0.32 13.879±0.12 1.161±0.45
F2 36.45±0.36 0.526±0.32 0.599±0.25 12.186±0.25 1.139±0.36
F3 35.65±0.45 0.545±0.14 0.605±0.45 9.917±0.36 1.110±0.25
F4 35.65±0.25 0.521±0.36 0.612±0.65 14.869±0.21 1.175±0.15
F5 36.12±0.45 0.532±0.45 0.605±0.14 12.066±0.35 1.137±0.47
F6 36.45±0.36 0.536±0.36 0.615±0.45 12.845±0.45 1.147±0.98
F7 36.45±0.58 0.565±0.45 0.636±0.32 11.163±0.74 1.126±0.12
F8 36.45±0.69 0.542±0.12 0.598±0.48 9.364±0.45 1.103±0.10
F9 36.45±0.78 0.536±0.32 0.596±0.74 10.067±0.47 1.112±0.32
The results of post-compression parameters such as the thickness and diameter, drug content, hardness, friability,
uniformity of weight, In vitro buoyancy studies and
dissolution rate studies of the tablets are given in Table 3. All the tablets of different batches complied with the official requirements of uniformity of weight. The hardness of the
tablets ranged from 5.1±0.1to 5.8±0.3 kg/cm2 and the
friability values were less than 0.8% indicating that the
matrix tablets were compact and hard. The thickness of the tablets ranged from 3.12±0.06 to3.61± 0.05mm. All the formulations satisfied the content of the drug as they contained 98.69±0.23 to 99.45±0.45 % of eperisone HCl and good uniformity in drug content was observed. Thus all the physical attributes of the prepared tablets were found be practically within control.
Table 3 Results of post compression properties of eperisone hydrochloride floating matrix tablets F. code Thickness*
(mm) Hardness* (kg/cm2) variation* (mg) Weight Friability* (%) content* (%) Drug
F1 3.56±0.05 5.2±0.1 280±5 0.856±0.12 98.89±0.21
F2 3.54± 0.10 5.6±0.2 285±6 0.812±0.15 98.69±0.23
F3 3.52± 0.05 5.1±0.1 284±7 0.865±0.25 98.78±0.15
F4 3.45± 0.05 5.6±0.3 286±4 0.878±0.32 99.12±0.47
F5 3.54± 0.10 5.4±0.2 289±9 0.842±0.25 98.45±0.58
F6 3.58± 0.06 5.8±0.3 287±5 0.896±0.45 99.12±0.65
F7 3.59± 0.05 5.3±0.2 284±4 0.845±0.47 99.45±0.45
F8 3.61± 0.05 5.4±0.3 286±3 0.812±0.52 98.78±0.32
F9 3.12±0.06 5.6±0.1 289±3 0.856±0.45 98.78±0.45
*n=3 Table 4 Results of in-vitro buoyancy study of eperisone
HCl Formulation
Code times (sec) n=3 Floating lag Total Floating Time (hrs)
F1 60±3 >12
F2 65±2 >12
F3 63±5 >12
F4 64±6 >12
F5 65±4 >12
F6 68±5 >12
F7 55±6 >12
F8 63±7 >12
F9 64±2 >12
In vitro buoyancy was determined by floating lag time and total floating time. Results were given in table 4.
The tablets were evaluated for in vitro dissolution studies in 0.1N HCl for 12 hours. The results of in-vitro drug release
revealed that the eperisone HClwas released in a controlled
manner from all the formulations where formulation F7 showed maximum drug release i.e. 99.89±0.32 % at the end of 12th hour. The results of release studies of formulations F1 to F9 are shown in Table 5 and Figure 3.
Table 5 In-vitro drug release study of GRF tablets
Time % Cumulative Drug Release (n=3) (Mean ± S.D.)
(hrs.) F1 F2 F3 F4 F5 F6 F7 F8 F9
0.5 36.56±0.25 35.65±0.32 33.25±0.21 30.21±0.32 28.98±0.32 26.65±0.36 25.56±0.12 20.25±0.32 15.45±0.32
1 45.89±0.23 42.56±0.15 40.45±0.14 39.98±0.45 35.45±0.15 30.35±0.45 36.45±0.19 29.98±0.21 22.12±0.15
1.5 65.54±0.15 60.25±0.54 58.98±0.32 55.45±0.41 51.15±0.45 40.56±0.54 48.98±0.21 45.58±0.41 41.45±0.45
2 89.32±0.12 85.59±0.65 65.45±0.41 62.14±0.23 60.25±0.65 61.25±0.36 55.65±0.32 50.25±0.47 46.65±0.74
3 98.78±0.25 96.65±0.12 89.98±0.21 86.65±0.14 82.12±0.42 70.25±0.25 69.98±0.45 61.15±0.65 50.45±0.56
4 99.89±0.15 95.45±0.32 93.12±0.25 91.65±0.14 83.25±0.45 75.65±0.32 70.25±0.45 55.65±0.65
6 99.12±0.45 99.45±0.36 99.45±0.65 93.56±0.36 86.69±0.41 75.65±0.32 64.45±0.14
8 98.78±0.45 95.56±0.25 80.25±0.25 78.89±0.32
Figure 3 In-vitro drug release study of GRF tablets
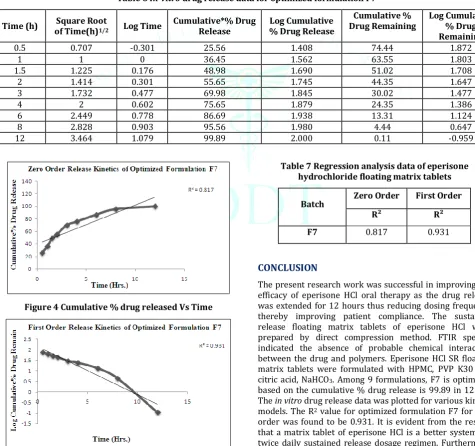
The in vitro drug release data of the optimized formulation
F7 was subjected to goodness of fit test by linear regression analysis according to zero order, first order kinetic equation, Higuchi’s and Korsmeyer’s models in order to determine the mechanism of drug release. When the regression coefficient
values of were compared, it was observed that ‘r’ values of first order was maximum i.e. 0.931hence indicating drug release from formulations was found to follow first order release kinetics Table 6, 7 & Fig. 4,5.
Table 6 In-vitro drug release data for optimized formulation F7
Time (h) of Time(h)Square Root 1/2 Log Time Cumulative*% Drug Release % Drug Release Log Cumulative Drug Remaining Cumulative % Log Cumulative % Drug Remaining
0.5 0.707 -0.301 25.56 1.408 74.44 1.872
1 1 0 36.45 1.562 63.55 1.803
1.5 1.225 0.176 48.98 1.690 51.02 1.708
2 1.414 0.301 55.65 1.745 44.35 1.647
3 1.732 0.477 69.98 1.845 30.02 1.477
4 2 0.602 75.65 1.879 24.35 1.386
6 2.449 0.778 86.69 1.938 13.31 1.124
8 2.828 0.903 95.56 1.980 4.44 0.647
12 3.464 1.079 99.89 2.000 0.11 -0.959
Figure 4 Cumulative % drug released Vs Time
Figure 5 Log cumulative % drug remaining Vs Time
Table 7 Regression analysis data of eperisone hydrochloride floating matrix tablets
Batch Zero Order First Order
R² R²
F7 0.817 0.931
CONCLUSION
The present research work was successful in improving the efficacy of eperisone HCl oral therapy as the drug release was extended for 12 hours thus reducing dosing frequency thereby improving patient compliance. The sustained release floating matrix tablets of eperisone HCl were prepared by direct compression method. FTIR spectra indicated the absence of probable chemical interaction between the drug and polymers. Eperisone HClSR floating matrix tablets were formulated with HPMC, PVP K30 and citric acid, NaHCO3. Among 9 formulations, F7 is optimized based on the cumulative % drug release is 99.89 in 12 hrs.
The in vitro drug release data was plotted for various kinetic
models. The R2 value for optimized formulation F7 for first
order was found to be 0.931. It is evident from the results that a matrix tablet of eperisone HCl is a better system for twice daily sustained release dosage regimen. Furthermore
REFERENCES
1. Banker GS, Rhodes CT. Modern Pharmaceutics. 3rd ed. Marcel
Dekker: New York; 1996. p. 678-21.
2. Vyas SP, Khar RK. Controlled drug delivery: concepts and
advances. 1st ed. Vallabh Prakashan, New Delhi; 2002. p.
345-76.
3. Yeole PG. Floating drug delivery system: need and
development. Indian J Pharm Sci 2005:67; 265-72.
4. Aurora S. Floating drug delivery: a review. AAPS Pharm Sci
Tech 2005:47; 268-72.
5. Negi JS, Trivedi A, Khanduri P, Negi V, Kasliwal N. Effect of
Bioadhesion on initial in vitro buoyancy of effervescent floating matrix tablets of ciprofloxacin HCl. J Adv Pharm Tech Res 2011;2:121-127.
6. Samyuktha Rani B, Vedha Hari BN, Brahma Reddy A, Punitha
S, Devi P, Rajamanickam V. The recent developments on gastric floating drug delivery systems: A overview. Int J Pharm Tech Res 2010; 2:524-34.
7. Yadav A, Jain DK. In-vitro characterization of gastroretentive
microballoons prepared by the emulsion solvent diffusion method. J Adv Pharm Tech Res 2010; 1:56-67.
8. Yadav A, Jain DK. Gastroretentive microballoons of
metformin: Formulation development and characterization. J Adv Pharm Tech Res 2011; 2:51-5.
9. Viveksarathi K, Rajarajan R, Kannan K, Manavalan R. Dosage
form design and evaluation of eperisone hydrochloride matrix film coated extended release tablets. Int J Pharm Pharm Sci. 2012; 4(2):575-81.
10. Cabitza P, Randelli P. Efficacy and safety of eperisone in
patients with low back pain: a double blind randomized study. Eur Rev Med Pharmacol Sci. 2008; 12(4):229-35.
11. Chandanwale AS, Chopra A, Goregaonkar A, Medhi B, Shah V,
Gaikwad S, et al. Evaluation of eperisone hydrochloride in the treatment of acute musculoskeletal spasm associated with low back pain: a randomized, double-blind, placebo-controlled trial. J Postgrad Med. 2011; 57(4):278.
12. Bose K. The efficacy and safety of eperisone in patients with
cervical spondylosis: results of a randomized, double-blind,
placebo-controlled trial. Methods Find Exp Clin Pharmacol. 1999; 21(3):209-14.
13. Melilli B, Piazza C, Vitale DC, Marano MR, Pecori A, Mattana P
et al. Human pharmacokinetics of the muscle relaxant, eperisone hydrochloride by liquid chromatography– electrospray tandem mass spectrometry. Eur J Drug Metab Pharmacokinet 2011; 36(2):71.
14. Desai S, Bolton S. A floating controlled release system: in-vitro
and in-vivo evaluation. J Pharm Res 1993:10; 1321-5.
15. Sakore S, Chakraborty B. Formulation and evaluation of
enalapril maleate sustained release matrix tablets. Int J Pharm Biomed Res 2013; 4:21-6.
16. Udayakumar T, Suresh AG, Ubaidulla U. Formulation and
evaluation of immediate and sustained release bilayered tablet with glibenclamide and metformin Hcl. Int J Res Dev Pharm Sci 2013;2:337-43.
17. Shashidhar P, Vidya Sagar G, Srikanth G. Design and in-vitro
evaluation of metformin hydrochloride (SR) and glimepiride (IR) as bilayered tablets. Int J Pharm Chem Sci 2013; 2:780-92.
18. Sridhar Babu G, Vijay Kumar D, Aishwarya M, Malathy PS,
Redya Naik R. Formulation and in vitro characterization of sustained release matrix tablets of metformin Hcl. J Glob Trends Pharm Sci 2014;5:2085-92.
19. Saluja V, Garg C. Once-daily sustained-release matrix tablets of
metformin hydrochloride based on an enteric polymer and chitosan. J Pharm Educ Res 2013; 4:92-7.
20. Shishu G, Gupta N, Aggarwal N. A gastro-retentive floating
delivery system for 5-fluorouracil. Asian J Pharm Sci. 2007; 2:143-49.
21. Wagner JG. Interpretation of percent dissolved-time plots
derived from in vitro testing of conventional tablets and capsules. J Pharm Sci 1969; 58:1253-57.
22. Gibaldi M, Feldman S. Establishment of sink conditions in
dissolution rate determinations: theoretical considerations and application to non disintegrating dosage forms. J Pharm Sci 1967; 56:1238-42.
23. Higuchi T. Mechanism of sustained-action medication: