Pietrzyk, Mariusz W., Manning, David J., Dix, Alan and Donovan, Tim (2008)
Relations between physical properties of local and global image-based elements
and the performance of human observers in lung nodule detection. Proceedings of
SPIE, 6917 (69170Z).
Downloaded from: http://insight.cumbria.ac.uk/id/eprint/33/
Usage of any items from the University of Cumbria’s institutional repository ‘Insight’ must conform to the following fair usage guidelines.
Any item and its associated metadata held in the University of Cumbria’s institutional repository Insight (unless stated otherwise on the metadata record) may becopied, displayed or performed, and stored in line with the JISC fair dealing guidelines (available here) for educational and not-for-profit activities
provided that
• the authors, title and full bibliographic details of the item are cited clearly when any part of the work is referred to verbally or in the written form
• a hyperlink/URL to the original Insight record of that item is included in any citations of the work
• the content is not changed in any way
• all files required for usage of the item are kept together with the main item file.
You may not
• sell any part of an item
• refer to any part of an item without citation
• amend any item or contextualise it in a way that will impugn the creator’s reputation
• remove or alter the copyright statement on an item.
The full policy can be found here.
Relations between physical properties of local and global
image-based elements and the performance of human observers in lung
nodule detection
Mariusz W Pietrzyk
1,2, David J Manning
1, Alan Dix
2, Tim Donovan
1,
1
School of Medical Imaging Sciences, University of Cumbria, Bowerham Road, Lancaster, LA1
3DJ, UK;
2Computing Department, Lancaster University, Lancaster, LA1 4YR, UK
ABSTRACT
Aim: The study aims to help our understanding of the relationship between physical characteristics of local and global image features and the location of visual attention by observers. Background: Neurological visual pathways are specified at least in part by particular spatial frequency ranges at different orientations. High spatial frequencies, which carry the information of local perturbations like edges, are assembled mainly by foveal vision, whereas peripheral vision provides more global information coded by low frequencies. Recent visual-search studies in mammography (C Mello-Thoms et al) have shown that observers allocate visual attention to regions of the image depending on; i) spatial frequency characteristics of regions that capture attention and ii) the level of experience of the observer. Both aspects are considered in this study. Methods: A spatial frequency analysis of postero-anterior (PA) chest images containing pulmonary nodules has been performed by wavelet packet transforms at different scales. This image analysis has provided regional physical information over the whole image field on locations both with nodules present and nodules absent. The relationship between such properties as spatial frequency, orientation, scales, contrast, and phase of localised perturbations has been compared with eye-tracked search strategies and decision performance of observers with different levels of expertise. Results: The work is in progress and the results of this initial stage of the project will be presented with a critical appraisal of the methods used.
Keywords: Image Perception, Spatial Frequency Analysis, Wavelet, Eye-tracking
1.INTRODUCTION
The high rate of image-based procedures accounted for in all hospital events suggests that Medical Imaging plays an important role in modern health care service1, and provides information about the patient’s state of health in a most safe and effective way. The many different imaging methods that are implemented for that purpose nowadays creates a wide range of screening procedures dedicated to particular disorders. However, the proper uses of that information strongly depend on the visual perception and right interpretation of medical images. That is why, although, high quality images, provided by advance imaging technologies, are very useful, there is no guarantee that they will be translated into accurate diagnosis of the diseases. Images are read by a radiologist and because of that, we can find many confounding factors related to human perception, cognition and intuition that relate to decision-making based on subjective, visual judgments. Human observers are an integral part of any imaging system. In consequence, the technical meaning of the term ‘image quality’ described in purely physical terms, may be modified by considering additional parameters2, e.g. some highly influential on the human observer perceptual factors3. The observer’s ability to perceive the abnormality seems to be a crucial requirement for diagnostic accuracy and together with the decision made once an abnormality has been detected establishes a base for observer performance measurement4. Results from observer error in terms of radiological tasks studies5,6,7,8,9 reveal a high score of various errors types and variations in interpretation between different experts within radiology performance due by multi-factorial influence 5,10, which underline statement about the weakest aspect of clinical imaging.
Based on that system approach to the radiological task11,12, it is possible to develop the error management. Strategies for reducing error include several aspects, like attention to viewing conditions, training of the observers, availability of
Medical Imaging 2008: Image Perception, Observer Performance, and Technology Assessment, edited by Berkman Sahiner, David J. Manning, Proc. of SPIE Vol. 6917, 69170Z, (2008)
1605-7422/08/$18 · doi: 10.1117/12.769574
Proc. of SPIE Vol. 6917 69170Z-1
previous and relevant clinical data, dual or multiple reporting, and standardization of terminology and report format. Another aspect is assistance from computers, where the post-processing techniques may improve the conspicuity of the subtle information from medical images, like e.g. computer-aided detection (CAD)13. However, the sophistication of radiological image analysis, and strict definition of the particular abnormalities become a real challenge14. What is more, the development of automatic detection systems is desirable in some particular screening procedures, like e.g. CT colonography, where computer output assistance implementation may increase process of expertise gathering mainly by increasing the observer accuracy and reducing the average investigation time per case15.
The highly specific abilities to acquire and also properly use contextual information differ between radiologists and naïve observers and define the expertise in a particular radiological field measured by the number of studied cases (images)16. These knowledge-structured skills of human observer, which are very narrowing, subdominant and not transferable into other domains, are composed of a set of elements. Perceptual skills include visual search, visual information processing, and visual discrimination and differentiation which are part of perceptual learning. Experienced observers are more likely to be attracted by subtler, less conspicuous findings and have a larger knowledge base to draw on when identifying and reporting a finding. On the other hand, cognitive skills are primarily related to object recognition, diagnostic reasoning and decision making. Natural predispositions of individuals (sometimes described as a talent) may also influence the visual search performance which also may be strongly related to motivational factors, where human performance improves as a function of practice. Many endogenous and exogenous factors have been identified by radiological errors studies. Their combinations influence the detection of abnormalities in medical images by contributing to the radiologists’ ability to disambiguate the findings from the background, and plausible decision-making criteria to separate true abnormalities from artifacts produced by tissue superposition or image noise. Some of those that are primarily cognitive and relate to observer’s knowledge and skills, are the radiologists’ experience and prior expectation, the prelevance of the disease in the screening population, knowledge about the features of the possible findings and the background, and the search and sampling strategy used in the visual search, which will be reflected in the proper choice of the most informative areas of the image against which to compare the perceived findings17,18. Another group contains image dependent factors that are related to the visual conspicuity of features relevant to the clinical problem, e.g. the complexity of the image background, the degree of variation in the appearance of abnormalities, the conspicuity of a particular object19. The perceptual or cognitive errors are common in diagnostic radiology, where the influential to the error factors have been investigating by eye-positions during image reading. The false negative rate is reported in various studies between 10 to even 50% of cases6,8,20, which may suggest the crucial impact of improper searching strategy and decision-making. Errors can also arise as a reason of the ‘Satisfaction of search’ mechanism21 or faulty observer’s priory expectation9, but also results from the specific interaction of image physical parameters and the human visual system processing these signals. Error and variation in the interpretation of the radiological images may have its origin in poor technique, failures of perception, lack of knowledge or misjudgement and may often done by combinations of these factors, and represent the weakness aspect of clinical imaging. Separately errors may be related to the problems in communication7.
The general model for problem solving in radiology flows from visual search to final decision-making via recognition in perceptual, cognitive and connectional approaches5. Monitoring of the expert’s and novice’s eye position has been used to investigate differences in observer with different experience level performance in radiological task. Experts are significantly faster and more accurate in detecting abnormalities as has been showed in both decision-time and eye-position experiments22. Moreover, two different types of search have been observed. A scan for unusual or interesting findings, without any expectations about findings is typical for non experience observer. In contrast, the heuristics, not random search for a specific finding includes ‘inattentional blindness’23 performed by experts and may result from prior knowledge and experience, which form an initial hypothesis to guide search, for the observer. Presumably the explanation of the searching strategy differences may be found in image-based feature influence on the visual attention. The reason why the experts almost immediately scrutinise the particular abnormality-contain location is that they possess a better‘a priori expectation map’ of what they are going to see, which is formed during the ‘global impression’. The flash experiments24, provide evidence that a global response involving input from the entire retina creates an overall impression of the onset stimuli. Initial impression, search and evaluation are more drawn out in observers with less expertise, and breakdowns in performance resulted in fewer true and more false positives. Although, the mechanism by which the observer accomplishes the reduction to a smaller number of sites in not well understood, the comparison of random versus systematic-scanning (exhaustive) models based on human eye-fixations parameters provides evidence that only a selected portion of all of the information available in the environment is captured and processed by the radiologists25, where the foveal scan effectively performs a filtering operation. The expert observers develop expertise in recognizing clinically-relevant perturbations, by selectively ignoring normal feature variants during
image reading
S
observer activity: global impression:
flagging regions
LOW SPATIAL FREO.
discovery phase: medical expertise:
searching & sampling strategy — true-posive. false- positive
LOW&HIGH SPATIAL FREO. true-negative. false-negative
0 300 reading time t ImsI
image reading. Furthermore, the eye movements are strongly related to visual attention, which is related with the area of a current fixation or the area where eyes are going to go next. The second view indicates that a shift of the eyes to a certain location is preceded by a shift in spatial-visual attention to that location. Eye-tracking experiments with the observer decision which region contain the abnormality relate the human behavior during visual task with the type of outcome. For example, the pupil sizes are significantly different between lesions that were correctly reported and those that attracted visual attention but were not reported. What is more, gaze duration at a given location has been shown to correlate with decision outcome at the location, and prolonging visual search after that 25s increased the risk of a false alarm26. True negative decisions were associated with shorter fixation times than false negative decisions27.Visual dwell data show that over 60% of missed targets seem to be cognitively processed28, according to the relation that the longer visual dwell spend on the particular site is associated with locations that required more resources for cognitive processing. Probability-analysis experiments show that the initial decision made significantly influences any subsequent analysis on that image. For example, when the first decision is incorrect, then the probability that the observer will find the true lesion is very low.
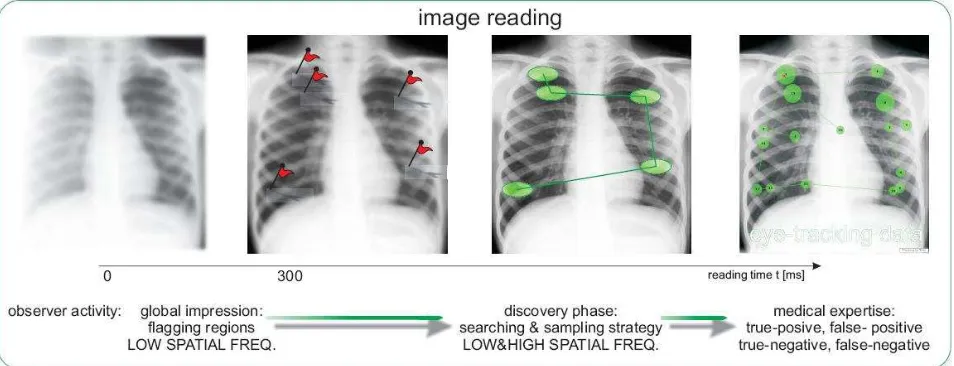
Visual perception appears as a result of the optical and neural transformations of the information about the world carried by light. The background concept of visual perception as a decision-centred process has been founded by Gregory and Rock ref. In an advance, visual searching process was modelled by a global-focal perception hypothesis by Nodine and Kundel29, which focuses on the perception various types of information perceived at different image reading times. These types are well represented in terms of spatial frequency properties by a low spatial frequency (LSF) characterizing the global information about visual stimuli and high spatial frequency (HSF) components related to the edges and details of image. Moreover, what has been shown, the LSF features are processed and analysed much faster by the observer brain (in a few hundreds msec) than HSF, which takes seconds30. A model divides the perception into two ordered phases (Figure 1).
Figure 1. An chest radiographs reading schema in terms of a global-focal perception model.
During first few hundred milliseconds a global impression about the image which had onset to the observer has been created by the human brain, often without the eye movements and away from the conciseness of this mechanism. This global analysis uses the low spatial frequency extracted from entire retinal network, and some particular suspicious for observer regions believe to be flagged during the first stage of perception. That flagging mechanism works as an automatically feature detection schedule forms a mental hypothesis of the perturbation localisations and it based on the previously experience, knowledge and skills as well as an intuition and talent. However, the early formation of incurrent hypothesis will likely to errors in perception. After this very short phase observer directs the high acuity beam of visual filed into specified location of previously mapped regions to perform more detail analysis. This high-resolution beam of the visual system called as a foveal vision ranges from 2 to 5 degrees of visual angle (useful field)31,32. The Nyquist sampling frequencies is highest in the fovea and decreasing with distance from fovea, equals to 70, 22, and 16.5 cycles per degree (cpd) respectively to the 0°, 5°, and 10° of eccentricity from retina centre. The second stage, which involved
eye movements, is also called as a discovery scanning. The role of peripheral vision in the searching task is still not well understood and is under investigation.
The oculomotor behavior contributes importantly to visual search, which may be modeled in cluttered environments as a competition process among the responses of oriented filters. Saccadic eye movements direct the fovea to potentially interesting parts of the image, performing some kind of selection from the whole image for only those regions that have been attractive enough to be scrutinised by observer in a particular visual search task. These sites contain specific object features which may be responsible for visual attraction. It is possible to associate each of these objects with the responses of a set of specific filters. Moreover, psychophysical studies from scene perception indicate that some elements in a scene elicit a strong or a weak response depending on the stimuli present in other parts of the scene. The radiologist’s sampling strategy for medical image investigation is mainly based on a comparison of some suspicious objects with their surround background. The local elements alone are not sufficient to determine the conspicuity area, but rather, information about the surround background is equally important43. The selection of these background samples corresponds to the observer’s visual search strategy, and it comprises a crucial step in the interpretation of the image.
The comparisons of data, where observers looked with what region has been scrutinised, gives insight into internal decision making. Eye-position experiments provide the locations of fixated points in the image, and a wide range of digital image analyses and processing methods have found applications to characterize image physical parameters of regions of particular interest33. Some of these techniques have been inspired by psychophysics and physiological findings of the human visual system34. The multi-resolution algorithms process the visual stimuli from coarse to fine via visual spatial-frequency tuned channels or bands performing the multi-scale transformations35. Active vision strategies compensate for the non-uniformity of visual resolution by moving the fovea with eye saccades. Regions of a scene with high information content are scanned successively. These saccades are partly guided by the lower resolution information gathered at the periphery of the retina. This multi-resolution sensor has the advantage to provide high resolution information at selected locations and a large field of view with relatively little data. Coarse to fine multi-resolution search reduces the computational complexity by beginning at low-resolution and adaptively increasing the resolution to gather the necessary details. In consequence, the radiologists’ visual system may operate on the local and global spatial frequency features and influence on image searching and interpretation, even without observer awareness of such features36.
Medical image analysis of the spatial frequency has been successfully led by Mello-Thoms et. al, who investigate observer performance during mammography. The results for these studies contribute to radiological decision-making mechanism and highlight the role of search in building up an accurate representation of the image background, in order to discriminate between types of outcomes10. Spatial frequency analysis was performed to relate what the observers reported with where they looked using the wavelet packets to extract spatial frequency information in a form of feature vector. Selected sub-images of regions of interest have been used as a input 2D signals into 2-level wavelet transform, where Daubechies functions define the filters properties of particular spatial frequency band. Each form 20 vector elements relate to the amount of information which is carried by the particular spatial frequency range at particular orientation. Statistically significant differences existed between the derived features of various regions in images were found performing the analysis of variance between specific groups of regions. It has been shown, that there is significant difference between the scrutiny regions and the rest of image, which is useful to model the area that attracted visual attention by comparing the fixations area called as a local representation with the background representation. The second step in the research considers the type of the decision outcomes by investigating the differences or similarities between
true-positive (TP), true-negative (TN), false-positive (FP), and false-negative (FN), characterized by a specific profile in the spatial frequency domain39. The different decision outcomes yielded different energy representations in the spatial frequency domain. The statistical significant differences exists in the spatial frequency (sf) characteristics of areas where observers made correct (TP, TN) and incorrect (FP, FN) decisions. Studies have also shown thatbackground sampling is an important part of image interpretation. Observers try to find the abnormalities by comparing perceived suspected object with selected areas of the background, and based on this process the decision about whether to report it or to dismiss it is made. As a result of an incorrect background sampling strategy observer may failure to report some abnormalities, which could explain why most unreported cancers do in fact attract prolonged visual attention19,37. FN seems to need more local information than FP, which rely on a global account. Local image processing might be able to flush out some FN by changing the local sf characteristics of visually inspected area that may contain a malignant lesion. An investigation of how the image-based elements are translated into decisions by radiologists considered the different level of observer experience. The study provides evidence that less experience observer, like residents, respond differently from experienced mammographers22, e.g. significant differences exist between TP and FP masses for residence but not for mammographers18. The data suggest also that, for experienced mammographers, most true
malignant lesions are found in the early stages of visual search whereas residents seem to be guided more by the conspicuity of local elements and have some difficulty in extracting global information for comparison. In consequence, the residents made primarily perceptual errors17. The next observation suggests a shift in reading strategy with experience. The mammographers made more comparisons between a finding and the breast parenchyma during the early stages of visual search, the residents did so only later in their search. The behavioral study of the experienced observers indicate that experts possess a distinct mental representation of what a malignant finding should look like, and during the reading they compare the displayed image with their mental map. Analysis of spatial frequency provides explanation e.g. why double reading of mammograms usually improves the detection rate38, and may provide useful information where collaboration between both observers will be optimal by describing the relations between particular types of decision outcomes18. In addition, the results of spatial frequency analysis can be used by a pattern classifier to predict both observer performances simulating their searching and decision-making process17,18, as well as implanting these findings into computer automated feature detection, like CAD system39. The last important finding relates to the significant differences between image sampling strategy before and after observers hit the location of a lesion. From the results of the comparison of spatial frequencies configurations,there is an indication of a change in visual search strategy. The discovery of these lesions related either to TP or FP outcomes, seems to influence the reading of the rest of the image18.
2.MATERIALS AND METHODS
A psychophysical methodology has been applied in our study. The research has an important applied component
that investigates radiological error and the characteristics of expert performance but the work also expects to make a contribution to what is known about more fundamental aspects of human visual decision-making. The two main research problems are stated by the following questions:
• What physical parameters or properties are responsible for the visual attraction of some particular local areas in the image, which have been investigated by observer?
• Are there spatial frequency properties that may be used to characterise those image perturbations that attract attention?
From a large database of the chest radiographs cases with already collected eye-tracking data, which are available for the current stage of the project form the Lancaster Medical Imaging and Neurosciences Research Team (LaMINeR), a set of 10 normal and 10 abnormal, with the retrospectively located lung nodules in the each case, male only chest radiographs with a 10 experts and novice eye-tracked data have been selected. The radiological specialists from the collaborative medical institutions will act as subjects . Ethical approval for the collection of data that will be accessed for this has been gained through a separate, existing project.
The eye-tracking workstation server to collect eye-position data contains a Tobii ET-17 eye tracking system running on a PC with the Windows Operating system and a high definition LCD monitor. The eye-tracker uses an infrared beam generated by near infra-red light-emitting diodes (NIR-LEDs) to calculate line of gaze by monitoring pupil and corneal reflection. In consequence, several parameters describing the observer behaviour during the image reading are recording provides information about where observer has been looked, for how long. What is more, the distance observer-image, the spatial position of the eye (considering the observer head movement), the pupil size are also available from eye-tracking data. The images have being displayed at the Medion MD6454AP LCD Monitor (ID: MED4967). The 2D distribution of the screen monitor pixels are arranged as a 1280 horizontal per 1024 vertical pixels element matrix, with the 18.8``(inches) in diagonal, and 37 cm x 30 cm, horizontal vs. vertical length respectively, with inter dot spacing 265
µm = 96 dot per inch (dpi). However, what is important to point is the difference between the spatial frequency of displayed image at the screen (cycle per screen) and the same spatial frequency of visual stimuli (signal or image), which is perceived by observer’s eyes (cycle per degree) and relates to the distance between the observer’s eyes.
The spatial frequency analysis of the non-stationary signals of medical images, required a multi-resolution wavelet transform methodology40,41,42 using a set of low and high pass filter banks, where each filter is sensitive to the particular spatial frequency range at defined orientation (Figure 2). This approach to the signal processing was developed under limitation of the Fourier Transform application to the non-stationary signals and informed by neurological findings about visual channels.
rows (y) columns (x)
high pass detail in vertical
dl V(x,y)
high pass --* frequncy (y)High
low pass detail in diagonaldlD(x,y) input 2D signal
i(x,y)
high pass detail in horisontaldlH(x,y)
low pass Low Freqync
y in y
low pass aproximation
al
(x,y)
Figure 2. A diagram of one level decomposition of 2D signal.
The input signal is transformed into a new representation by the convolutions of signal with the particular scaling and wavelet functions. That wavelet representation is used to calculate the feature vector, where each vector’s element informs about the amount of information (the energy value) carried by a particular band:
Energy =
∑
= =
N
y x
y
x
f
NxN
1 1
2
)
,
(
1
for N x N matrix (image)
At the end, the input signal has been divided by a set of spatial frequency bands, which numbers depend on the wavelets decomposition procedure and level – a decomposition tree. For example, after one level of 2D-signal decomposition, the four-element wavelet feature vector might be calculated. The spatial frequency analysis was computed with MATLAB Release 14 SP2, version 7.0.4 for Windows XP (Lancaster University users Licence), implementing Wavelet Packet Transform (WPT), which treats every output signal from the previous level as an input signal to the current decomposition. The maximum level of decomposition M depend on the signal size N=2M, and the limitation can be describe according to the uncertain principle for time(space)-frequency localisation for signal analysis. Each feature vector describes a particular region of interest (ROI) in terms of spatial frequency properties of that a well defined sub-image. Different ROIs might be categorized into several groups, for e.g. lung areas covering, contain, nodule-free, observer fixation-contain, or type of observer decision sub-images. The average of each spatial frequency band from a particular sub-images group feature vector is called as a representation, e.g. the vectors of sub-images covering the lung areas create a background representation of an image. The following step in analysis based on the statistical compassion between the representations using analysis of variance (ANOVA). Statistical analysis engaged the n-way analysis; considering several factors, for example, anatomical differences between lung regions, differences between the cases (images), differences between observer’s performances, level of experience, perceive image distortions due by observer’s head movement, foveal and peripheral vision.
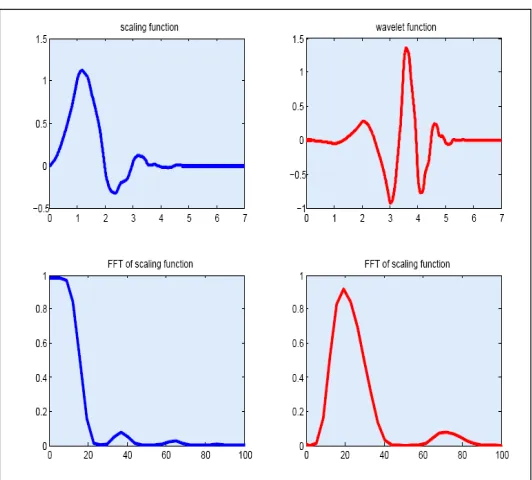
The calculation of the particular representation at the current stage of analysis based on the simplifying assumptions: constant distance observer-image (stationary model of observer interaction) and perception mainly by foveal vision. In consequence, each representation is calculated based on the same size sub-images feature vectors. The size of the ROI has been chosen to 100 pixels, which is relates to the size of the foveal visual filed. Moreover, the Daubechies wavelets (Figure 3.) have been implemented into 2 level decomposition of 2D WPT. The current research aims might be summarized as follow:
• calculate background wavelet representation
• calculate nodule wavelet representation
• calculate the observer fixation wavelet representation
• compare these representation consider the anatomical difference of lung regions
S
iidIiiflt
FFr or scaling funcoon FFT ul scaling function
80
Figure 3. Top: The 1D Daubechies wavelet 4 in (top) the space and (bottom) the frequency domain.
3. RESULTS
The work is in progress; however some preliminary results have been achieved so far. The image analysis stage aims to investigate the lung areas as a background to the signals which in this case are lung nodules. The comparison of the background representations (Figure 4) and the nodule representation (Figure 5) shows statistical differences between these two as average values of energy logarithm from a few spatial frequency bands.
Figure 4. An example of how the background representation has been calculated.
Region of Interest: Nodule no 1
Wavelet feature vector of selected ROl I OOsize generated by db4 WPT with 2 level of decorcposition
Figure 5. An example of the nodule ROI and wavelet feature vector related to that sub-image.
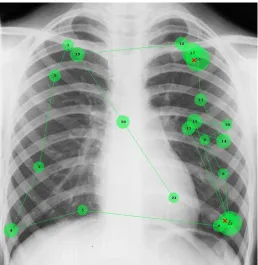
The analysis performed so far shows that when considering the selected anatomical lung region the background representation is more consistent within region and image groups and stronger differences between the nodule and background representation have been found. The observer performance analysis, based on the eye-position data (Figure 6) provides insight into the statistical differences between the observer fixations regions and the background representation.
Figure 6. The example of the eye-tracking data. The number relates to the chronological order of fixation, the radius of circle relates to the gaze duration, the red cross is the observer’s decision-point of the nodule-contain area.
-
WIet Packet Transn of PCI: 1 level of deco by Haarwavele coeff. [spatial freq bandi
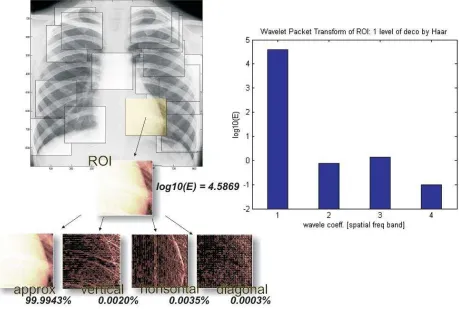
The middle of the local area of observer fixation has been analysed by wavelets transforms to find the spatial frequency characteristics of regions which captured visual attention. These specifications we have characterised as a local representation, and have been compared with the background representation which was calculated based on whole lung area. The calculation of the representations has been made over a ROI the size of which is determined by foveal visual. After first level of decomposition four wavelet transforms’ coefficients have been calculated each of which are characterized by different spatial frequency ranges at different orientations (Figure 7).
Figure 7. The general scheme of the wavelet’s methodology of medical images analysis in terms of spatial features local areas investigation. ROI size relates to the foveal vision degree right: the energies logarithms of each spatial frequency band: 1-approximation, 2-vertical, 3-horisontal, 4-diagonal.
The initial approximation is characterized by low spatial frequencies and as diagonal details by high frequencies in both directions. The horizontal details carry horizontal high frequencies and vertical low frequencies Further analyses treat each coefficient from the previous level as an input signal, so sixteen coefficients are calculated at the second level. Moreover, the lung region factor has been considered in analysis by grouping the feature vector according to which fixation belong to which region area. Significant differences have been found between the local representations of different observers and the background representations of a particular image.
4. DISCUSSION AND CONCLUSION
Although, this work is in progress, the methodology has been already successfully implemented into the set of medical images. More work is required in the near future. Development of the spatial frequency analysis algorithm and procedure involves several goals related to additional perceptual-behavioural aspects of the radiological task during image reading considered in the study, like, the best choice of the region of interest size, shape, the proper decomposition tree structure and the best basis selection. Moreover, the image analysis should include a comparison between different wavelet basis representation, where different scaling and wavelets function are used into WPT. This problem is called also the best basis selection. The different approaches to the best background representation calculation should be tested by comparing various strategies of lung area sampling for a background representation, which involve some progress in segmentation and classification improvements in algorithm. In observer performance analysis, a comparison between experts and novice observers are to be carried out. What is more, some additional behavioural factors may be considered, such as peripheral vision, observer-image distance, or the relations between type of decision and their feature vectors. In summary, future tasks may be led by the following considerations:
• develop the spatial frequency analysis procedure and algorithm
• consider additional behavioural data like e.g. the changing distance image-observer
• develop classification algorithm
• develop the segmentations algorithm
• analysis of the observer performance (type of decision)
• peripheral vision
Spatial frequency characteristics may become an additional criterion based on which matching algorithms in
computer-aided schemas could be implemented. Furthermore, we hope this work can make a contribution to new training strategies for radiologist by combining the visual search strategies in experts with the physical characteristics of the regions of their visual attention.
5. REFERENCES
1
C. A. Beam, E. A. Krupinski, H. L. Kundel, E. Sickles, R. Wagner, “The Place of Medical Image Perception in 21st -Century Health Care”, J Am Coll Radiol3, 409-412 (2006).
2
C. C. Blackmore, “Defining Quality in Radiology”, J Am Coll Radiol4, 217-223 (2007).
3
D. J. Manning, A. Gale, E. A. Krupinski, “Perception research in medical imaging”, BJR78, 683-685 (2005).
4
J. E. Potchen, “Measuring Observer Performance in Chest Radiology: Some Experiences”, J Am Coll Radiol3, 423-432 (2006).
5
P. J. Robinson, “Radiology’s Achilles’ heel: error and variation in the interpretation of the Rontgen image”, BJR70, 1085-1098 (1997).
6
J. E. Martin, M. Maskowitz, J. R. Milbrath, “Breast cancer missed by mammography”, AJR132, 737-739 (1979).
7
D. Renfrew, E. Franken, K. Berbaum, F. Weigelt, M. Abu-Yousef, “Error in Radiology: Classification and Lessons in 182 Cases Presented at a Problem Case Conference”, Radiology183, 145-150 (1992).
8
L. Quekel, A. Kessels, R. Goei, J. van Engelshoven, “Miss Rate of Lung Cancer on the Chest Radiograph in Clinical Practice”, Chest 115, 720-724 (1999).
9
R. Fitzgerald, “Error in Radiology”, Clinical Radiol.56, 938-946 (2001).
10
P. M. Taylor, “A Review of Research into the Development of Radiological Expertise: Implication for Computer-Based Training”, Acad. Radiol., in press (2007).
11
J. Reason, “Human error: models and management”, BMJ320, 768-770 (2000).
12
J. Reason, “Human Error”, Cambridge University Press, Cambridge (1990).
13
K. Doi, “Current status and future potential of computer-aided diagnosis in medical imaging”, British J Radiol78, S3-S19 (2005).
14
L. Bogoni, P. Cathier, M. Dundar, A. Jerebko, S. Lakare, J. Liang, S. Periaswamy, M. E. Baker, M. MacAri, “Compputer-aided detection (CAD) for CT colonography: a tool to address a growing need”, BJR78, 57-62 (2005).
15
P. J. Pickhardt, A. J. Taylor, D. H. Kim, M. Reichelderfer, D. V. Gopal, P.R. Pfau, “Screening for Colorectal Neoplasia with CT Colonography: Initial Experience from the 1st Year of Coverage by Third-Party Payers”, Radiol
241(2), 417-425 (2006).
16
C. F. Nodine, E. A. Krupinski, “Perceptual Skill, Radiology Expertise, and Visual Test Performance with Nina and Waldo”, Acad. Radiol.5, 603-612 (1998).
17
C. Mello-Thoms, “Perception of Breast Cancer: Eye-Position Analysis of Mammogram Interpretation”, Acad. Radiol.
10, 4-12 (2003).
18
C. Mello-Thoms, S. Dunn, C. F. Nodine, H. L. Kundel, S. P. Weinstein, “The Perception of Breast Cancer: What Differentiates Missed from Reported Cancers in Mammography?”, Acad. Radiol.9(9), 1004-1012 (2002).
19
C. Mello-Thoms, L. Hardesty, J. Sumkin, M. Ganott, Ch. Hakim, C. Britton, J. Stalder, G. Maitz, “Effects of Lesion Conspicuity on Visual Search in Mammogram Reading”, Acad. Radiol.12, 830-840 (2005).
20
J. E. Martin, M. Maskowitz, J. R. Milbrath, “Breast cancer missed by mammography”, AJR132, 737-739 (1979).
21
S. Samuel, H. L. Kundel, C. F. Nodine, L. Toto, “Mechanism of Satisfaction of Search: Eye Position Rcordings in the Reading of Chest Radiographs”, Radiol194, 895-902 (1995).
22
C. F. Nodine, H.L. Kundel,C. Mello-Thoms, “How experience and training influence mammography expertise”, Acad Radiol6, 575–585 (1999).
23
A. Mack, I. Rock, “Inattentional Blindness”, MA: MIT Press, Cambridge (1998).
24
A. G. Gale, J. Veron, K. Millar, B. S. Worthington, “Reporting in a Flash”, BJR63, s71 (1990).
25
C. F. Nodine, C. Mello-Thoms, “The Nature of Expertise in Radiology”, in J. Beutel, H. L. Kundel, R. L. Van Metter, eds., “Handbook of Medical Imaging”, 1(19), 871, SPIE Press, Washington (2000).
26
C. F. Nodine, C. Mello-Thoms, H. L. Kundel, et al., “Time course of perception and decision making during mammographic interpretation”, AJR179, 917-923 (2002).
27
D. J. Manning, S. C. Barker-Mill, T. Donovan, T. Crawford, “Time-dependent observer errors in pulmonary nodule detection”, BJR79, 343-346 (2006).
28
E. A. Krupinski, C. F. Nodine, H. L. Kundel, “Enhancinf Recognition of Lesions in Radiographic Images Using Perceptual Feedback”, Opt. Engineer.37, 813-818 (1998).
29
C. F. Nodine, H. L. Kundel, “Using eye movements to study visual search and to improve tumour detection”,
RadioGraph7(6), 1241-1250 (1983).
30
R. Cotterill, “Enchanted looms: conscious networks in brains and computers”, Cambridge University Press, Cambridge (1998).
31
H. L. Kundel, C. F. Nodine, D. I. Thickman, L. C. Toto, “Searching for Lung Nodules a Comparison of Human Performance with Random and Systematic Scanning Models”, Radiol22, 417-422 (1987).
32
C. Mello-Thoms, B. Chapman, “A Preliminary Report on the Role of Spatial Frequency Analysis in the Perception of Breast Cancers Missed at Mammomgraphy Screening”, Acad. Radiol.11, 894-908 (2004).
33
R. C. Gonzalez, R. E. Woods, “Digital Image Processing”, Addison-Wesley Pub. Comp., Prentice-Hall, New Jersey (2002).
34
J. G. Daugmann, “Two-dimensional spectral analysis of cortical receptive field profile”, Vision Res. 20, 847-856 (1980).
35
S. Mallat, “Wavelets for a vision”, Proc IEEE84, 604-614 (1996).
36
E. A. Krupinski, “The future of image perception in radiology: synergy between humans and computers”, Acad Radiol
10, 1–3 (2003).
37
C. F. Nodine, C. Mello-Thoms, S. P. Weinstein, H. L. Kundel, et al., “Blinded review of retrospectively visible unreported breast cancers: an eye position analysis”, Radiol221, 122–129 (2001).
38
S. H. Taplin, C. M. Rutter, J. G. Elmore, D. Seger, D. White, R. J. Brenner, “Accuracy of screening mammography using single versus independent double interpretation”, AJR174, 1257–1262 (2000).
39
C. Mello-Thoms, S. Dunn, C. F. Nodine, H. L. Kundel, “An analysis of perceptual errors in reading mammography using quasi-local spatial frequency spectra”, J Digit Image14, 117-123 (2001).
40
A.S. Addison, “The illustrated wavelet transform handbook”, Taylor&Francis Group, New Yourk London, (2002).
41
S. Mallat, “A wavelet tour of signal processing”, London: Academic Press, San Diego CA (1999).
42
I. Daubechies, “The lectures on wavelets”, Society for Ind. and App. Math, Philadelphia PA (1992).
Proc. of SPIE Vol. 6917 69170Z-11