Published by Faculty of Science, Kaduna State University
V-Network: A Testbed for Malware Analysis
THE V-NETWORK: A TESTBED FOR MALWARE ANALYSIS
Muhammad Aminu AhmadKaduna State University, Kaduna, Nigeria
Department of Computer Science, Kaduna State University, Kaduna, Nigeria
Author’s Email Address: [email protected]
ABSTRACT
This paper presents a virtualised network environment that serves as a stable and re-usable platform for the analysis of malware propagation. The platform, which has been developed using VMware virtualisation technology, enables the use of either a graphical user interface or scripts to create virtual networks, clone, restart and take snapshots of virtual machines, reset experiments, clean virtual machines and manage the entire infrastructure remotely. The virtualised environment uses open source routing software to support the deployment of intrusion detection systems and other malware attack sensors, and is therefore suitable for evaluating countermeasure systems before deployment on live networks. An empirical analysis of network worm propagation has been conducted using worm outbreak experiments on Class A size networks to demonstrate the capability of the developed platform.
Keywords: testbed, malware analysis, virtualisation
INTRODUCTION
Malicious software (malware) is a significant risk to the security of computer systems, particularly self-propagating malware (termed a worm) because of its highly virulent nature (Ahmad and Woodhead, 2015). To fully understand the propagation behaviour and infection patterns of computer network worms, security researchers need to have a safe and convenient environment that is isolated from the Internet in order to analyse the behaviour of this malicious software. Large scale network worm outbreak scenarios are difficult to simulate due to the complexity and resources required in setting up a controlled environment for worm propagation and countermeasure testing (Floyd and Paxson, 2001).
Thus, this article presents a virtualised network environment termed V-Network. V-Network has been developed with the aim of studying the infection and propagation patterns of network worms and testing a range of countermeasure systems. V-Network is platform independent, which makes it convenient for UNIX-based or Windows-based experimentation. Finally, V-Network has been designed with the capability of resetting and re-running experiments from a standard baseline in a controlled environment either using a graphical user interface or command line scripts.
The remainder of this article is organized as follows. Section 2 presents a summary of the related work to the study. Section 3 presents the design of the V-Network testbed. Section 4 presents a small range of worm experiments conducted using the V-Network testbed. Section 5 discusses the impact of the V-V-Network testbed. Section 6 concludes the study and identifies possible future work.
Related Works
A range of testing methods have been used to study the propagation of worms, such as simulation, emulation and virtualised systems.
Simulation systems use tools and processes to imitate and model a real network environment. Simulation is an accepted and widely used technology in studying the epidemic of network worms; examples of simulation tools include NS3 and SSFNet. The NS-3 simulator (Henderson et al., 2008) is an open-source simulation system that provides features including support for virtualisation software, scalability, modularity and tracing architecture. The Scalable Simulation Framework Network (SSFNet) simulator (Yoon and Kim, 2009) was developed with various network simulation applications and topologies, traffic and scalability. To enhance scalability and provide ease of use and distributed network simulation, Riley (2003) developed the Georgia Tech Network Simulator (GTNetS). Another powerful software simulation package is the Optimized Network Engineering Tool (OPNET). OPNET (Chang, 1999) is capable of simulating a large range of communication systems from a single LAN to global satellite networks and can be used for discrete event simulations. Despite advances in using parallel/distributed execution capabilities to develop datagram-level simulators, researchers have been unable to achieve a simulated network size similar to that of the IPv4 address space (Floyd and Paxson, 2001). This is due to the processing and memory requirements needed and limitation in modelling operating system features, however, they attained an improved level of fidelity (Perumalla and Sundaragopalan, 2004). Some simulation systems use a Finite State Machine (FSM) to represent a network node such as the Internet Worm Simulator (IWS) and Parallel Worm Simulator (PWS). Thus, these provide a high level of scalability and less resource requirement than datagram level simulators. IWS (Tidy and Woodhead, 2015) achieved a scale to the size of the IPv4 address space and PWS [9] provides good Internet topology at the autonomous system level. However, simulation systems have limitations in modelling the heterogeneity, topology and the granularity of the Internet (Wei et al., 2005). Simulation systems also exhibit limitations in scale, incur high processing and memory requirements and cannot model the full range of operating system features (Floyd and Paxson, 2001).
Emulation is to take the properties of a system and reproduce it with a different type of system. This allows the use of computing nodes and network links to form a system with more emulated elements than real elements. A node in the emulation system represents a real host running in the form of software. To achieve a large-scale emulation, multiple nodes can be instantiated on a single physical machine (Calheiros et al., 2010).
Emulation systems have the characteristics of simulation and real world systems and they have the potential to achieve high fidelity,
Fu
ll L
en
gt
h Rese
ar
ch
V-Network: A Testbed for Malware Analysis scale and effectiveness (Perumalla and Sundaragopalan, 2004).
Emulab (Hibler et al., 2008) and DETERLab (Perera et al., 2013) are some of the emulation systems which have been used by security researchers in the past. Emulab (Hibler et al., 2008) enables users to develop their experiments with a set of PCs connected in a customised topology via a graphical user interface and then load the desired operating system on to the PCs for experimentation. The DETERLab (Perera et al., 2013) enables user access to a specified set of nodes with custom operating system and allows experimentation with network topology using switches, firewalls, physical nodes, and offers attacks and defence tools. Emulation systems are generally better than simulation systems in scale and effectiveness because they allow for interaction with the operating system and serve as a compromise between simulation and real world systems. Nevertheless, emulation systems such as DETERLab and Emulab have a limited scale of experiments and physical resources available for users; therefore, they are not suitable for large scale experimentation of worm propagation and other network attacks (Perera et al., 2013). Additionally, emulation systems have performance drawbacks because each instruction on the guest system has to be translated by the software bridge for the host system (White and Pilbeam, 2010).
Virtualisation systems use the technique of separating resources and services from the underlying physical delivery to form an environment with virtual machines and other network infrastructure on a host. Virtualisation systems provide speed performance which is better than emulation systems because the guest hosts can directly access the physical host hardware (White and Pilbeam, 2010). Some existing virtualised testbeds include ViSe (Årnes et al., 2006), vGround (Jiang et al., 2006), V-NetLab (Sun et al., 2008) and VMT (Shahzad et al., 2013). ViSe is a virtualised platform developed to test malware attacks against a range of operating systems and evaluate them using intrusion detection systems. The testbed contains 10 operating systems and 40 exploits (both local and remote) against the programs running on the operating systems. vGround is an environment that comprises three virtual enterprise networks connected by three virtual routers capable of hosting hundreds of virtual machines. V-NetLab utilizes network virtualisation at the data-link layer in order to allow for the re-use of the same set of IP addresses in different virtual networks. V-NetLab is also designed to enable the virtual networks to be accessed remotely without the need for physical access to the hardware. VMT is a virtualised network testbed developed for zero-day worm analysis and countermeasure testing. The testbed comprises four enterprise networks with few a hundred virtual machines. Although virtualisation systems require relatively high computational resource in order to host a large number of virtual nodes, they have the potential to achieve high fidelity and effectiveness as noted by Perumalla and Sundaragopalan (2004). Perumalla and Sundaragopalan (2004) also noted that virtualised systems are not limited to scalability at the expense of an amount of computation power. Furthermore, White et al. (2010) noted that virtualisation systems provide speed performance better than emulation systems because the guest hosts can directly access the physical host hardware.
The V-Network Testbed
Design
The V-Network testbed contains four virtualised enterprise networks comprising a number of virtual network cells. The virtual network cells contain LANs with a DHCP server for IP address management, a DNS server for name resolution, an NTP server to provide a time synchronization service for the virtual hosts, a logging server to keep a record of worm infection activities and routers for internal routing services. The virtual enterprise networks are connected together using a border router to enable data communication and routing services across the internetwork. The design was chosen to study how worm infection spreads across multiple networks that are physically and geographically separated and to facilitate the deployment of countermeasure systems. Fig. 1 details the logical design of an enterprise network in the VNetwork testbed. The V-Network testbed uses the Quagga routing suite (Ishiguro et al., 2007) to provide routing services. The VMware vSphere 5.5 (Lowe, 2011) hypervisor has been used for virtualization services, which also comprises VMware vCenter
Server for remote management of the ESXi servers. VMware vSphere was chosen for the development of the V-Network testbed due to its strong performance in comparison to KVM, Xen and Microsoft Hyper-V in the utilization of CPU, memory disk I/O and network I/O as determined by Hwang et al. (2013).
The V-Network testbed has features such as:
• Fidelity: V-Network uses real-world operating systems, applications, and other networking software, which provides a platform that offers a realistic way of presenting the technology and applications. Unlike vGround that supports Linux-based worm experimentation only, VNetwork has been designed to be platform independent, i.e., it supports Windows-based and Linux-based worm experiments. • Scalability: The current implementation of the V-Network
supports 1200 virtual machines across four virtual enterprise
V-Network: A Testbed for Malware Analysis networks. The implementation of the V-Network framework
also supports the integration of physical and virtualised networks to increase the scale of the infrastructure. The V-Network has a scale larger than VMT reported by Shahzad et al. (2013) and ViSe reported by Arnes at al. (2006). • Management: V-Network provides utility scripts for
managing the infrastructure to facilitate malware experimentation such as re-usability, resetting and tearing down virtual machines. This enables the development of multiple sessions of different worm experiments quickly, contrary to VMT (Shahzad et al., 2013) that used a substantially manual method.
• Background traffic: Unlike VMT, vGround and ViSe, VNetwork provides support for replaying traffic collected in a .pcap file format as background traffic. The traffic can be replayed as collected or in a client-server communication fashion.
The V-Network testbed has been implemented using the following resources:
• Four servers running VMware ESXi 5.5 server for virtualization services, each with an Intel Core i7 (12 virtual cores at 3.40 GHz) processor, 64GB of RAM and 2TB of hard disk storage capacity.
• Two servers running the Quagga routing suite to provide routing services, each with an Intel Core i7 (8 virtual cores at 3.40GHz) processor, 24GB of RAM and 1TB of hard disk
storage capacity.
• A server running the NTP daemon for time synchronization across all hosts, with an Intel Core i7 (8 virtual cores at 3.40GHz) processor, 24GB of RAM and 1TB of hard disk storage capacity.
• A server running a custom-developed logging server daemon to keep record of host activities, with an Intel Core i7 (8 virtual cores at 3.40GHz) processor, 16GB of RAM and 1TB of hard disk storage capacity.
• A server running VMware vCenter server for managing the ESXi servers remotely, with an Intel Core i7 (8 virtual cores at 3.40GHz) processor, 16GB of RAM and 1TB of hard disk storage capacity.
• Two Ethernet switches.
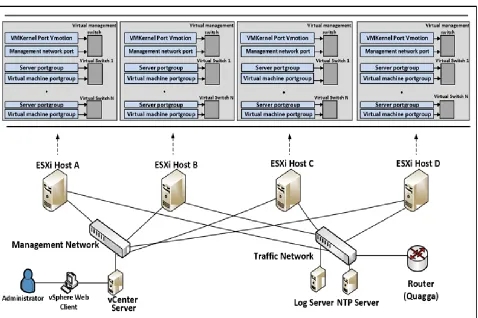
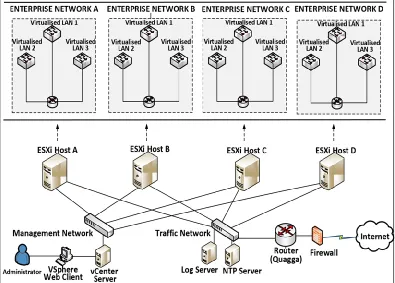
Fig. 2 presents the physical design of the V-Network testbed. Each ESXi server accommodates virtual machines in different “portgroups”. The portgroups are attached to virtual switches in order to form a number of virtualised LANs within the V-Network testbed. The management network has been configured to enable administrative control over the V-Network ESXi servers. The vSphere Web client is used to remotely monitor, control and manage the infrastructure through the vCenter Server using scripts or the GUI. The traffic network is used to provide other network services such as routing and time synchronization. The DMX is connected to the Internet through a firewall for NTP update prior to experimentation. Fig. 3 shows the logical design of V-Network.
Fig. 2: V-Network physical implementation
V-Network: A Testbed for Malware Analysis Fig. 3: V-Network physical and logical implementation
Worm Daemon
The V-Network testbed uses a worm daemon developed by Shahzad and Woodhead (2014) with the capabilities of facilitating a worm attack event using chosen worm characteristics. The worm system consists of both client and server modules capable of sending and receiving UDP datagrams. The client module is used to initiate a worm attack against desired targets. The virtual hosts are made susceptible by running the server module, which listens on a specific UDP port and then, after receiving an “infection” datagram, continuously transmits “infectious” UDP datagrams. Upon infection, a susceptible host will send its time stamp and IP address information to the logging server for record management. The logging server has been configured with a logging daemon that keeps the details of infected host addresses and infection time. This process will continue until full infection is achieved based on the details recorded on the logging server.
Configuration Scripts
To conduct an experiment, a base virtual machine is configured with the correct worm daemon and then cloned to the required number of virtual machines. The V-Network implementation comprises a number of customised utility scripts to facilitate large scale management of virtual machines. The utility scripts are Create-VMs, Start-VMs, Stop-VMs, PauseVMs, Resume-VMs, Snapshot-VMs, Reset-VMs, Move-VMs and Teardown-VMs.
Experimentation
This section presents the methodology used to evaluate the capability of the V-Network testbed using worm outbreak scenarios. The candidate worms employed were the Slammer worm and a contemporary worm that has been characterised
based on the ShellShock (CVE-2014-6271) (CVE, 2014) vulnerability of 2014. The section also details the experimental parameters used for the worm experiments and the results obtained.
The capability of the V-Network testbed was evaluated using worm propagation experiments. For Slammer, Moore et al. (2003) reported that the worm had a susceptible population of at least 75,000 hosts. They also noted that Slammer exhibited an average scan rate of 4000 datagrams per infected host per second and had a datagram size of 404 bytes. Ahmad and Woodhead (2015) reported the likely susceptible population and potential datagram size of the ShellShock vulnerability as having values of circa 42.5k and 2000 bytes respectively. Using the identified metrics along with the size of routable IPv4 address space (3,673,309,759 (Cotton and Vegoda, 2010)), the number of susceptible hosts per million Internet hosts for each pseudoworm was determined using equation 1.
𝑃𝑚= [(
𝑆𝑝
𝑅𝑖𝑝) ∗ 1,000,000] (1)
where
Pm denotes the value of susceptible hosts per million Internet
hosts,
Sp denotes the absolute number of susceptible hosts and Rip denotes the number of routable IPv4 addresses.
The results were 21 and 12 susceptible hosts per million Internet hosts for the Slammer and ShellShock pseudo-worms respectively. For experimentation in the V-Network, the values were scaled down depending on the number of required hosts. Three and five class A (224 IP addresses) size networks were
V-Network: A Testbed for Malware Analysis used for the Slammer and ShellShock pseudo-worms. The
resulting values are shown in equations 2 and 3 respectively.
[(224) ∗ 3 ∗ ( 21
1,000,000)] = 1057 (2)
[(224) ∗ 5 ∗ ( 12
1,000,000)] = 1007 (3)
Furthermore, the bandwidth available for an infected host and the worm datagram size determine how fast a worm can send datagrams. The average Internet connection speed was estimated to be within the range 10 Mbps to 1000 Mbps (NetIndex, 2014). Although it is impossible for a host to achieve the maximum speed of a network card, the vast majority of Internet connected hosts are capable of transmitting data at 60 Mbps for 120 Mbps (Chetty, 2014). Thus based on the assumption that the Internet connected hosts exhibit an average data transmission rate of 90 Mbps, the scan rate S, achievable for a single worm instance to transmit a datagram of size M (in bytes), over a C megabits Internet connection per second can be determined using 𝑠 = 𝐶
𝑀∗8. Therefore, the likely average scan rate for the ShellShock pseudo-worm is determined in equation 5.
(9,000,000
2000 ∗ 8) = 5625 datagrams per second (5)
The scan rates of the pseudo-worms were then scaled down by a factor of 32 and 45 for the Slammer and ShellShock pseudo-worms to avoid overloading server resources. The resulting scan rate employed in the experiments is 125 “infectious” datagrams per second for Slammer and ShellShock.
The reported worm propagation experiments were conducted by creating the required number of virtual machines for each pseudo-worm with the correct daemon. The virtual machines were then powered to automatically synchronize their time with the NTP server, and wait for inbound datagrams. The worm infection event was initiated by sending a UDP datagram to one of the vulnerable virtual machines. The virtual machines used Damn Small Linux (DSL) (DSL, 2014) as the operating system.
A virtual machine in each LAN was configured to regenerate network traffic collected in a. pcap file. The traffic regeneration process was facilitated using the tcpreplay (Turner and Bing, 2005) tool. The dataset used as background traffic during the experiments is the CAIDA ITDK (CAIDA, 2014) anonymised Internet data sets of 20/3/14, for two equinox backbones based in Chicago and San Jose. For each pseudo-worm experiment, a number of hosts (1057 for Slammer and 1007 for ShellShock) were configured with the correct daemon for worm attack datagrams while other hosts (one host in each LAN) were configured to replay the CAIDA ITDK anonymised traces as background traffic between endpoints across the V-Network internetwork.
Slammer Pseudo-worm
The Slammer pseudo-worm experiment was conducted using 1057 susceptible hosts across three class A size networks. The pseudo-worm daemon was configured to listen on UDP port 1434 and then transmit UDP datagrams to port 1434 at a scan rate of
125 “infectious” datagrams per second, once “infected”. Five Slammer pseudo-worm propagation experiments were conducted using one initially infected host. The Slammer pseudo-worm experiment was repeated with an initial hit-list (Staniford et al., 2002) of 10 and 20 hosts.
ShellShock Pseudo-worm
The ShellShock pseudo-worm experiment was conducted using 1006 susceptible hosts across five class A size networks. The pseudo-worm daemon was configured to listen on UDP port 8080 and then transmit UDP datagrams to port 8080 at a scan rate of 125 “infectious” datagrams per second, once “infected”. Five ShellShock pseudo-worm experiments were conducted using one initially infected host. As with Slammer, the ShellShock-based worm experiment was repeated with a hit-list (Staniford et al., 2002) of 10 and 20 hosts.
RESULTS AND DISCUSSION
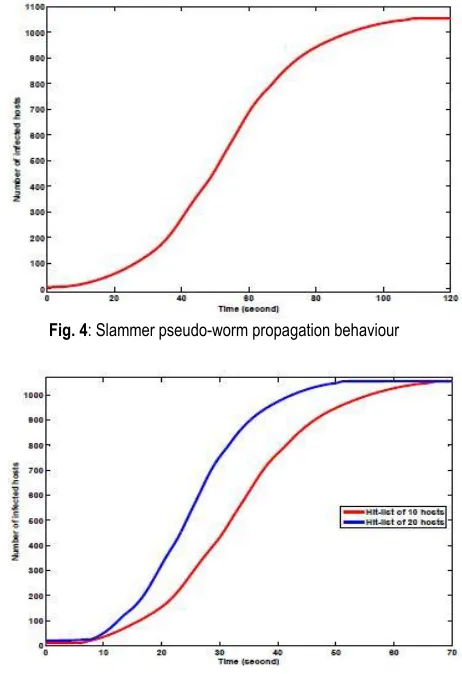
The results of the experiments were scaled up by a factor of 32 and 45 for the Slammer and ShellShock pseudo-worms respectively. The Slammer pseudo-worm propagation infected 95% (1004) of the hosts in 90 seconds as shown in Fig. 4. Additionally, the Slammer pseudo-worm infected 95% (1004) of the hosts in 55 seconds using a hit-list of 10 hosts as shown in
Fig. 4: Slammer pseudo-worm propagation behaviour
Fig. 5: Slammer pseudo-worm propagation using hit-lists
V-Network: A Testbed for Malware Analysis Fig. 5, and also infected 95% of the population 45 seconds using
a hit-list of 20 hosts.
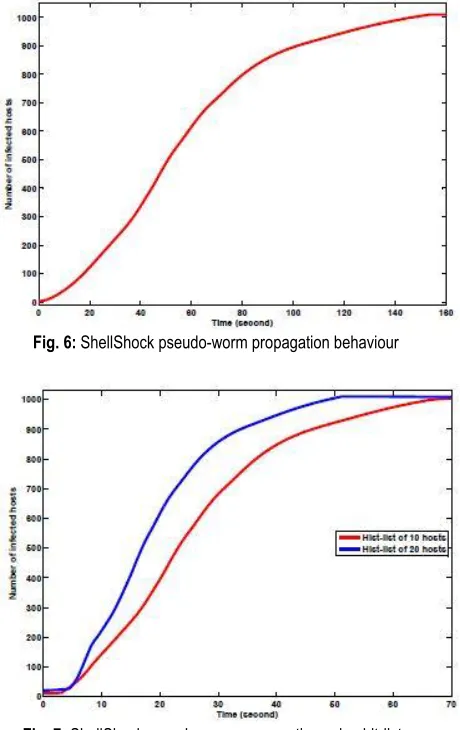
For ShellShock propagation, the worm infected 95% (956) of the hosts in 130 seconds as shown in Fig. 6. With the hit-lists of 10 and 20 hosts, ShellShock infected 95% of the hosts in 56 seconds and 40 seconds respectively as shown in Fig. 7. Thus, the V-Network testbed has demonstrated the capability of providing a stable and convenient environment for malware analysis. The isolation of the V-Network testbed from the Internet makes live networks safe during the worm outbreak experiments. The V-Network testbed has also demonstrated the ability to support different worm outbreak experiments.
Fig. 6: ShellShock pseudo-worm propagation behaviour
Fig. 7: ShellShock pseudo-worm propagation using hit-lists
Conclusion
This paper has reported a virtualised environment, which has been termed V-Network, for the analysis of network worm propagation and testing of countermeasure systems. The V-Network testbed has a scale of 1200 virtual machines across multiple virtual networks. The performance of V-Network was tested using a previously known worm outbreak scenario, and a contemporary worm scenario that was characterised based on the ShellShock vulnerability of 2014. The results show that the V-Network testbed is a stable and convenient platform for the analysis of malware propagation.
In terms of future work, the V-Network testbed will be further employed to analyse other malware infection behaviours, network attacks and testing of countermeasure systems. Although, V-Network can be integrated with physical networks, there is also scope for the scale of the testbed infrastructure to be further enhanced.
REFERENCES
Ahmad M. A. and Woodhead S. (2015) Containment of Fast Scanning Computer Network Worms. In Internet and Distributed Computing Systems, volume 9258 of Lecture Notes in Computer Science, pages 235–247. Springer International Publishing, 2015.
Årnes A., Haas P., Vigna G. and Kemmerer R. A. (2006) Digital Forensic Reconstruction and the Virtual Security Testbed Vise. In Detection of Intrusions and Malware & Vulnerability Assessment, pages 144–163. Springer, 2006.
CAIDA (2014) The Internet Topology Data Kit. [Online]. Accessed
on 11th November 2014. Avalable:
http://www.caida.org/data/passive.
Calheiros R. N., Buyya R. and César A. F. D. (2010) Building an Automated and Self-Configurable Emulation Testbed for Grid Applications. Software: Practice and Experience, 40(5):405–429, 2010.
Chang X. (1999) Network Simulations with OPNET. In Proceedings of the 31st conference on Winter simulation: Simulation—a bridge to the Future-Volume 1, pages 307– 314. ACM, 1999.
Chetty M., Haslem D., Baird A., Ofoha U., Sumner B. and Grinter R. (2011) Why Is My Internet Slow?: Making Network Speeds Visible. In Proceedings of the SIGCHI Conference on Human Factors in Computing Systems, pages 1889– 1898. ACM, 2011.
Cotton M. and Vegoda L. (2010) Special Use IPv4 Addresses. Technical report, BCP 153, RFC 5735, January, 2010. CVE (2014), Common Vulnerabilities and Exposures. [Online].
Accessed on 19th October 2014.
https://cve.mitre.org/cgibin/cvename.cgi?name=CVE-2014-6271.
DSL (2014) Damn Small Linux. [Online]. Accessed 19th October 2014. Available: http://www.damnsmalllinux.org/.
Floyd S. and Paxson V. (2001) Difficulties in Simulating the Internet. IEEE/ACM Transactions on Networking (TON), 9(4):392–403, 2001.
Henderson T. R., Lacage M., Riley G. F., Dowell C. and Kopena J. B. (2008) Network Simulations with The Ns-3 Simulator. SIGCOMM demonstration, 14, 2008.
Hibler M., Ricci R., Stoller L., Duerig J., Guruprasad S., Stack T., Webb K. and Lepreau J. (2008) Large Scale Virtualization in The Emulab Network Testbed. In USENIX Annual Technical Conference, pages 113–128, 2008.
Hwang J., Zeng S., Wu F. Y., and Wood T. (2013) A Component Based Performance Comparison of Four Hypervisors. In Integrated Network Management (IM 2013), 2013 IFIP/IEEE International Symposium, pages 269–276, May 2013. Jiang X., Xu D., Wang H. and Spafford E. (2006) Virtual
Playgrounds for Worm Behaviour Investigation. In Recent Advances in Intrusion Detection, pages 1–21. Springer, 2006.
Ishiguro K., Takada T., Ohara T., Zinin A. D., Natapov G. and Mizutani A. (2007) Quagga Routing Suite, 2007.
V-Network: A Testbed for Malware Analysis Lowe S. (2011) Mastering VMware vSphere 5. John Wiley &
Sons, 2011.
Moore D., Paxson V., Savage S., Shannon C, Staniford S. and Weaver N. (2003) Inside The Slammer Worm. IEEE Security & Privacy, (4):33–39, 2003.
NetIndex (2014) [Online]. Accessed 16 November 2014. Available: http://www.netindex.com/. Perera G., Miller N., Mela J., McGarry M. P. and Acosta J. C.
(2013) Emulating Internet Topology Snapshots in DeterLab. In Proceedings of the Third ACM Conference on Data and Application Security and Privacy, pages 165–168. ACM, 2013.
Perumalla K. S. and Sundaragopalan S. (2004) High-Fidelity Modeling of Computer Network Worms. In Computer Security Applications Conference, 2004. 20th Annual, pages 126–135. IEEE, 2004.
Riley G. F. (2003) The Georgia Tech Network Simulator. In Proceedings of the ACM SIGCOMM workshop on Models, methods and tools for reproducible network research, pages 5–12. ACM, 2003.
Shahzad K and Woodhead S. (2014) A Pseudo-Worm Daemon (PWD) For Empirical Analysis of Zero-Day Network Worms and Countermeasure Testing. In Computing, Communication and Networking Technologies (ICCCNT), 2014 International Conference on, pages 1–6. IEEE, 2014. Shahzad K., Woodhead S. and Bakalis P. (2013) A Virtualized
Network Testbed for Zero-Day Worm Analysis and Countermeasure Testing. In Advances in Security of Information and Communication Networks, pages 54–64. Springer, 2013.
Staniford S, Paxson V, Weaver N. (2002) How to Own the Internet in Your Spare Time. In USENIX Security Symposium, pages 149–167, 2002.
Sun W., Katta V., Krishna K. and Sekar R. (2008) V-Netlab: An Approach for Realizing Logically Isolated Networks for Security Experiments. CSET, 8:1–6, 2008.
Tidy L., Woodhead S. and Wetherall J. (2015) Simulation of Zeroday Worm Epidemiology In The Dynamic, Heterogeneous Internet. The Journal of Defense Modeling and Simulation: Applications, Methodology, Technology, 12(2):123–138, 2015.
Turner A. and Bing M. (2005) TCPreplay: Pcap Editing and Replay Tools. online], http://www.tcpreplay.sourceforge.net, 2005.
Wei S., Mirkovic J. and Swany M. (2005) Distributed Worm Simulation with A Realistic Internet Model. In Proceedings of the 19th Workshop on Principles of Advanced and Distributed Simulation, pages 71–79. IEEE Computer Society, 2005.
White J and Pilbeam A. (2010) A survey of virtualization technologies with performance testing. arXiv preprint arXiv:1010.3233, 2010.
Yoon S and Kim Y. B. (2009) A Design of Network Simulation Environment Using SSFNET. In Advances in System Simulation, SIMUL’09. First International Conference on IEEE, pages 73–78, 2009.