DOI: 10.5958/0976-4666.2017.00022.5 ©2017 EA. All rights reserved
Profitability Analysis of Broiler Farms: A Case Study of
Sonitpur District of Assam
Monisha Borah
*and R.A. Halim
Department of Agricultural Economics & Farm Management, Assam Agricultural University, Jorhat, Assam, India Corresponding author: monisha.borah@gmail.com
ABSTRACT
Present paper is an attempt to investigate production performance, cost and return structure pertaining to broiler farming and undertake investment appraisal in terms of PBP, NPV, IRR and BCR. The cost and return analysis of different sizes of broiler farms in Sonitpur District of Assam has been carried out based on the primary data collected from 100 broiler farmers for the period from March 2012 to May 2012. The study revealed that average meat production per bird per cycle was 2.18 kilogram. Average cost of production per bird was ` 134.66. Total fixed and variable cost per bird was found to be ` 9.11 and
` 125.55 respectively. On an average gross return and net return per farm per cycle were ` 374518.14, and
` 68702.59 respectively for the sample as a whole. There was a positive relationship between per bird net return and farm size which increased from ` 19.82 in Group I to ` 33.21 in Group IV. On the basis of NPV, BCR and IRR, investment in broiler farming was found to be most profitable in large sized farms, than smaller farms, although investment was economically paying in all the farms. Sensitivity analysis revealed that small sized farms were more sensitive to increase in cost and decrease in returns.
Keywords: Broiler farms, Payback period (PBP), Net present value (NPV), Internal rate of return (IRR), Benefit- cost ratio (BCR), Sensitivity analysis
In India, development of dairy, poultry and other livestock always claims priority consideration as complimentary, supplementary and special instrument for over all development of the agricultural sector as well as economy in general and for employment generation, alleviation of rural poverty and attainment of nutritional security in particular. Poultry sector in India has witnessed a spectacular growth within a few decades.
Compared to egg industry broiler industry recorded a still faster growth. Broiler farming today is one of the most attractive businesses among the agri based industries and this popularity can be attributed to the high feed conversion efficiency of broiler bird, low initial investment, less rearing space requirement, faster return and lesser risk involved compared to layer operation due to shorter span of the operation cycle etc. Depending on the farm size, broiler farming can be the principal source of family
income or can provide subsidiary income and employment to farmers specially small, marginal and landless ones throughout the year. Poultry and broiler rearing assumes special significance in the state of Assam due to land fragmentation, mass of small and marginal farmers and large scale unemployment in the rural areas coupled with vast majority of non vegetarian population. Towards the middle of 80s, there was a drift to open broiler farms in commercial scale in Assam, and a number of new broiler farms started in and around Guwahati, Tezpur, Tinisukia, and Dibrugarh etc.
viability of the enterprise, income generation potential as well as to handle probable risks. Thus, the study has been undertaken to highlight various economic aspects of broiler farming concerning profitability and economic viability in Sonitpur district of Assam with the some specific objectives. These are (1) to overview the existing production level of broiler meat of different broiler breeds and by-products in broiler farming, (2) to estimate the cost of the production and returns from broiler farming and (3) to carry out investment appraisal for studying economic viability and analysing profitability of broiler farming as an enterprise.
DATABASE AND METHODOLOGY
The study was conducted in Sonitpur district of Assam. The sampling design followed for the study was stratified random sampling design. The district was selected for the study as it had a high concentration of broiler farms operating as a source of both principal and subsidiary income and employment. In the next stage, all commercial broiler farms in Sonitpur district, which had been in production continuously for at least one year, were identified with the help of officials of the District Veterinary Department, hatchery personnel, feed manufacturers, poultry service representatives, dealers and unions of poultry farmers in the district. Out of the total farms identified, 20 per cent of the broiler farms accounting for approximately 100 in numbers, where proper basic records are being maintained were selected at random for the study. The sample broiler farms thus selected were again stratified into four size groups by the cumulative frequency distribution method. Total frequency being 100, the groups were so constructed that each group composed roughly of equal numbers of farms. The stratification is shown as follows:
Size groups Number of
farms in the groups
Percentage of the total sample
broiler farms
(a) Group I (up to 500) 25 25
(b) Group II (501-1500) 26 26
(c) Group III
(1501-3000) 26 26
(d) Group IV (3001 and
above) 23 23
All farms 100 100
The relevant primary data containing information on various costs involved, production and returns from broiler farming and other economic aspects, pertaining to the year 2011-12 were collected from the selected broiler farmers with the help of specially designed pre-tested schedules and questionnaires through personal interview with the respondent farmers.
In the current study, data on production, cost and returns relate to one production cycle and as such relevant calculations are done considering one production cycle of 6 weeks (Kalita, 2011). The major analytical tool employed for the study was tabular analysis, which includes tabulation of collected data using simple averages and percentages in order to facilitate easy comparison. The cost of production in broiler farming was calculated by computing variable cost, fixed cost and total cost incurred per cycle along with fixed capital investment; while returns included gross return, net return and returns over variable cost. For studying the economic viability of broiler farms, pay-back period, net present value, benefit-cost ratio and internal rate of return were calculated using standard procedures. Moreover, a sensitivity analysis in regard to investment appraisal was carried out for 5 per cent increase in cost, 5 per cent decrease in return and 5 per cent increase in cost and 5 per cent decrease in return together for the entire sample.
RESULTS AND DISCUSSION
cycle, though there was not very striking difference between the breeds in this respect as revealed by the sample farmers.
Among the by-products, on an average, amount of manure produced per bird per cycle was 2.65 kilograms in the entire sample, while the same in group I, II, III and IV were 2.87, 2.58, 3.04 and 2.45 kilograms respectively. Average per farm production of manure in the sample was 6019.21 kilograms per cycle. On an average, total number of gunny bags disposed per cycle per farm was 160.04 and group wise the same was 28.52, 74.31, 172.31 and 386.04 in group I, II, III and IV respectively.
The cost of broiler production in terms of variable cost, fixed cost and total cost incurred per cycle were worked out and presented in Table 2 and Table 3. On an average total variable cost incurred per farm and per bird across the entire sample were found out to be `285128.53 and `125.55 respectively per cycle. Total variable cost per bird per cycle was highest in Group I and lowest in Group IV showing a decreasing trend along with increasing farm size group. Similar results were also reported by Sing et al. (2010). Among the different constituents of variable cost more than half (67.89 per cent) of
the total variable cost were covered by feed cost alone. This is in agreement with earlier findings of Rangareddy et al. (1997), Bora and Bora (2000), Bhandari (2001) and Shrivastava et al. (2002) etc. The second most important item of variable cost in terms of their percentage contribution to total variable cost was cost of chicks (20.14 per cent). Feed and chick cost together contributed about 88.03 per cent of the total variable cost in broiler farming. Singh et al. (2010), Shaikh and Zala (2011) etc. observed similar results in their respective studies. On an average total fixed cost incurred per farm and per bird were ` 20687.54 and ` 9.11 per cycle respectively for the entire sample (Table 3). Per bird total fixed cost per cycle was highest in Group II (` 11.67) and lowest in Group IV (` 8.21).
Among different fixed cost components wages of permanently hired labour constituted about half (49.66 per cent) of the total fixed cost. The total cost of production per bird per cycle was noted as ` 134.66 in the entire sample. Size group analysis showed that the total cost of production per bird per cycle were ` 143.54, ` 138.23, ` 135.40 and ` 132.78 in Group I, II, III and IV respectively.
Table 1: Production of broiler meat (live weight basis) and by – products per cycle across various size groups of sample farms
Size group No. of farms No. of birds Meat production (Kg) Manure (Kg)Production of by - productsGunny bags (No.)
Group I 25 9700
20892.40 27839.00 713.00
(835.68) (1113.56) (28.52)
*2.15 *2.87 *0.073
Group II 26 28400
61167.40 73272.00 1932.00
(2352.59) (2818.15) (74.31)
*2.15 *2.58 *0.068
Group III 26 64000
138221.10 194560.00 4480.00
(5316.20) (7483.08) (172.31)
*2.16 *3.04 *0.070
Group IV 23 125000
273920.40 306250.00 8879.00
(11909.58) (13315.22) (386.04)
*2.19 *2.45 *0.071
All groups 100 227100
494201.30 601921.00 16004.00
(4942.01) (6019.21) (160.04)
*2.18 *2.65 *0.071
Table 3 also reveals that variable cost contributed 93.24 per cent to the total cost of production and the rest 6.76 per cent by the fixed cost in the entire sample. Thus variable cost constituted a lion share of the total cost of broiler production. Pant et al. (2004), Ganesh and Rai (2006), Rajendran et al. (2008), Shaikh and Zala (2011) etc. have drawn similar conclusions from the findings of their respective studies.
Fig. 1 shows a comparison of per bird variable and total cost among different size groups of sample farms. It was clearly observed from the figure that per bird total and variable cost has a decreasing trend along the increasing size groups of farms, thus showing an inverse relationship with the farm sizes. Similar findings were also revealed by previous workers like Chhikara and Singh (1989), Sharma et al. (1991), Singh et al. (2010) etc. It was evident from the figure that small sized farms operate on higher variable and total costs as compared to large
sized farms. Thus, it can be concluded that the total cost per bird decreased with increase in farm size, indicating the existence of economies of scale on large sized farms.
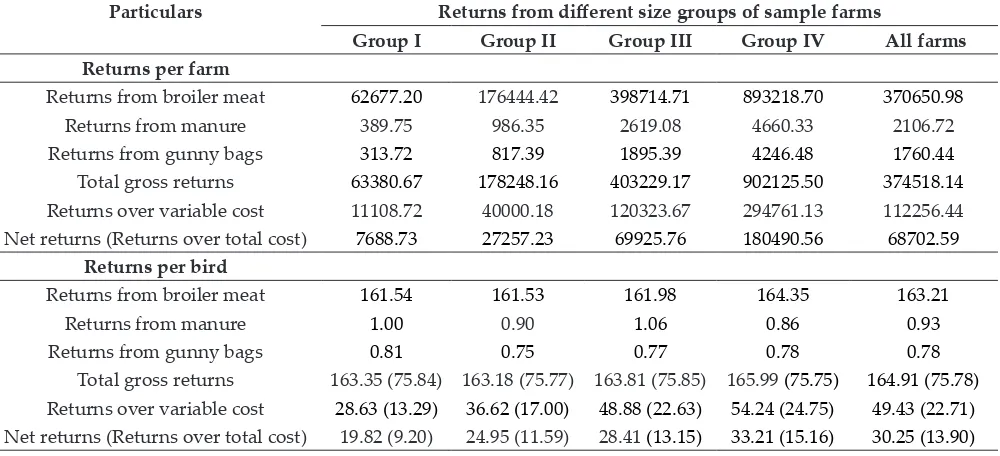
Total gross return from broiler farming includes return from meat and return from by products. On an average gross return, return over variable cost and net return per farm per cycle in the entire farm were worked out as ` 374518.14, ` 112256.44 and ` 68702.59 respectively for the sample as a whole (Table 4). Size group analysis revealed that gross returns per farm was highest in Group IV (` 63380.67) followed by Group III (` 178248.16), Group II (` 403229.170 and Group I (` 902125.50) respectively. Total gross return, return over variable cost and net return per bird per cycle were worked out as ` 164.91, ` 49.43 and ` 30.25 respectively and the same on per kilogram live weight basis were ` 75.78, ` 22.71 and ` 13.90 respectively.
Table 2: Total variable cost incurred per cycle by different size groups of broiler farms (rupees)
Cost items Cost incurred (`) by different farm size groups
Group I Group II Group III Group IV All farms
Per farm variable cost
Cost of labour 4282.80 (8.19) 2524.62 (1.83) 2435.77 (0.79) 5096.09 (0.75) 3532.50 (1.24) Cost of feed 34318.62 (65.65) 94584.18 (68.42) 209458.59 (67.73) 460597.86 (68.03) 193568.28 (67.89)
Cost of chick 9850.50 (18.84) 27646.31 (20.00) 62252.33 (20.13) 137320.21 (20.28) 57419.92 (20.14)
Cost of medication 1017.56 (1.95) 2945.26 (2.13) 6375.36 (2.06) 13860.81 (2.05) 5865.74 (2.06)
Cost of litter 787.76 (1.51) 1639.19 (1.19) 3595.38 (1.16) 7080.29 (1.05) 3186.39 (1.12) Cost of electricity 603.04 (1.15) 2964.35 (2.14) 9857.45 (3.19) 20075.08 (2.97) 8101.70 (2.84)
Transportation cost 694.56 (1.33) 2608.73 (1.89) 8301.54 (2.68) 17934.78 (2.65) 7135.31 (2.50)
Misc. Cost 181.32 (0.35) 1918.31 (1.39) 3794.50 (1.23) 8110.70 (1.20) 3396.12 (1.19)
Interest on working capital @ 9% 535.79 (1.03) 1417.04 (1.03) 3169.72 (1.03) 6939.42 (1.03) 2922.57 (1.03)
Total variable cost 52271.95 138247.99 309240.63 677015.23 285128.53
Per bird variable cost
Cost of labour 11.04 2.31 0.99 0.94 1.56
Cost of feed 88.45 86.59 85.09 84.75 85.23
Cost of chick 25.39 25.31 25.29 25.27 25.28
Cost of medication 2.62 2.70 2.59 2.55 2.58
Cost of litter 2.03 1.50 1.46 1.30 1.40
Cost of electricity 1.55 2.71 4.00 3.69 3.57
Transportation cost 1.79 2.39 3.37 3.30 3.14
Misc. Cost 0.40 1.76 1.54 1.49 1.50
Interest on working capital @ 9% 1.38 1.30 1.29 1.28 1.29
Total variable cost 134.72 126.57 125.63 124.57 125.55
115.00 120.00 125.00 130.00 135.00 140.00 145.00
Group I Group II Group III Group IV 134.72
126.57 125.63
124.57 143.54
138.23
135.40
132.78 Variable cost (rupees)
Total cost (rupees)
Fig. 1: Per Bird Variable and Total Cost among Different Size Groups of Sample Farms (`)
A comparison of gross and net returns per bird among different size groups of sample farms were shown in Fig. 2 to show their pattern of variation among different size groups. A perusal of Fig. 2 revealed that there was an increasing trend in gross return per bird along increased farm size group with exception in case of Group II. It was also evident from the figure that there was a positive relationship between per bird net return and farm size which increased from ` 19.82 in Group I to ` 24.95 in Group II, ` 28.41 in Group III and to ` 33.21 in Group IV. The increasing trend of net income with farm size could mainly be attributed to operation of economies of scale in large sized farms coupled with efficient utilization of resources. Other studies conducted by Mohsin et al. (2008), Singh et al. (2010) and Shaikh and Zala (2011) etc. also reported that the average net returns per bird increased with increase in farm size.
Investment appraisal is the process of determining the profitability of an investment. In the present study investment appraisal of broiler farms was carried out to study the economic viability of the investments in broiler farming. The profitability of broiler farming as an enterprise was studied through cash flow analysis throughout the life of investment. Different investment appraisal tools like payback period (PBP), benefit – cost ratio (BCR), net present value (NPV) and internal rate of return (IRR) were computed to accomplish investment appraisal and examine economic viability of broiler farming. Financial analysis for investment appraisal was conducted by making the following assumptions to facilitate computation of the investment appraisal tools.
Economic life of the project: The average useful life of the infrastructure (sheds and other buildings) and hence the enterprise was assumed to be 20 years on the basis of information provided by the farmers. Construction period: The construction of broiler sheds and buildings were assumed to be completed within the first year and arrival of first batch of day old chick commenced in the first month of second year.
Economic life of equipments: The economic life of equipments was assumed to be 10 years. Accordingly replacements of equipments have been provided for.
0.00 20.00 40.00 60.00 80.00 100.00 120.00 140.00 160.00 180.00
Group I Group II Group III Group IV 163.35 163.18 163.81 165.99
19.82 24.95 28.41
33.21
Gross return (rupees) Net return (rupees)
Fig. 2: Per Bird Gross and Net Return among Different Size Groups of Sample Farms (`)
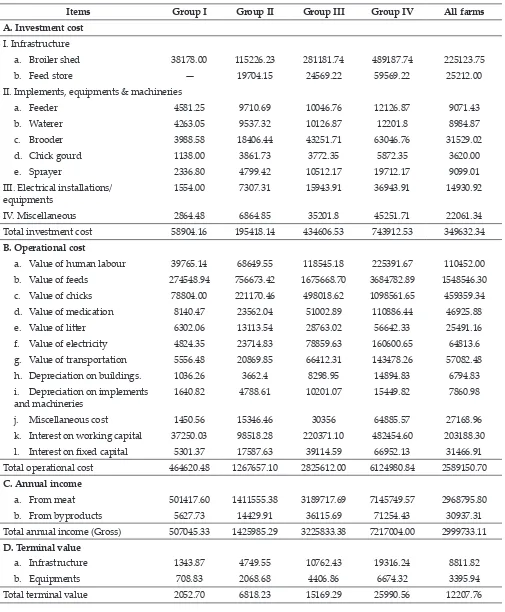
farms were worked out. From the pattern of fixed capital investment for different broiler farm sizes it is revealed that total fixed investment per farm was maximum on Group IV (` 743912.53), followed by Group III (` 434606.53), Group II (` 195418.14) and Group I (` 58904.16) with the overall average of ` 349632.34. The broiler shed was the main item of cost in case of total investment cost. Total operational cost per farm per year were computed as ` 464620.48, 1267657.10, 2825612.00 and 6124980.84 for Group I, II, III and IV, respectively with an overall average of ` 2589150.70 for the entire sample. Total gross annual income per farm was worked out
to be ` 2999733.11. Terminal value of infrastructure and equipments together were found out to be ` 2052.70, 6818.23, 15169.29 and 25990.56 for the groups I, II, III and IV respectively with the average of ` 12207.76 for the entire sample (Table 5). The data on payback period, net present value, benefit – cost ratio and internal rate of return of investments in sample broiler farms of different size are given in Table 6. The whole cash flow analysis was also reworked to see what happens under the circumstances of decreased net cash flow as a result of decrease in gross returns and increase in gross cost etc. as a part of sensitivity analysis. As such in Table 3: Total cost incurred per cycle by different size groups of broiler farms (`)
Cost items Cost incurred (`) by different farm size groups
Group I Group II Group III Group IV All farms
Per farm total cost Depreciation on implements &
machineries 205.10 (6.00) 598.58 (4.70) 1275.13 (5.30) 1931.23 (4.33) 982.62 (4.75) Depreciation on buildings 129.53 (3.79) 457.80 (3.59) 1037.37 (4.31) 1861.85 (4.17) 849.35 (4.11) Wages of permanently hired labour 687.84 (20.11) 6056.58 (47.53) 12382.38 (51.46) 23077.87 (51.72) 10274.00 (49.66)
Land revenue 0.23 (0.007) 0.44 (0.003) 0.71 (0.003) 1.12 (0.003) 0.61 (0.003) Imputed rental value of own farm 1481.45 (43.32) 3029.71 (23.78) 4350.54 (18.08) 9312.87 (20.87) 4431.19 (21.42)
Rent paid for leased in farm 305.82 (8.94) 576.06 (4.52) 515.80 (2.14) 732.93 (1.64) 528.91 (2.56) Interest on fixed capital @ 9% per
annum 610.02 (17.84) 2023.78 (15.88) 4500.86 (18.70) 7704.08 (17.27) 3620.85 (17.50)
Total fixed cost (A) 3419.99
*6.14
12742.94 *8.44
24062.78 *7.22
44621.96 *6.18
20687.54 *6.76 Total variable cost (B) 52271.95
*93.86
138247.99 *91.56
309240.63 *92.78
677015.23 *93.82
285128.53 *93.24
Total cost (A+B) 55691.94 150990.93 333303.42 721637.18 305816.07
Per bird total cost Depreciation on implements &
machineries 0.53 0.55 0.52 0.36 0.43
Depreciation on buildings 0.33 0.42 0.42 0.34 0.37
Wages of permanently hired labour 1.77 5.54 5.03 4.25 4.25
Land revenue ** ** ** ** **
Imputed rental value of own farm 3.82 2.77 1.77 1.71 1.95
Rent paid for leased in farm 0.79 0.53 0.21 0.13 0.23
Interest on fixed capital @ 9% per
annum 1.57 1.85 1.83 1.42 1.59
Total fixed cost (A) 8.81 11.67 9.78 8.21 9.11
Total variable cost (B) 134.72 126.57 125.63 124.57 125.55
Total cost (A+B) 143.54 138.23 135.40 132.78 134.66
Figures within parentheses indicate percentage to total fixed cost
the present study sensitivity analysis was carried out under three situations namely situation I: when cost increases by 5 per cent, situation II: when return decreases by 5 per cent and situation III: when both cost increases by 5 per cent and return decreases by 5 per cent simultaneously.
From the table, pay back period was found to be highest in Group I (1.39 years), followed by Group II (1.23 years), Group III (1.09 years) and Group IV (0.68 years) with an overall average of 0.85 years for the entire sample. Thus small broiler farms took longer time to cover up their initial investments as compared to large sized farms. However, in general PBP in the entire sample is low because of low initial investment, which is a characteristic feature of broiler farming. When costs were increased by 5 per cent the PBP for the sample as a whole became 1.24 years. When returns decreased by 5 per cent, the PBP for the sample became 1.34 years and when both costs were increased by 5 per cent and returns were decreased by 5 per cent, PBP became 2.67 years for the whole sample. However, in situation III net cash flow for Group I became negative and thus calculation of PBP became meaningless as the investment could not even recover the operational cost, let alone the initial investment on the project. To be financially viable, the net present value of any investment should be greater than zero. Table
6 reveals that the NPV was highest in Group IV, followed by Group III, II and I, showing an increasing trend with the increase in farm size. However, the investments in all farm- sizes turned out to be an economically viable as the NPV was positive in all the farms. So, the NPV in the present analysis shows that the enterprise is a high profit making enterprise and thus it justifies the financial feasibility of investment in the enterprise. This is in agreement with the earlier observation of Singh et al. (2010). According to sensitivity analysis in all the situations NPV were positive for all the groups except Group I under situation III i.e. when both costs were increased by 5 per cent and returns decreased by 5 per cent. Hence farms in Group I became economically non-viable under situation III. Benefit – cost ratio was computed to be 1.13 for the entire sample. It could be observed from Table 6, that the value of BCR was 1.07, 1.10, 1.11 and 1.16 in Group I, II, III and IV, showing an increasing trend with the increase in farm size. Thus, large sized farms were economically more viable in regards to BCR. Sensitivity analysis showed that BCR was greater than one for all farm sized group under situation I and II. However, under situation III, it became less than one (0.97) in Group I and exactly one for Group II, indicating non viability of these two groups under situation III. Group III Table 4: Returns from broiler farming per cycle in different size groups of sample farms (`)
Particulars Returns from different size groups of sample farms
Group I Group II Group III Group IV All farms
Returns per farm
Returns from broiler meat 62677.20 176444.42 398714.71 893218.70 370650.98
Returns from manure 389.75 986.35 2619.08 4660.33 2106.72
Returns from gunny bags 313.72 817.39 1895.39 4246.48 1760.44
Total gross returns 63380.67 178248.16 403229.17 902125.50 374518.14
Returns over variable cost 11108.72 40000.18 120323.67 294761.13 112256.44
Net returns (Returns over total cost) 7688.73 27257.23 69925.76 180490.56 68702.59
Returns per bird
Returns from broiler meat 161.54 161.53 161.98 164.35 163.21
Returns from manure 1.00 0.90 1.06 0.86 0.93
Returns from gunny bags 0.81 0.75 0.77 0.78 0.78
Total gross returns 163.35 (75.84) 163.18 (75.77) 163.81 (75.85) 165.99 (75.75) 164.91 (75.78)
Returns over variable cost 28.63 (13.29) 36.62 (17.00) 48.88 (22.63) 54.24 (24.75) 49.43 (22.71)
Net returns (Returns over total cost) 19.82 (9.20) 24.95 (11.59) 28.41 (13.15) 33.21 (15.16) 30.25 (13.90)
Table 5: Per farm investment cost, operational cost, annual income and terminal value in the sample broiler farms by size groups (`)
Items Group I Group II Group III Group IV All farms
A. Investment cost I. Infrastructure
a. Broiler shed 38178.00 115226.23 281181.74 489187.74 225123.75
b. Feed store — 19704.15 24569.22 59569.22 25212.00
II. Implements, equipments & machineries
a. Feeder 4581.25 9710.69 10046.76 12126.87 9071.43
b. Waterer 4263.05 9537.32 10126.87 12201.8 8984.87
c. Brooder 3988.58 18406.44 43251.71 63046.76 31529.02
d. Chick gourd 1138.00 3861.73 3772.35 5872.35 3620.00
e. Sprayer 2336.80 4799.42 10512.17 19712.17 9099.01
III. Electrical installations/
equipments 1554.00 7307.31 15943.91 36943.91 14930.92
IV. Miscellaneous 2864.48 6864.85 35201.8 45251.71 22061.34
Total investment cost 58904.16 195418.14 434606.53 743912.53 349632.34
B. Operational cost
a. Value of human labour 39765.14 68649.55 118545.18 225391.67 110452.00
b. Value of feeds 274548.94 756673.42 1675668.70 3684782.89 1548546.30
c. Value of chicks 78804.00 221170.46 498018.62 1098561.65 459359.34
d. Value of medication 8140.47 23562.04 51002.89 110886.44 46925.88
e. Value of litter 6302.06 13113.54 28763.02 56642.33 25491.16
f. Value of electricity 4824.35 23714.83 78859.63 160600.65 64813.6
g. Value of transportation 5556.48 20869.85 66412.31 143478.26 57082.48
h. Depreciation on buildings. 1036.26 3662.4 8298.95 14894.83 6794.83
i. Depreciation on implements
and machineries 1640.82 4788.61 10201.07 15449.82 7860.98
j. Miscellaneous cost 1450.56 15346.46 30356 64885.57 27168.96
k. Interest on working capital 37250.03 98518.28 220371.10 482454.60 203188.30
l. Interest on fixed capital 5301.37 17587.63 39114.59 66952.13 31466.91
Total operational cost 464620.48 1267657.10 2825612.00 6124980.84 2589150.70
C. Annual income
a. From meat 501417.60 1411555.38 3189717.69 7145749.57 2968795.80
b. From byproducts 5627.73 14429.91 36115.69 71254.43 30937.31
Total annual income (Gross) 507045.33 1425985.29 3225833.38 7217004.00 2999733.11
D. Terminal value
a. Infrastructure 1343.87 4749.55 10762.43 19316.24 8811.82
b. Equipments 708.83 2068.68 4406.86 6674.32 3395.94
and Group IV farms were financially viable under this situation as well.
Internal rate of return is the discount rate that makes the net present value equal to zero. Internal rate of return for the entire farm was estimated to be 117.02 per cent. IRR also exhibited an increasing trend with the increase in farm size (Table 6). Thus, IRR was found to be much higher than the existing bank rate or opportunity cost of investment. The high percentage of IRR can be attributed to the low investment cost required in broiler farming as compared to other similar enterprises, which is a characteristic advantage of broiler farming as a business. Since IRR is greater than the discount rate representing opportunity cost of capital, farms of all four sizes were financially viable. Sensitivity analysis showed that the values of IRR for all the farms were pretty higher that opportunity cost of investment for all the farms under situation I and II, the respective values being 80.10 and 74.10 for the sample as a whole. However, under situation III, IRR became indeterminable for Group I since net cash flow itself was negative and the investment was not recovering the operational costs even. Thus,
although the analysis using different rate of interest showed negative values of net present worth, but it did not show any positive value of the same, as a result internal rate of return could not be computed. Thus, Group I farms became financially non viable under situation III, but Group II farms would still financially viable although at margin, with 12.88 per cent internal rate of return.
On the basis of NPV, BCR and IRR, investment in broiler farming was found to be most profitable in large sized farms, than smaller farms. This was due to the fact that the benefits per bird were highest and cost of production per bird was lowest on large farms. In contrast, the benefits per bird were lowest and cost per bird was highest on small farms.
CONCLUSION
The present study is a reflection of the recent status of broiler farming in Sonitpur district of Assam. On the basis of the important findings of the study the following conclusions are drawn. Meat production per bird in general showed positive relationship with farm size, though it was same in Group I and Group II. Both the total variable cost Table 6: Investment appraisal of different broiler farm sizes in the sample
Investment appraisal tools Group I Group II Group III Group IV All farms
Pay back period (years)
Present situation 1.39 1.23 1.09 0.68 0.85
Situation I 3.07 2.06 1.68 0.95 1.24
Situation II 3.45 2.25 1.82 1.02 1.34
Situation III * 8.26 4.45 1.75 2.67
Net present value at 9% discount rate
(rupees)
Present situation 312444.15 1213711.15 3149386.33 9123125.66 3304625.68
Situation I 100378.69 657736.78 1919378.37 6327517.29 2122866.66
Situation II 81014.83 562852.56 1677027.96 5829088.13 1935465.65
Situation III -131050.64 6878.19 447020.01 3033479.76 753706.63
Internal rate of return (percentage)
Present situation 72.12 82.20 92.02 147.02 117.02
Situation I 31.20 48.06 60.15 106.06 80.10
Situation II 27.17 44.12 55.01 99.11 74.10
Situation III * 12.88 22.19 57.08 36.30
Benefit cost ratio at 9% discount rate
Present situation 1.07 1.10 1.11 1.16 1.13
Situation I 1.02 1.05 1.07 1.11 1.08
Situation II 1.02 1.05 1.06 1.10 1.08
Situation III 0.97 1.00 1.02 1.05 1.03
Situation I: Cost increased by 5 %. Situation II: Returns decreased by 5 %.
and the total cost of production per bird had an inverse relationship with farm size. Feed cost alone accounted for more than half (67.89 per cent) of the total variable cost. The increasing trend of net income with farm size could mainly be attributed to operation of economies of scale in large sized farms coupled with efficient utilization of resources. On
the basis of NPV, BCR and IRR, it can be concluded that though investments in all farm- sizes were economically paying proposition, it was found to be most profitable in large sized farms, than smaller farms. This was due to the fact that the benefits per bird were highest and cost of production per bird was lowest on large farms. Moreover, small sized farms were comparatively more sensitive to increased cost and decreased returns then the larger ones. From the results of the analysis, there is an indication that broiler production enterprise could be a profitable or viable venture if properly managed in the study area and Assam can also reap the advantages of broiler farming not only for self-sufficiency creation on meat but also to generate export earnings.
REFERENCES
Bhandari, D.B. 2001. “Economic Analysis of Poultry Farming in Ratnagiri District (Maharashtra)”. M.Sc. Thesis, Dr. Balasaheb Sawant Konkan Krishi Vidyapeeth, Dapoli. Bora, R.S. and Bora, M.C. 2000. “Cost and Returns of Broiler
Farming in Guwahati City of Assam”. Indian Veterinary Journal,77(4): 328-331.
Chhikara, O.P. and Singh, S.S. 1989. “Cost Structure of Poultry Farming in Haryana”. Poultry Guide,24(6): 45-51. Ganesh, K.B. and Rai, R.B. 2006. “Economic Status of Poultry
Farming Enterprises in Andaman and Nicobar Islands”. Agricultural Economics Research Review,19(2): 377-386. Kalita, K.P. 2011. “Byabasaik Bhittit Kukura Palan”. Shree
moti Himashree Kalita, Beltola, Survey, Guwahati, Assam. Fourth edition, p. 80.
Mohsin, A.Q., Riaz, R., Asad, S. and Mushtaq, A. 2008. “Profitability Analysis of Broiler Production in Rawalpindi District”. Pakistan Journal of Agricultural Sciences, 45(4): 514-519.
Rajendran, K., Mohan, B., Viswanathan, K. and Edwin, S.C. 2008. “A study on Cost of Production of Broiler at Market Age at Palladam Area”. Tamilnadu Journal of Animal Science,4(2): 69-70.
Rangareddy, P., Shanmugam, T.R. and Mohan, B. 1997. “Economic and Financial Analysis of Broiler Production in Kamarajar District of Tamil Nadu”. International Journal ofAnimal Sciences, 12(1): 119-122.
Shaikh, A.S. and Zala, Y.C. 2011. “Production Performance and Economic Appraisal of Broiler Farms in Anand district of Gujarat”. Agricultural Economics Research Review, 24(2): 317-323.
Sharma, V., Grover, D.K. and Bawa, R.S. 1991. “Economics of Poultry Farming in Punjab”. SARAS Journal of Livestock and Poultry Production,7: 61-66.
Shrivastava A., Gupta, S.K. and Mishra, A.M. 2002. “Production and Marketing of Broilers in Jabalpur District of M.P”. Agricultural Marketing, XLV(3): 5-8.
Singh, V.P., Sharma, V.K., Sidhu, M.S. and Kingra, H.S. 2010. “Broiler Production in Punjab - An Economic Analysis”.