JOURNAL OF SPATIAL INFORMATION SCIENCE
© by the author(s) Licensed under Creative Commons Attribution 3.0 License
A Study on How Location Information
is Expressed in Tweets and
Geo-locating Tweets with Less Ambiguity
Sunshin Lee
1, Mohamed M. Farag
2, and Edward A. Fox
3 1Department of Information Technology, Radford University, Radford VA 24141 USA 2College of Computing and Information Technology, Arab Academy for Science, Technology &Maritime Transport, Egypt
3Department of Computer Science, Virginia Tech, Blacksburg VA 24060 USA
Received: December 31, 2018; revised: XX X. 2019; accepted: XX X, 2019; published: XX X, 2019.
Abstract: Since many tweets talk about events with location information, it is
important to geo-locate those tweets whenever possible. This paper describes how latent location indicative information can help to geo-locate tweets with less ambiguity. Many focus on tweets that have geo-coordinates, but often that only accounts for around 2% of the tweets, which we show is insufficient to accurately predict national trends. Other researchers focus only on tweets that have geonames. Further, many only employ small datasets, e.g., covering several months. Due to possible location ambiguity, e.g., “Washington” matches 88 different locations in the U.S.A., finding a tweet’s location often is challenging.
Furthermore, explicit location information is insufficient in tweets, because tweets are often brief and incomplete due to the “140 character” limitation. However, location indicative words may include latent location information, for example, “Water main break near White House” is related to a location “1600 Pennsylvania Ave NW, Washington, DC 20500” indicated by the keyword ‘White House’.
We studied over 6 million tweets about water main breaks, sinkholes, potholes, car crashes, and car accidents, covering 17 months. We found that up to 91.1% of tweets have at least one type of direct location information (geo-coordinates, geonames), or location indicative words. We found that in most cases adding location indicative words helps geo-locate tweets with significantly less ambiguity. We also studied state-level labeling of events’ location based on event-related tweets. We found relatively consistent results with tweets that were unambiguously geo-coded at the state level, while significantly different results with geo-coordinates.
Please do not cite
2 LEE, MAGDY, FOX
www.josis.org
Keywords: Geo-locating, Named Entity Recognition, Geocoding, Location Indicative
Words, Geoname, Geo-coordinates, Tweets
1.
Introduction
Roads are an integral part of our daily lives. Many daily accidents and emergencies are associated with a road location. For example, according to watermainbreakclock.com, 850 water main breaks occur each day in North America; the total annual costs of repairs are over $3 billion [28]. The American Society of Civil Engineers (ASCE) believes it would cost $2.7 trillion to fix crumbling highways and bridges in the US, according to pothole.info [20]. Recently, to detect and respond to accidents and emergencies quickly, or for information aggregation or dissemination, local governments or organizations have been using various tools such as Twitter and mobile apps.
Detecting events’ locations using manual work is impractical, because of the large volume of data. An alternative is detecting an event’s location automatically; automation also supports related collection and dissemination of information. Sakaki et al. [1] showed how to use a micro-blogging service such as Twitter to detect the center and trajectory of a targeted event such as an earthquake or typhoon. They collected only tweets that contain keywords such as earthquake and shaking, to filter out non-relevant tweets. They used tweets that have geo-coordinates (latitude and longitude, GPS enabled), and registered users’ locations in their profile in Twitter, to estimate the target event’s center and trajectory. Unfortunately, only a very small number of tweets (usually under 2% of sampled tweets, see Section 4) include geo-coordinates.
Consequently, many studies [6][14][23][22][3][25][18] have explored geo-locating tweets through tweet text instead of geo-coordinates. However, most are based on small size datasets that have been geo-tagged by human effort.
Generally, events are related to a specific location, or a set of locations. In order to determine the location(s) corresponding to each event it is beneficial to geo-locate each tweet. In contrast to news and public homepages that have more well-formed location information, most tweets are personal text messages and have incomplete location information without a specific state name or country name. Since typical NER algorithms are developed for news or other moderate to long length documents, the result of applying an NER algorithm to tweet text may not be helpful.
Geo-locating a tweet is difficult because:
• Most users prefer to provide geospatial information by stating it in the contents of the tweet rather than lose privacy by enabling GPS (latitude, longitude) information.
• Tweets are often brief and incomplete (e.g., missing state or city name).
• Since many distinct places share the same geoname, entities extracted from tweets using the state-of-the-art Stanford Named Entity Recognizer often have location ambiguity.
• Tweets include only a small fraction of the full information about an event, because of the 140-character limitation (increased in 2017 to 280).
Please do not cite
A Study on Geo-locating Tweets with Less Ambiguity 3
• When people communicate, they may not mention what they already know (and guess that others will understand). For example, when people warn friends about an accident, they often mention a street name without giving the name of the city or state.
To overcome these problems, we determine tweet locations through analysis of not only geonames, but also latent location information. Our intuition is that latent location information such as location indicative words (LIWs) may help to geo-locate tweets. A LIW is a word or phrase that is in relation to a specific location. Experiments show that in most cases adding LIWs helps to geo-locate tweets with less ambiguity. Furthermore, state level distribution of unambiguously geo-coded tweets with geonames or both geonames and LIWs are quite consistent. On the other hand, when geo-coordinates alone are used, there often are inaccuracies, due to biased sampling resulting from the small number of tweets with latitude and longitude (2%) and the fact that many tweets with geo-coordinates come from automated posting systems run by local governments.
The rest of the paper is organized as follows. Related work is described in Section 2. Section 3 explains methodologies. In Sections 4, 5 and 6, we present our datasets, features and data analysis based on features, and experimental results. Conclusions and future work are discussed in Section 7.
2.
Related Work
Recently, extensive studies have been carried out on the use of various types of social media – micro-blogs, social networks, wikis, and blogs – especially for emergency response and management. One of the challenging problems is finding an event’s location by geo-locating social media data. There are various approaches to extracting location information from that data and subsequently inferring specific locations. Geo-locating consists of two steps: 1) Geo-parsing and 2) Geo-coding. Geo parsing means finding geonames in a text, for example, ‘Blacksburg’ from ‘I saw a water main break in Blacksburg’. With dictionary or trained information, we can decide whether this word is a geoname or not. After finding all geonames in a text, we can translate all geonames into longitude and latitude, for example, ‘Blacksburg, VA’ to (37.2295733, - 80.4139393). We call this geo-coding.
2.1
Case Study: Event Location Detection of Governments or Organizations
Some people report emergencies or disasters through social media, and as a result many governments and organizations are supporting use of such media, as shown in Table 1.
Table 1. Case Studies of Event Detection in Governments or Organizations Organization or
government Services
“311 system” by Grand Rapids, MI
and City of Baltimore, MD
The City of Grand Rapid, MI (Twitter ID: GrandRapids311) runs a service request online including potholes, graffiti, and street lights out via Twitter (http://311.grcity.us). The City of Baltimore (Twitter ID: baltimore311) also uses Twitter to collect requests like pothole, tree trimming, and bulk trash pickup
Please do not cite
4 LEE, MAGDY, FOX
www.josis.org
(http://www.baltimorecity.gov/311-services).
City of Boston’s “CitizenConnect”
The City of Boston (Twitter ID: citizensconnect) developed and used an iPhone mobile app and Twitter that is engaging
residents in the process of maintaining their own city neighborhoods by reporting public issues such as potholes (http://newurbanmechanics.org/project/citizens-connect/).
Iowa 911 Call Center
In 2009, there was news that the Iowa 911 call center started to accept texts and planned to receive messages from Twitter and Facebook in the near future. This was an important trial to test different channels in reporting an emergency.
Water Department on the Twitter
In the town of Meredith, NH, the Water Department posted alarm messages of a water main break on Twitter. These posts helped residents of the town respond effectively to the
emergency in their community. This could be a good platform to distribute alarm messages to those who need it. This also could be a good source because its messages are reliable and accurate.
SUX911
Sioux City of Iowa posts breaking news, crime, fire, and emergency tweets on Twitter. Interestingly they also collect tweets from people who use the #sux911 hashtag to report emergencies or accidents using their homepages. They now have a two-way communication system that can be an important factor for an emergency alarm system.
NEMA, Korea
A government agency, the National Emergency Management Agency (NEMA) of South Korea, built a two-way
communication system using Twitter to collect and post information about emergencies. Whenever someone follows NEMA, NEMA also follows that person back. If someone sends an emergency message to NEMA they will then forward that information on to others.
WSSC (Washington Suburban Sanitary
Commission)
WSSC made a free mobile app that provides many features using a smartphone: Pay bills, Report problems, See alerts, etc. This provides the most advanced features for the users to communicate with the WSSC. People can report water main breaks and also be notified by the WSSC during emergency situations. Only subscribed users who live in affected areas can use these services.
Most efforts mentioned above require human intervention. Although collection and dissemination are done by computer system or application, identifying the location of the events still requires manual work.
Please do not cite
A Study on Geo-locating Tweets with Less Ambiguity 5
2.2
Social Sensors to Detect Event Location
Event location detection is a crucial part of emergency response. While a usual method for emergency event detection involves a 911 call, emergency event detection with social sensors through social media could be one of the key supplemental methods. For example, Christian Reuter et al. reported studies of the requirements and use of social software in emergencies/crises [21].
Some researchers used tweets as a human or social sensor for event detection, for example finding an earthquake’s location [23], estimating a typhoon’s trajectory [23], detecting a water main break [14], and identifying locations of incidents such as cyclones, fires, and earthquakes [25].
Twitter also can be used to classify text messages and to deliver relevant information to the appropriate personnel during the recovery from an earthquake [4].
Many researchers have focused on not only the use of various types of social media - micro-blogs, social networks, wikis, and blogs - for emergency reporting and response, but also geo-locating the events unambiguously using location information.
2.3
Geo-locating with Geo-coordinates (Latitude and Longitude)
Takeshi Sakaki et al. [23] proposed a probabilistic spatiotemporal model to detect target events and each event’s center. They used tweets as human sensors. When an earthquake occurs, a large number of tweets about it are posted, so they can easily detect the occurrence and the geographic center of the event. The system provides an email service to registered users when the system detects an earthquake; it is faster than the announcement by the government. However, they used tweets that have geo-coordinates (GPS enabled by user) and a user’s registered location in the profile. Hence, this method has limited applicability; according to our experiments with 5 datasets, only around 2% of tweets have geo-coordinates (see Section 4).
2.4
Geo-parsing: Extracting Location from Contents
2.4.1 Gazetteer
A gazetteer contains a hierarchical view of states, counties, cities, and landmarks, e.g., from the United States, Puerto Rico, and the U.S. Virgin Islands. To build an effective dictionary for extracting geospatial named entities, we needed a comprehensive list of geonames in the U.S.A. Two good sources of geonames are the Census 2000 U.S. Gazetteer [11] from the U.S. Census Bureau, and the Geographic Names Information System (GNIS) [12] from the U.S. Geological Survey (USGS). Extracting location information using the USGS Gazetteer has been described in [1, 5, 15, 22]. For more information, see Section 3.1.1.2.
2.4.2 Named entity recognition
Finding a location in a tweet message can be treated as Named Entity Recognition or Tagging. To detect location information from tweets automatically, we need natural language processing (NLP) for short text. A named entity recognizer is an NLP routine that can detect location information (as well as other types of names) in text. The Stanford Named Entity Recognizer (SNER) [36], which is based on the conditional random field (CRF) algorithm, is used widely to detect location information in a text. For more information, see Section 3.1.1.1.
Please do not cite
6 LEE, MAGDY, FOX
www.josis.org
Corvey et al. [14] researched identifying syntactic span and entity class (Person, Location, Organization, and Facility) in a Twitter dataset. Some researchers extract information such as person, organization, date, location, etc. from Web documents or pages [1, 2, 6]. Cucerzan [4] worked on large-scale named entity disambiguation based on Wikipedia data.
2.4.3 Language models
A language model-based approach to geo-locating Twitter users was proposed by Cheng et al. [6]. They used a generative probabilistic language model to identify the city-level location based on the content of the user’s tweets, even in the absence of any other geospatial cues, placing 51% of Twitter users within 100 miles of their actual location. They used Laplace, data-driven geographic, and model-based smoothing to overcome tweet sparsity. While they tried to find a user’s location, we tried to find an event’s location based on tweet contents.
2.4.4 Location Indicative Words
Many researchers extract geospatial named entities, while Han et al. [3] focused on finding LIWs to geo-locate tweets. Rather than attempt to find named entities or engineering new features, they use only an effective location indicative word that is more indicative than other words commonly found. We used both geonames and predefined LIWs, such as organization name, person name, hashtag, and mention, to geo-locate tweets.
2.5
Location Disambiguation
Named entity disambiguation is characterized as either focusing on geo/non-geo or geo/geo ambiguity [1]. Geo/non-geo ambiguity is addressed when identifying mentions of places, while geo/geo ambiguity is addressed when disambiguating recognized place references.
Martins et al. [8] disambiguate location by estimating the distance between the true geospatial location and candidate geospatial locations.
3.
METHODOLOGY
3.1
Geoparsing
Usually, geo-parsing means extracting geonames from text. However, we believe that LIWs such as named entities, hashtags, and mentions can be viewed as indirect geonames.
In order to automatically extract geonames from tweets, we used a named entity recognizer (NER) and a dictionary-based approach (gazetteer) to detect geospatial named entities (geonames). We also used NER and regular expression matching for extracting LIWs such as organization name, person name, hashtag, and mention. Figure 1 shows a data flow diagram for geoparsing using three different methods and 6 different outputs (i.e., two types of geonames and 4 types of LIWs). In the following subsections, each process is described in detail
Please do not cite
A Study on Geo-locating Tweets with Less Ambiguity 7
Figure 1. Data flow diagram for geoparsing
3.1.1 Extracting geonames
3.1.1.1 Using Stanford Named Entity Recognizer (SNER)
We used a popular NER, Stanford NER version 3.4.0 with its default 3-class (location, person, and organization) model, that is known as a good recognizer for English, particularly for these 3-classes [26]. The Stanford NER performs very well on news articles and documents. A comparison of named entity recognition tools, such as Stanford NER, Illinois NET, OpenCalais NER WS and Alias-i LingPipe, shows that Stanford NER produced the best results, then LingPipe, Illionois and OpenCalais [24]. Based on those studies, we use Stanford NER consistently in this research. Although it is not perfect, it is efficient and generally gives good results.
3.1.1.2 Using Gazetteer
To build an effective dictionary for extracting the geospatial named entities we needed a comprehensive list of geonames in the U.S.A. We used the Census 2000 U.S. Gazetteer [5] from the U.S. Census Bureau. The Gazetteer contains a hierarchical view of states, counties, cities, and landmarks from the United States, Puerto Rico, and the U.S. Virgin Islands.
In our research with the Gazetteer, we only used United States data. Since geonames in the Gazetteer include types such as city, township, borough, village, and census area, we removed all geoname types from the geonames, e.g., we removed geoname type ‘Town of’ from ‘Town of Blacksburg’, because people usually omit those types in a tweet text.
One of the drawbacks of a gazetteer matching approach is that this approach cannot handle geo/non-geo disambiguation (e.g., “love,” since there is a Love, IL).
Geo-coding Geo-parsing
Tweets
Geoname SNER
Named Entity Org.
Named Entity Person
Hashtag
Mention Named Entity
Location
Named Entity Recognition
Information Extraction Stanford
NER
Regular Expression Gazetteer
Location Info. - Country
- State - Geo-coordinates
Please do not cite
8 LEE, MAGDY, FOX
www.josis.org
3.1.2 Extracting Location Indicative Words
A location indicative word (or phrase) is not a location name or a geoname. Rather, a LIW has latent location information, for example, the organization name “Virginia Tech” is related to the specific location of its main campus: “Blacksburg, VA, United States”.
To extract LIWs from tweet contents, we used the Stanford NER to extract organization and person names, and used regular expression matching to extract hashtags (starting with ‘#’) and mentions (starting with ‘@’), e.g., ‘#MPLSweather’ and ‘@JoeCampbellMN’. If more than one LIW is found, a semicolon is added to separate LIWs, e.g., 'Brunswick; Victoria'.
Table 2 shows various types of features (geonames and LIWs), three different methods of extraction, and examples of extracted geonames and four types of LIWs.
Table 2. Extraction method and examples of two geonames and four LIWs Feature Type Extraction Method Extracted From Examples
Geo-coordinates Location (geo-coordinates)
Embedded geo-coordinates
Twitter Location
Service
(40.418247, -86.893997), (44.94910722,
-93.08783739)
Location_SNER
Location (geoname)
Stanford Named Entity
Recognizer
Tweet contents
(text)
'KANSAS CITY; Kan. ', 'Suffolk County'
Location_GZTR
gazetteer matching with
Census 2000 U.S. Gazetteer
'Brunswick; Victoria' 'Laurel; Beltsville'
Person_SNER Person name
Stanford Named Entity
Recognizer
'BURTON', 'Paul'
Organization_SNER Organization name
'Winnipeg Police Service', 'Daly Elementary;
Westwood Cyber High'
Hashtag Topic Regular
expression
'MPLSweather' 'Winnipeg' Mention username Twitter 'JoeCampbellMN' 'cityofsaintpaul'
A detailed data flow diagram for extracting features (geonames and LIWs) is shown in Figure 2.
Please do not cite
A Study on Geo-locating Tweets with Less Ambiguity 9
Figure 2. Detailed data flow diagram for extracting features (geonames and LIWs) Our feature extraction program receives text as an input from the tweet table (e.g., z_312, water main break collection), then extracts geonames and LIWs using the Stanford NER server, gazetteer matching, and regular expressions. Once geonames and LIWs are extracted, the extracted features are stored in the feature table (z_312_ne2), as shown in Figure 2
3.2
Geo-coding and reverse geo-coding
Geo-coding is a process for transforming location information such as geonames into geo-coordinates, while reverse geo-coding is a process of converting geo-coordinates into location information such as address (street name, city, state, and country). If a tweet has a geo-coordinate, which means a user turned on the Twitter location service, so the exact location of the user is recorded as a geo-coordinate by the user’s GPS, then a reverse geo-coding API is called to get an address. On the other hand, the program calls a parsing process for extracting geonames and LIWs if tweets have no geo-coordinates. Then, extracted geonames and LIWs are sent to a geo-coding API to get an address. However, we may get multiple addresses as a result, which means the location information that was sent is ambiguous. Figure 3 shows a data flow diagram for the geo-coding and reverse geo-coding processes.
Feature extraction
program (SNER_DB.py)
SNER Server
Text
text
Text
Geoname Organization Person
Gazetteer (file)
Geoname Matching
(Text)
Feature Table
Tweet Table
Please do not cite
10 LEE, MAGDY, FOX
www.josis.org
Figure 3. Data flow through geo-coding/reverse geo-coding process
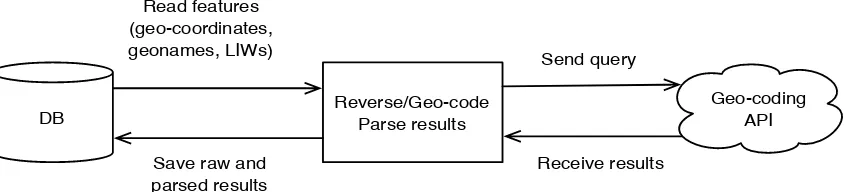
All extracted features are stored in a database (DB) and are sent to the Google geo-coding API to geo-code or reverse geo-code them. After we receive the API’s results, they are parsed and then saved in the DB. A data flow including a database and the geo-coding API is shown in Figure 4.
Figure 4. Data flow between a database and the geo-coding API
3.3
Disambiguation
Disambiguation is a process of resolving the conflicts that arise where location information is ambiguous because it refers to more than one address, for example, there are 88 instances of Washington, 41 of Springfield, 35 of Franklin, and 35 of Lebanon in the USA [16].
To disambiguate the location information of tweets, we merged direct location information (geonames) and indirect location information (LIWs). Our intuition is that indirect location information may help to minimize the ambiguity of the tweet’s location, at some level such as country or state.
4.
DATASETS
As part of our work on the NSF funded Integrated Digital Event Archiving and Library (IDEAL) project [8], we collected over 2 billion tweets using over 1,000 keywords, key phrases, mentions, or hashtags, starting from 2009. We collected a large number of tweets related to disasters, emergencies, and accidents, including earthquake, hurricane, tornado, flood, winter storm, car crash, water main break, and shooting. We selected 5 collections that are about road-side emergencies, that may include various textual location information to aid in geo-location. These datasets were collected from 2/1/2013 to 6/30/2014 (17 months). To collect data from twitter.com, we used
Geo-coding
Reverse Geo-coding
Tweets coordinates?
Geo-Yes
No Geo-parsing
Named Entity Recognition Regular Expression
Location Info. - Country
- State - Geo-coordinates
DB Reverse/Geo-codeParse results
Geo-coding API Read features
(geo-coordinates,
geonames, LIWs) Send query
Receive results Save raw and
parsed results
Please do not cite
A Study on Geo-locating Tweets with Less Ambiguity 11
yourTwapperKeeper, whichis an open source tool for collecting tweets. The tool collects tweets using a Search API and a Stream API, which are provided by twitter.com.
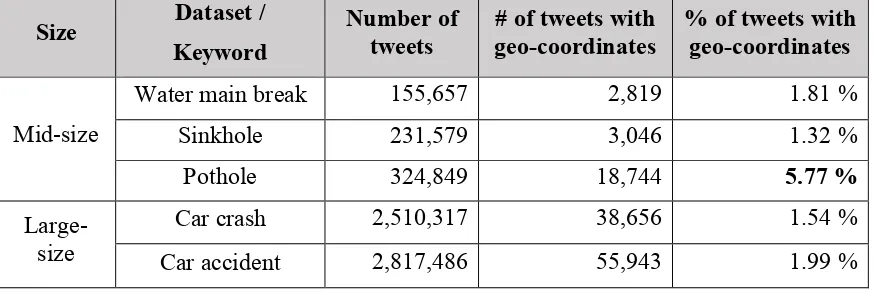
Table 3. Collections of tweets: number and percentage of tweets that have geo-coordinates
Size
Dataset /
Keyword
Number of
tweets
# of tweets with
geo-coordinates
% of tweets with
geo-coordinates
Mid-size
Water main break
155,657
2,819
1.81 %
Sinkhole
231,579
3,046
1.32 %
Pothole
324,849
18,744
5.77 %
Large-size
Car crash
2,510,317
38,656
1.54 %
Car accident
2,817,486
55,943
1.99 %
Table 3 shows the list of collections of tweets, along with the number and percentage of tweets that have latitude and longitude. We selected the ‘water main break’, ‘sinkhole’, and ‘pothole’ collections as mid-size collections, and ‘car crash’ and ‘car accident’ as big-size collections. Most of the collections have at most 2% of tweets that have geo-coordinates (latitude and longitude). One possible reason is that many Twitter users don’t like to be tracked by Twitter, so avoid enabling its location service. The pothole collection, however, has more tweets (5.77%, highlighted in bold) that have geo-coordinates, because local governments run systems that use Twitter as a reporting and disseminating medium for pothole reporting and alerting. See details in Section 5.1.2
5.
Features and Data Analysis based on Features
5.1
Geo-coordinates
Although most collections in this analysis have at most 2% of tweets with
geo-coordinates (latitude and longitude), those have fairly correct location information, for example, a cell phone’s GPS location or the estimated location of a personal computer using its IP address. These latter geo-coordinates represent a Twitter user’s (person or organization) location. A user’s location may be the same as an event’s location if the user was in the location of the event. By analyzing the tweets that have
geo-coordinates, we can see who tweeted about these emergencies or accidental events, and where they were.
5.1.1 Location
To geo-locate tweets with geo-coordinates, tweets were reverse-geocoded through the Google Geo-coding API. For details of reverse geo-coding, see Section 3.2. Table 4 shows the top 10 countries that have tweets with geo-coordinates in our collections. In the case of water main breaks, 2,540 out of 2,819 tweets that have geo-coordinates are
Please do not cite
12 LEE, MAGDY, FOX
www.josis.org
from the USA, 259 tweets are from Canada, and small numbers (1-5) of tweets are from other countries.
We used English keywords to collect tweets, for example ‘water main break’, so locations (countries) of tweets are related to the countries where English is the national language or the native language of the majority, such as USA, UK, Canada, and Australia, and countries where English is an official language, but not the majority language, including South Africa, Malaysia, and India [10].
Table 4. Number of tweets that belong to top 10 countries
Frequencies of keywords that are used by people also vary across countries. Figure 5 shows the percentages of tweets that belong to the top 3 countries, and the others. We found a very small number of tweets (0.18%) that belong to the UK in the water main break collection. A different key phrase, “burst water main”, is usually used in the UK [27]. In the USA, a keyword, “car accident” (81.19%) is used more frequently than “car crash” (61.82%), however, “car crash” (25.83%) is used more frequently than “car accident” (5.4%) in UK.
Water main
break Sinkhole Pothole Car crash Car accident
Rank 2,819 3,046 18,744 38,656 55,943
1 (2,540) USA (2,150) USA (16,550) USA (23,899) USA (45,422) USA
2 Canada (259) (407) UK (926) UK (9,985) UK (3,021) UK
3 UK
(5)
Canada (209)
Canada (566)
Canada (977)
Canada (1,451) 4 Germany (2) Australia (47) Africa (208) South Ireland (596) Australia (724)
5 Ireland (2) Malaysia (27) Ireland (120) Australia (429) South Africa (662)
6 Mexico (2) Ireland (24) Uganda (73) Malaysia (260) Malaysia (532)
7 Russia
(2)
Saudi Arabia (21)
India (68)
South Africa (222)
Philippines (486) 8 Indonesia (2) Netherlands (19) Kenya (28) Nigeria (188) Nigeria (434)
9 Costa Rica (1) Mexico (18) Jamaica (25) Indonesia (157) India (254)
10 Hong Kong (1) Philippines (13) Nigeria (17) Brazil (125) Indonesia (244) Total # of
Countries 13 67 72 100+ 100+
Please do not cite
A Study on Geo-locating Tweets with Less Ambiguity 13
Furthermore, most of the tweets in these 5 collections come from several specific countries. Figure 5 shows how many tweets come from specific countries such as USA, UK, and Canada. Note that the Y axis of Figure 5 starts from 50%. More than 99% of tweets in the water main break collection came from those three countries, more than 96% for the pothole collection, and around 90% for the sinkhole, car crash, and car accident collections. “Etc.” of Figure 5 means total number of tweets for other countries.
Figure 5. Percentages of tweets that belong to top 3 countries and the others We might think that states that have more population have more tweets, because tweets are posted by people. Figure 6 shows the number of tweets with geo-coordinates by state, ordered by the U.S. state population as of 2013 [17] (giving the top 25 states; other states have a small number of tweets). California has the largest population in the US. In most collections, we see more population leads to more tweets, and this is reasonable.
We also see outliers in the pothole collection; Massachusetts, Michigan, and Maryland have unusual numbers of tweets. A reason for this is explained below following the user analysis. The car crash collection also has an outlier situation with respect to Illinois.
90.10%
70.58%
88.29%
61.82%
81.19% 0.18%
13.36%
4.94%
25.83%
5.40% 9.19%
6.86%
3.02%
2.53% 2.59%
0.53%
9.19% 3.75% 9.82% 10.81%
50% 55% 60% 65% 70% 75% 80% 85% 90% 95% 100%
Water Main
Break Sinkhole Pothole Car crash Car accident
USA UK Canada Etc.
Please do not cite
14 LEE, MAGDY, FOX
www.josis.org
Figure 6. Number of tweets with geo-coordinates by states and ordered by US state population of 2013
5.1.2 User (person or organization)
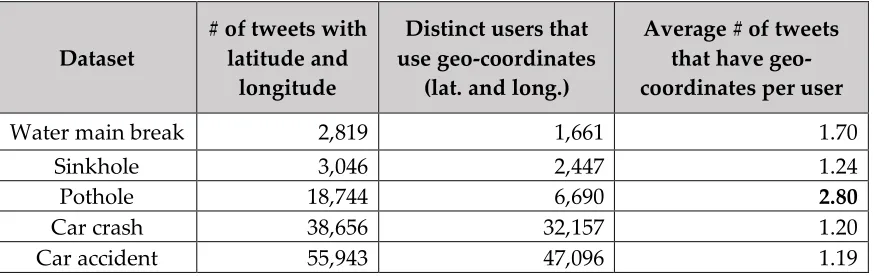
The users who post a message in Twitter can be divided into two types: person or organization (non-profit or governmental). The average number of tweets that have geo-coordinates per user is 1.19 - 1.70 (except 2.8 for the pothole dataset, shown in bold); see details in Table 5. In other words, most people or organizations post under 2 tweets with geo-coordinates, on average.
Table 5. Distinct users and average number of tweets that have geo-coordinates
Dataset # of tweets with latitude and longitude
Distinct users that use geo-coordinates
(lat. and long.)
Average # of tweets that have geo-coordinates per user
Water main break 2,819 1,661 1.70
Sinkhole 3,046 2,447 1.24
Pothole 18,744 6,690 2.80
Car crash 38,656 32,157 1.20
Car accident 55,943 47,096 1.19
However, some non-profit organizations or governmental organizations, for example, GrandRapids311, citizenconnect, and baltimore311, posted many more tweets; see details in Table 6. As explained in Table 1 in Section 2.1, the city of Grand Rapids, MI (Twitter ID: GrandRapids311) and the city of Baltimore, MD (Twitter IDs: citizenconnect and baltimore311) employ a system, which also uses Twitter as a medium of communications, to collect requests and disseminate information from/to citizens.
0 500 1000 1500 2000 2500 3000
CA TX NY FL IL PA OH GA MI NC NJ VA WA MA AZ IN TN MO MD WI MN CO AL SC
3814 7387
Water Main Break Sinkhole Pothole Car Crash Car Accident
Please do not cite
A Study on Geo-locating Tweets with Less Ambiguity 15
Table 6. Top 5 users' number and percentages of tweets and their Twitter ID
Dataset # of tweets with geo-coordinates
# (%) of tweets posted by top
5 users
List of top 5 users who post more messages than average, with the number of tweets
they posted Water
main
break 2,819
320 (11%)
baltimore311, 85; SanDiegoCP*, 76; BaltimoreCP, 59; IndianapolisCP, 50; DetroitCP, 50
Sinkhole 3,046 (5.3%) 163 citizensconnect, 60; baltimore311**, 33; DetroitCP, 28; OttawaCP, 22; AlSalamanty, 20
Pothole 18,744 (56.3%) 10,531 GrandRapids311, 5487; citizensconnect, 2460; baltimore311, 1977; MarquelatTPV, 315; 311Calgary, 292 Car
crash 38,656 (2.5%) 1,002
Chicago_CP, 249; DailyESSEX, 224; IndianapolisCP, 198; Boston_CP, 181; LosAngelesCP, 150
Car
accident 55,943 (1.8%) 1,012 carlocopper, 508; f3traffic, 304; whurst1, 72; Mrspurpleninja, 65; bryanj1menez, 63
*CP: City and Press Co. (*.cityandpress.com), local news company, now
toplocalnews.com (as of 2/16/2016), e.g. SanDiegoCP, **311: City service, e.g. baltimore311.
5.2
Geonames and Location Indicative Words (LIWs)
To geo-locate tweets, we extracted features such as geonames and LIWs. Geonames are extracted using two different tools, i.e., Stanford NER and the Gazetteer, while 4 different types of LIWs are extracted using Stanford NER and regular expression matching. With those features, we wanted to know how many of the features exist or have keywords mentioned in the collections, so we counted the number of tweets that have the features. See Figure 7.
Regarding location information (geonames), there are around 2% of tweets that have geo-coordinates, while much larger percentages (Geoname_SNER: 12 - 38%, Geoname_Gazetteer: 35 - 70%) of tweets have geonames present in the collections. Furthermore, latent location information such as LIWs can be found in most collections in fairly large percentages of tweets, up to 55% (Organization_SNER: 5 - 15%, Person_SNER: 5 - 25%, Hashtag 18 - 31%, and Mention: around 55%).
Please do not cite
16 LEE, MAGDY, FOX
www.josis.org
Figure 7. Percentages of tweets that have features
Figure 8 shows percentages of tweets that have at least one of the features, and comparisons with geo-coordinates and geonames. In most collections, 72 - 91% of tweets have at least one of the features. Given that 12-70% of tweets that have geonames, and 5 - 55% of tweets that have LIWs, can be geo-coded, we may guess that we can geo-locate more tweets if we consider geonames or LIWs.
Figure 8. Percentages of tweets with features and combination of features
6.
EXPERIMENTS
As is explained above, we analyzed tweets with coordinates by reverse geo-coding. We also analyzed tweets with features by counting the number of tweets that have particular features.
After analyzing the datasets, we wanted to know “How many tweets can we geo-locate with those features?” and “How many tweets have an unambiguous location after geo-locating with those features?”.
We defined two measures. One is for effectiveness of features to geo-locate tweets and one is for effectiveness of features to obtain an unambiguous location.
0% 10% 20% 30% 40% 50% 60% 70% 80% 90% 100%
Geo-coordinate Geoname_SNER Geoname_GZTR Organization_SNER Person_SNER Hashtag Mention Water Main Break Sinkhole Pothole Car crash Car accident
91.1%
85.0% 82.2% 80.5%
77.2%
0% 10% 20% 30% 40% 50% 60% 70% 80% 90% 100%
Water Main Break Sinkhole Pothole Car Crash Car Accident Geo-coordinate Geoname_SNER Geoname_GZTR Geo-coordinates or Geonames or LIWs
Please do not cite
A Study on Geo-locating Tweets with Less Ambiguity 17
Figure 9 shows an overview of the 4 different experiments with two types of geonames that are extracted using the gazetteer (GZTR) and Stanford NER (SNER) and 4 different types of location indicative words (e.g., organization name (Org.), person name (Per.), hashtag (Ht.), and mention (Mt.)) that are extracted from tweet text.
Figure 9. Overview of Experiments
Table 7 shows features that are used for each experiment. In experiment 1, we evaluated with geonames extracted using Stanford NER and gazetteer matching. In experiment 2, we evaluated with LIWs such as organization name, person name, hashtag, and mention. We also considered both types of geonames (SNER, GZTR) and LIWs in experiments 3 and 4, respectively. We used 3 mid-size and 2 big-size datasets for all experiments.
Table 7. Features that are used for each experiment
Experiments Geonames LIWs
Experiment 1 GZTR, SNER No
Experiment 2 No Organization, Person, Hashtag, Mention Experiment 3 SNER Organization, Person, Hashtag, Mention Experiment 4 GZTR Organization, Person, Hashtag, Mention
6.1
Evaluation Metrics
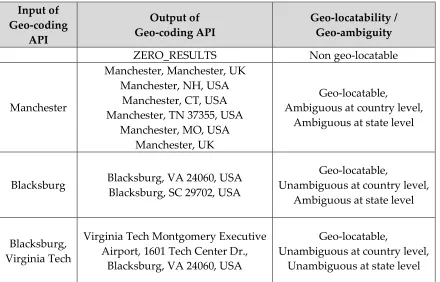
To check if a tweet is geo-locatable, or if a location of a geo-located tweet is ambiguous, we send extracted geonames and LIWs from tweet text to the Google Geo-coding API. With the output of the Google Geo-coding API, a tweet is considered “geo-locatable” if it returns at least one location, while location information of the tweet is considered “ambiguous” and “unambiguous” if it has information for multiple locations or exactly one location, respectively. Table 8 shows examples of the input and output of the Geo-coding API, and their geo-locatability and geo-ambiguity.
Table 8. Examples of Input and Output of Geocoding API and their Geo-locatability and Geo-ambiguity
SNER
GZTR
2 Geonames
4 Location Indicative Words
2 Measures
5 datasets
Exp. 1
Experiment 2
Org. Per. Ht. Mt.
Experiment 3
Experiment 4
Please do not cite
18 LEE, MAGDY, FOX
www.josis.org
Input of Geo-coding
API
Output of Geo-coding API
Geo-locatability / Geo-ambiguity
ZERO_RESULTS Non geo-locatable
Manchester
Manchester, Manchester, UK Manchester, NH, USA
Manchester, CT, USA Manchester, TN 37355, USA
Manchester, MO, USA Manchester, UK
Geo-locatable,
Ambiguous at country level, Ambiguous at state level
Blacksburg Blacksburg, VA 24060, USA Blacksburg, SC 29702, USA
Geo-locatable,
Unambiguous at country level, Ambiguous at state level
Blacksburg, Virginia Tech
Virginia Tech Montgomery Executive Airport, 1601 Tech Center Dr.,
Blacksburg, VA 24060, USA
Geo-locatable,
Unambiguous at country level, Unambiguous at state level
6.2
Result of Experiment 1: Geonames
We experimented with geo-coordinates and two types of geonames (extracted using Stanford NER and gazetteer matching).
6.2.1 Geo-locatability: geo-locatable tweets
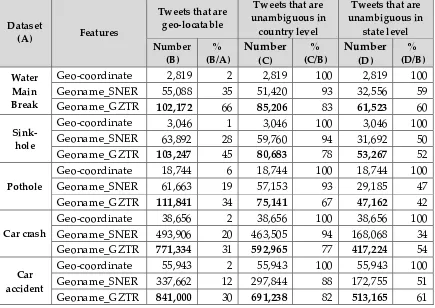
We found that much more location information comes from tweet contents (text) using natural language processing, rather than from the Twitter geo-location service. As we discussed in Section 5.1, in most collections only around 2% of tweets have geo-coordinates (except 6% for the pothole dataset), while we can find geonames from 12-36% of tweets when we use Stanford NER. Furthermore, if we use the gazetteer, we can extract geonames in up to 70% of tweets. Table 9 shows the outcome of experiment 1 in terms of number of tweets that have those features and their geo-locatability. Bold entries highlight the potential of the gazetteer.
Table 9. Experiment result of geo-locating tweets with geo-coordinates or geonames
Dataset
(A) Features
Tweets that have
features Tweets that are geo-locatable Number
(B)
% (B/A)
Number (C)
% (C/B) Water
Main Break
Geo-coordinate 2,819 2% 2,819 100%
Geoname_SNER 56,397 36% 55,088 98%
Geoname_GZTR 108,414 70% 102,172 94%
Please do not cite
A Study on Geo-locating Tweets with Less Ambiguity 19
Sinkhole
Geo-coordinate 3,046 1% 3,046 100%
Geoname_SNER 64,828 28% 63,892 99%
Geoname_GZTR 112,103 48% 103,247 92%
Pothole
Geo-coordinate 18,744 6% 18,744 100%
Geoname_SNER 62,302 19% 61,663 99%
Geoname_GZTR 114,716 35% 111,841 97%
Car crash
Geo-coordinate 38,656 2% 38,656 100%
Geoname_SNER 499,388 20% 493,906 99%
Geoname_GZTR 971,106 39% 771,334 79%
Car accident
Geo-coordinate 55,943 2% 55,943 100%
Geoname_SNER 344,039 12% 337,662 98%
Geoname_GZTR 992,808 35% 841,000 85%
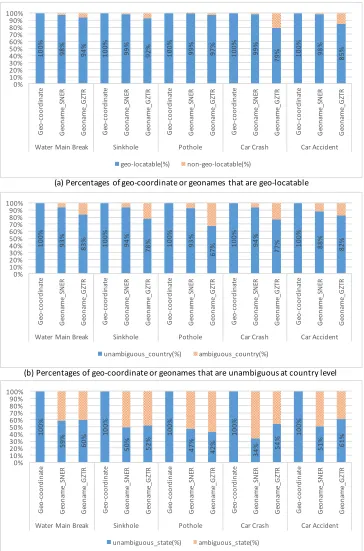
Figure 10 (a) shows percentages of geo-locatable tweets that have the features such as Geo-coordinates, Geoname_SNER, and Geoname_GZTR. Geo-coordinates are 100% geo-locatable, because of having latitude and longitude. More than 98% of tweets that have geonames extracted using Stanford NER are geo-locatable in all of the collections, while only 79-97% of tweets are geo-locatable when we use the Gazetteer.
Please do not cite
20 LEE, MAGDY, FOX
www.josis.org
Figure 10. Percentages of geo-coordinate or geonames that are (a) geo-locatable, (b) unambiguous at country level, and (c) unambiguous at state level in US
100% 98% 94% 100% 99% 92% 100% 99% 97% 100% 99% 79% 100% 98% 85%
0% 10% 20% 30% 40% 50% 60% 70% 80% 90% 100% Ge o-co or di na te Ge on am e_ SN ER Ge on am e_ GZ TR Ge o-co or di na te Ge on am e_ SN ER Ge on am e_ GZ TR Ge o-co or di na te Ge on am e_ SN ER Ge on am e_ GZ TR Ge o-co or di na te Ge on am e_ SN ER Ge on am e_ GZ TR Ge o-co or di na te Ge on am e_ SN ER Ge on am e_ GZ TR
Water Main Break Sinkhole Pothole Car Crash Car Accident
geo-locatable(%) non-geo-locatable(%)
100% 93% 83% 100% 94%
78% 100% 93% 67% 100% 94% 77% 100% 88% 82%
0% 10% 20% 30% 40% 50% 60% 70% 80% 90% 100% Ge o-co or di na te Ge on am e_ SN ER Ge on am e_ GZ TR Ge o-co or di na te Ge on am e_ SN ER Ge on am e_ GZ TR Ge o-co or di na te Ge on am e_ SN ER Ge on am e_ GZ TR Ge o-co or di na te Ge on am e_ SN ER Ge on am e_ GZ TR Ge o-co or di na te Ge on am e_ SN ER Ge on am e_ GZ TR
Water Main Break Sinkhole Pothole Car Crash Car Accident
unambiguous_country(%) ambiguous_country(%) 100% 59% 60% 100% 50% 52% 100% 47% 42% 100% 34% 54% 100% 51% 61% 0% 10% 20% 30% 40% 50% 60% 70% 80% 90% 100% Ge o-co or di na te Ge on am e_ SN ER Ge on am e_ GZ TR Ge o-co or di na te Ge on am e_ SN ER Ge on am e_ GZ TR Ge o-co or di na te Ge on am e_ SN ER Ge on am e_ GZ TR Ge o-co or di na te Ge on am e_ SN ER Ge on am e_ GZ TR Ge o-co or di na te Ge on am e_ SN ER Ge on am e_ GZ TR
Water Main Break Sinkhole Pothole Car Crash Car Accident
unambiguous_state(%) ambiguous_state(%)
(a) Percentages of geo-coordinate or geonames that are geo-locatable
(b) Percentages of geo-coordinate or geonames that are unambiguous at country level
(c) Percentages of geo-coordinate or geonames that are unambiguous at state level in U.S.
Please do not cite
A Study on Geo-locating Tweets with Less Ambiguity 21
In summary, if we use Stanford NER, we get a relatively small (12-36%) number of tweets that have geonames, but most (98%) of them are geo-locatable. In contrast, we get a relatively large (35-70%) number of tweets that appear to have geonames when we use the Gazetteer, but fewer (79-97%) of those tweets are geo-locatable.
6.2.2 Geo-ambiguity: ambiguity of possible geolocation
The other measure for experiments is geo-ambiguity. We evaluated the geo-ambiguity at two levels: country, and state in U.S. Table 10 shows experiment results of geo-ambiguity with geo-coordinates or geonames at the country level, and at the state level in U.S., respectively.
Table 10 Experiment results of country/state level ambiguity with geo-coordinates or geonames
Dataset
(A) Features
Tweets that are geo-locatable
Tweets that are unambiguous in
country level
Tweets that are unambiguous in
state level Number
(B) (B/A)% Number (C)
%
(C/B) Number (D) % (D/B) Water
Main Break
Geo-coordinate 2,819 2 2,819 100 2,819 100
Geoname_SNER 55,088 35 51,420 93 32,556 59
Geoname_GZTR 102,172 66 85,206 83 61,523 60
Sink-hole
Geo-coordinate 3,046 1 3,046 100 3,046 100
Geoname_SNER 63,892 28 59,760 94 31,692 50
Geoname_GZTR 103,247 45 80,683 78 53,267 52
Pothole
Geo-coordinate 18,744 6 18,744 100 18,744 100
Geoname_SNER 61,663 19 57,153 93 29,185 47
Geoname_GZTR 111,841 34 75,141 67 47,162 42
Car crash
Geo-coordinate 38,656 2 38,656 100 38,656 100 Geoname_SNER 493,906 20 463,505 94 168,068 34 Geoname_GZTR 771,334 31 592,965 77 417,224 54
Car accident
Geo-coordinate 55,943 2 55,943 100 55,943 100 Geoname_SNER 337,662 12 297,844 88 172,755 51 Geoname_GZTR 841,000 30 691,238 82 513,165 61
State level unambiguity is quite different from country level. It drops to 51% on average from country level (85% on average). An average of 51% of tweets are unambiguous with both types of geonames (Geoname_SNER and Geoname_GZTR). Figure 10 (b) and (c) in Section 6.2.1 show the percentages of geo-coordinates or geonames that are unambiguous at country level and state (in US) level, respectively. Regarding geo-ambiguity at country level, geonames extracted using Stanford NER are less ambiguous than those from the gazetteer. An average of 92% of tweets are unambiguous with Geoname_SNER, while an average of 78% of tweets are
Please do not cite
22 LEE, MAGDY, FOX
www.josis.org
unambiguous with Geoname_GZTR. Geo-unambiguity at the state level, with both geonames, however, is much lower than at the country level.
6.3
Result of Experiment 2: Location Indicative Words
We also experimented with location indicative words (LIWs) extracted using Stanford NER and regular expression matching.
6.3.1 Geo-locatability: geo-locatable tweets
We found that location information comes much more from tweet contents (text) using natural language processing techniques, rather than from the Twitter geo-location service. We can find organization names or person names from 4-19 % of tweets when we use Stanford NER, and hashtags or mentions from 17-54% of tweets, while in most collections only around 2% of tweets have geo-coordinates (except 6% for the pothole dataset), as we already discussed in Section 5.2.
Table 11. Experiment result of geo-locating tweets with LIWs
Dataset
(A) Features
Tweets that have features
Tweets that are geo-locatable Number
(B) (B/A) % Number (C) (C/B) % Water
main break
Organization_SNER 21,358 14 17,336 81
Person_SNER 16,576 11 15,267 92
Hashtag 48,023 31 29,353 61
Mention 78,877 51 18,186 23
Sinkhole
Organization_SNER 20,563 9 17,373 84
Person_SNER 25,747 11 20,448 79
Hashtag 78,629 34 36,325 46
Mention 177,854 77 40,741 23
Pothole
Organization_SNER 30,176 9 14,684 49
Person_SNER 14,504 4 10,847 75
Hashtag 54,481 17 24,965 46
Mention 121,324 37 31,150 26
Car crash
Organization_SNER 186,048 7 136,554 73
Person_SNER 534,956 21 318,680 60
Hashtag 419,596 17 189,685 45
Mention 1,363,198 54 230,615 17
Car accident
Organization_SNER 133,355 5 107,337 80
Person_SNER 532,193 19 330,873 62
Hashtag 474,749 17 177,018 37
Mention 1,502,467 53 219,292 15
Please do not cite
A Study on Geo-locating Tweets with Less Ambiguity 23
Table 11 shows the outcome of the experiments in terms of number of tweets that have those features (LIWs) and their geo-locatability.
Figure 11 (a) shows percentages of geo-locatable tweets with LIWs. In most collections, organization names are most geo-locatable, while person names come second. Hashtags come third, while mention is the least geo-locatable feature. Around 80% of tweets that have organization names extracted using Stanford NER are geo-locatable in most collections, except the pothole collection only has 49%. On the other hand, only around 20% of tweets are geo-locatable when we use mention.
Please do not cite
24 LEE, MAGDY, FOX
www.josis.org
Figure 11. Percentages of LIWs that are (a) geo-locatable, (b) unambiguous at country level, and (c) unambiguous at state level in US
86% 78% 87% 87% 80% 77% 85% 84% 81% 76% 67% 82% 72% 83% 77% 80% 81% 81% 80% 82%
0% 10% 20% 30% 40% 50% 60% 70% 80% 90% 100% Or ga ni za tio n_ SN ER Pe rs on _S N ER Ha sh ta g Me nt io n Or ga ni za tio n_ SN ER Pe rs on _S N ER Ha sh ta g Me nt io n Or ga ni za tio n_ SN ER Pe rs on _S N ER Ha sh ta g Me nt io n Or ga ni za tio n_ SN ER Pe rs on _S N ER Ha sh ta g Me nt io n Or ga ni za tio n_ SN ER Pe rs on _S N ER Ha sh ta g Me nt io n
Water Main Break Sinkhole Pothole Car Crash Car Accident
unambiguous_country(%) ambiguous_country(%)
63% 51%
45% 61% 47% 44% 46% 46% 41% 39% 22% 48% 46% 54% 33% 40% 51% 46% 39% 40%
0% 10% 20% 30% 40% 50% 60% 70% 80% 90% 100% Or ga ni za tio n_ SN ER Pe rs on _S N ER Ha sh ta g Me nt io n Or ga ni za tio n_ SN ER Pe rs on _S N ER Ha sh ta g Me nt io n Or ga ni za tio n_ SN ER Pe rs on _S N ER Ha sh ta g Me nt io n Or ga ni za tio n_ SN ER Pe rs on _S N ER Ha sh ta g Me nt io n Or ga ni za tio n_ SN ER Pe rs on _S N ER Ha sh ta g Me nt io n
Water Main Break Sinkhole Pothole Car Crash Car Accident
unambiguous_state(%) ambiguous_state(%) 81% 92% 61% 23% 49% 75% 46% 26% 84% 79% 46% 23% 73% 60% 45% 17% 80% 62% 37% 15% 0% 10% 20% 30% 40% 50% 60% 70% 80% 90% 100% Or ga ni za tio n_ SN ER Pe rs on _S N ER Ha sh ta g Me nt io n Or ga ni za tio n_ SN ER Pe rs on _S N ER Ha sh ta g Me nt io n Or ga ni za tio n_ SN ER Pe rs on _S N ER Ha sh ta g Me nt io n Or ga ni za tio n_ SN ER Pe rs on _S N ER Ha sh ta g Me nt io n Or ga ni za tio n_ SN ER Pe rs on _S N ER Ha sh ta g Me nt io n
Water Main Break Sinkhole Pothole Car Crash Car Accident
geo-locatable(%) non-geo-locatable(%)
(a) Percentages of LIWs that are geo-locatable
(b) Percentages of LIWs that are unambiguous at country level
(c) Percentages of LIWs that are unambiguous at state level in U.S.
Please do not cite
A Study on Geo-locating Tweets with Less Ambiguity 25
However, when we consider the number of tweets with those features, hashtag and mention have the largest number of tweets that are geo-locatable in the small collections (water main break, sinkhole, and pothole), while person name has the largest number of tweets in the big collections (car crash and car accident). See Table 11 for details.
6.3.2 Geo-unambiguity: unambiguous tweets
We evaluated the geo-ambiguity at two levels: country and state in US. Table 12 shows experiment results regarding LIWs of geo-locatability and geo-ambiguity at country level and state (in US) level.
According to the results of the experiment, when we consider number of tweets that have LIWs, small collections (water, main break, sinkhole, pothole) have more hashtags or mentions that are geo-locatable than organization name or person name. In contrast, in big collections (car crash and car accident), geo-locatable person name can be found more than other features.
Figure 11 (b) and (c) in Section 6.3.1 show the ratio of geo-coordinate or geonames that are unambiguous at the country level and state (in U.S.) level, respectively. Geo-unambiguity at country level in all collections is 80% on average. State level geo-unambiguity is much lower than country level. It drops to 45% on average from 80% at country level (on average), because many more geonames are shared at state level than country level.
Table 12. Experiment result of geo-locatability and country/state level ambiguity of the LIWs
Dataset
(A) Features
Tweets that are geo-locatable
Tweets that are unambiguous in
country level
Tweets that are unambiguous in
state level Number
(B)
% (B/A)
Number (C)
% (C/B)
Number (D)
% (D/B)
Water Main Break
Organization_SNER 17,336 11 14,875 86 10,853 63
Person_SNER 15,267 10 11,850 78 7,770 51
Hashtag 29,353 19 25,485 87 13,295 45
Mention 18,186 12 15,823 87 11,172 61
Sink-hole
Organization_SNER 17,373 8 13,817 80 8,217 47
Person_SNER 20,448 9 15,649 77 9,005 44
Hashtag 36,325 16 30,907 85 16,662 46
Mention 40,741 18 34,275 84 18,889 46
Pothole
Organization_SNER 14,684 5 11,897 81 6,080 41
Person_SNER 10,847 3 8,267 76 4,213 39
Hashtag 24,965 8 16,831 67 5,433 22
Mention 31,150 10 25,438 82 14,950 48
Car crash
Organization_SNER 136,554 5 98,626 72 62,890 46 Person_SNER 318,680 13 266,035 83 170,576 54
Hashtag 189,685 8 146,720 77 63,240 33
Please do not cite
26 LEE, MAGDY, FOX
www.josis.org
Mention 230,615 9 184,113 80 91,184 40
Car acciden
t
Organization_SNER 107,337 4 86,700 81 54,751 51 Person_SNER 330,873 12 266,716 81 151,340 46
Hashtag 177,018 6 142,284 80 68,756 39
Mention 219,292 8 180,290 82 87,664 40
6.4
Results of Experiments 3 and 4: Geonames and LIWs
We evaluated how a combination of geonames and LIWs effected the geo-locatability and geo-unambiguity of tweets. To geo-locate tweets with both Geoname_SNER and LIWs, we followed a decision tree, as shown in Figure 12.
Figure 12. Decision tree for combining geonames and LIWs
For example, state A denotes tweets that have geonames (using Stanford NER or gazetteer), while state B denotes tweets that are geo-locatable. For example, in the water main break collection, we find 56,397 tweets (36% of 155,657 in total) that have geonames extracted using the Stanford NER and, of those, 55,088 tweets that are geo-locatable using the Google Geo-coding API; see details in Table 9 in Section 6.2.1. Some tweets, however, are not geo-locatable (state b), although they have geonames. These are relatively small, 1,309 out of 56,397 (2%). We may find geo-locatable tweets (state C) from those tweets by adding LIWs. State G denotes tweets that are geo-locatable when we use LIWs only while state G* denotes tweets that are unambiguous at country or state level. State D represents tweets that are geo-locatable when we use both geonames and LIWs while state D* represents tweets that are unambiguous at country or state level. Number of tweets of state D and D* is quite small.
Tweets in state a, 99,260 out of 155,657 in total (64%), do not have any geonames in the tweet text. However, we may find LIWs (state E). Many of them are geo-locatable (state F), e.g., 19,671 hashtags out of 99,260 tweets; see details in Table 14 in Appendix A.1.1.
Start
A
B
b
C
c
D
d
G
g
a E
e
F
f Has geoname?
Yes
No
Geo-locatable? Geo(geoname)Yes
No Has LIW?
Yes
No
Geo-locatable?
Geo(geoname + liw)Yes
Has LIW? Yes
No
Geo-locatable? Geo(liw)
Yes
Geo-locatable? Geo(liw)
Yes
No No
No
B*
D*
G*
F* Unambiguous?Yes
No
Unambiguous?Yes
Unambiguous?Yes
Unambiguous? Yes
No
No
No
Please do not cite
A Study on Geo-locating Tweets with Less Ambiguity 27
State F* denotes tweets that are unambiguous at country or state level. The counts of state F and state G depend on the number of geonames (state A) and geo-locatability of geonames (state B).
6.4.1 Geonames (Geoname_SNER) and LIWs
Experiment results for the combination of geonames using Stanford NER and LIWs are shown in Figure 13 and detailed results are included in part A.1 of Appendix A. Part (a) of Figure 13 shows the number of tweets that are geo-locatable, (b) shows the number of tweets that are unambiguous at country level, and (c) shows the number of tweets that are unambiguous at state level. The states, B(B*), F(F*), and G(G*), are shown as blue, orange, and grey respectively in Figure 13 and Figure 14. The height of the stacked bar shows total number of tweets of the combined state groups.
In part (a) of Figure 13 and Figure 14, the blue bar (B) denotes the number of tweets that are geo-locatable with geonames. The number of tweets in those blue bars are same per each collection. The orange bar (F) denotes the number of tweets that are geo-locatable with LIWs, which does not have any geonames and are geo-located using LIWs. The grey bar (G) denotes the number of tweets that are geo-locatable with LIWs, which are not geo-locatable with geonames although they have geonames in the tweet text.
In part (b) of Figure 13 and Figure 14, the blue bar (B*) denotes the number of tweets that are unambiguous at country level when we geo-locate the tweets with geonames. The number of tweets in those blue bars are same per each collection. The orange bar (F*) denotes unambiguous tweets at country level, which does not have any geonames and are geo-located using LIWs. The grey bar (G*) denotes the number of tweets that are unambiguous at country level, which are geo-located using LIWs for they are not geo-locatable with geonames although they have geonames in the tweet text.
In part (c) of Figure 13 and Figure 14, the blue bar (B*), the orange bar (F*), and the grey bar (G*) are similar to those of part (b), but they denote the number of tweets that are unambiguous at state level in the U.S.
In most cases, hashtags and mentions are more helpful, for they have higher orange bar (F) and grey bar (G), than other features (organization and person name) to geo-locate tweets. For example, in water main break collection, more tweets are geo-geo-located with hashtags (F: 19,672 and G: 218) or mentions (F: 11,683 and G: 172) than organization names (F: 11,513 and G: 114) or person names (F: 10,436 and G: 150). For big datasets (car crash and car accident), however, person names are more helpful than other features, as shown in Figure 13.
Please do not cite
28 LEE, MAGDY, FOX
www.josis.org
Figure 13. Experiment results of combination of geoname (SNER) and LIWs
6.4.2 Geonames (Geoname_ Gazetteer) and LIWs
Experiment results of combinations of geonames using gazetteer and LIWs are shown in Figure 14 and detailed results are included in A.2 of Appendix A. Part (a) shows the number of tweets that are geo-locatable, (b) shows number of tweets that are unambiguous at country level, and (c) shows number of tweets that are unambiguous at state level in U.S.
Similar to the results of combinations of geonames (SNER) and LIWs, see details in Section 6.4.1, hashtag and mention are more helpful than other features (organization and person name) to geo-locate tweets in the pothole, car crash, and car accident datasets, as shown in Figure 14. However, most features are less helpful in the water main break dataset, because LIWs are extracted from the 30% of tweets that don’t have a geoname (70% of tweets in water main break collection have geonames).
0 10,000 20,000 30,000 40,000 50,000 60,000 70,000 80,000 90,000 100,000 Or g. _S N ER Pe rs on _S N ER Ha sh ta g Me nt io n Or g. _S N ER Pe rs on _S N ER Ha sh ta g Me nt io n Or g. _S N ER Pe rs on _S N ER Ha sh ta g Me nt io n
Geoname_SNER Geoname_SNER Geoname_SNER Water Main Break Sinkhole Pothole
B F G
0 100,000 200,000 300,000 400,000 500,000 600,000 700,000 800,000 900,000 Or g. _S N ER Pe rs on _S N ER Ha sh ta g Me nt io n Or g. _S N ER Pe rs on _S N ER Ha sh ta g Me nt io n Geoname_SNER Geoname_SNER Car Crash Car Accident
B F G
0 10,000 20,000 30,000 40,000 50,000 60,000 70,000 80,000 90,000 100,000 Or g. _S N ER Pe rs on _S N ER Ha sh ta g Me nt io n Or g. _S N ER Pe rs on _S N ER Ha sh ta g Me nt io n Or g. _S N ER Pe rs on _S N ER Ha sh ta g Me nt io n
Geoname_SNER Geoname_SNER Geoname_SNER Water Main Break Sinkhole Pothole
B* F* G*
0 100,000 200,000 300,000 400,000 500,000 600,000 700,000 800,000 900,000 Or g. _S N ER Pe rs on _S N ER Ha sh ta g Me nt io n Or g. _S N ER Pe rs on _S N ER Ha sh ta g Me nt io n Geoname_SNER Geoname_SNER Car Crash Car Accident
B* F* G*
0 10,000 20,000 30,000 40,000 50,000 60,000 70,000 80,000 90,000 100,000 Or g. _S N ER Pe rs on _S N ER Ha sh ta g Me nt io n Pe rs on _S N ER Pe rs on _S N ER Ha sh ta g Me nt io n Pe rs on _S N ER Pe rs on _S N ER Ha sh ta g Me nt io n
Geoname_SNER Geoname_SNER Geoname_SNER Water Main Break Sinkhole Pothole
B* F* G*
0 100,000 200,000 300,000 400,000 500,000 600,000 700,000 800,000 900,000 Pe rs on _S N ER Pe rs on _S N ER Ha sh ta g Me nt io n Pe rs on _S N ER Pe rs on _S N ER Ha sh ta g Me nt io n Geoname_SNER Geoname_SNER Car Crash Car Accident
B* F* G*
(a) Number of tweets that are geo-locatable
(b) Number of tweets that are unambiguous at country level
(c) Number of tweets that are unambiguous at state level in U.S.
Please do not cite
A Study on Geo-locating Tweets with Less Ambiguity 29
Figure 14. Experiment results of combination of geoname (GZTR) and LIWs
6.5
Comparison of Experiment Results
Figure 15 shows a comparison of experiment results in terms of number of tweets that are geo-locatable and unambiguous at country/state level and detailed results are included in Appendix A. Part (a) shows numbers of tweets that are geo-locatable. Sub-figures (b) and (c) show numbers of tweets that have unambiguous location at country level and state level in the U.S., respectively.
In part (a) of Figure 15, the blue bar (SNER) denotes the number of tweets that are geo-locatable with geonames while the orange bar (SNER+LIWs) denotes the number of tweets that are geo-locatable when geo-located by both SNER and LIWs. The grey bar (GZTR) denotes the number of tweets that are geo-locatable with Gazetteer while the yellow bar (GZTR+LIWs) denotes the number of tweets that are geo-locatable when geo-located by both Gazetteer and LIWs. Similar to part (a), bars in part (b) and (c) of Figure 15 denote numbers of tweets that have an unambiguous location at country
0 20,000 40,000 60,000 80,000 100,000 120,000 140,000 Or g. _S N ER Pe rs on _S N ER Ha sh ta g Me nt io n Or g. _S N ER Pe rs on _S N ER Ha sh ta g Me nt io n Or g. _S N ER Pe rs on _S N ER Ha sh ta g Me nt io n
Geoname_GZTR Geoname_GZTR Geoname_GZTR
Water Main Break Sinkhole Pothole
B F G
0 100,000 200,000 300,000 400,000 500,000 600,000 700,000 800,000 900,000 1,000,000 Or g. _S N ER Pe rs on _S N ER Ha sh ta g Me nt io n Or g. _S N ER Pe rs on _S N ER Ha sh ta g Me nt io n Geoname_GZTR Geoname_GZTR
Car Crash Car Accident
B F G
0 20,000 40,000 60,000 80,000 100,000 120,000 140,000 Or g. _S N ER Pe rs on _S N ER Ha sh ta g Me nt io n Or g. _S N ER Pe rs on _S N ER Ha sh ta g Me nt io n Or g. _S N ER Pe rs on _S N ER Ha sh ta g Me nt io n
Geoname_GZTR Geoname_GZTR Geoname_SNER
Water Main Break Sinkhole Pothole
B* F* G*
0 100,000 200,000 300,000 400,000 500,000 600,000 700,000 800,000 900,000 1,000,000 Or g. _S N ER Pe rs on _S N ER Ha sh ta g Me nt io n Or g. _S N ER Pe rs on _S N ER Ha sh ta g Me nt io n Geoname_GZTR Geoname_GZTR
Car Crash Car Accident
B* F* G*
0 20,000 40,000 60,000 80,000 100,000 120,000 140,000 Or g. _S N ER Pe rs on _S N ER Ha sh ta g Me nt io n Or g. _S N ER Pe rs on _S N ER Ha sh ta g Me nt io n Or g. _S N ER Pe rs on _S N ER Ha sh ta g Me nt io n
Geoname_GZTR Geoname_GZTR Geoname_GZTR
Water Main Break Sinkhole Pothole
B* F* G*
0 100,000 200,000 300,000 400,000 500,000 600,000 700,000 800,000 900,000 1,000,000 Or g. _S N ER Pe rs on _S N ER Ha sh ta g Me nt io n Or g. _S N ER Pe rs on _S N ER Ha sh ta g Me nt io n Geoname_GZTR Geoname_GZTR
Car Crash Car Accident
B* F* G*
(a) Number of tweets that are geo-locatable
(b) Number of tweets that are unambiguous at country level
(c) Number of tweets that are unambiguous at state level in U.S.
Please do not cite
30 LEE, MAGDY, FOX
www.josis.org
level and state level in the U.S., respectively and geo-located by SNER, SNER and LIWs, Gazetteer, and Gazetteer and LIWs, respectively.
According to the experiment results, LIWs help, in all cases, to better geo-locate tweets, and also lead to less ambiguous locations at country/state levels. We also found in most cases that hashtags and mentions are more effective as additional location information to geo-locate tweets than organization name or person name, as shown in Figure 15.
Figure 15. Comparison of experiment results: number of tweets that are (a) geo-locatable, (b) unambiguous in country level, (c) unambiguous in state level in U.S.
Note that the number of tweets that have geonames extracted using the gazetteer is much bigger than when using Stanford NER, in most cases and datasets, as shown in Table 9 in Section 6.2.1.
However, we cannot say that the gazetteer extracts more geonames that are accurate than Stanford NER, because gazetteer matching cannot identify whether a word is a geoname or non-geoname in the context. For example, the gazetteer always thinks “Love” is a geoname, because it has the word “Love” in its dictionary for “Township of
-20,000 40,000 60,000 80,000 100,000 120,000 Or g. _S N ER Pe rs on _S N ER Ha sh ta g Me nt io n Pe rs on _S N ER Pe rs on _S N ER Ha sh ta g Me nt io n Or g. _S N ER Pe rs on _S N ER Ha sh ta g Me nt io n
Water Main Break Sinkhole Pothole SNER SNER+LIWs GZTR GZTR+LIWs
-100,000 200,000 300,000 400,000 500,000 600,000 700,000 800,000 900,000 1,000,00