© 2014 Electronic Journal of Science Education (Southwestern University/Texas Christian University) Retrieved from http://ejse.southwestern.edu
Evaluating strategies for inclusion of environmental literacy in the elementary school classroom
Kathryn T. Stevenson
North Carolina State University USA
Sarah J. Carrier
North Carolina State University USA
M. Nils Peterson
North Carolina State University USA
Abstract
Although elementary school may be a prime stage for building environmental literacy, elementary school teachers face significant barriers to including it in their instruction. Several studies have identified teachers’ limited ecological science content knowledge and heavy emphasis on state standards and testing as common constraints to environmental literacy instruction. However, few of these studies have measured actual (versus perceived) ecological knowledge or focused on how teachers are successful in including environmental literacy instruction despite constraints of standards and testing. The present exploratory study surveyed 627 randomly selected elementary school teachers in North Carolina to begin addressing this gap. We found ecological knowledge levels were high (89.9% average score). Lack of instructional time was the most oft-listed barrier to environmental literacy instruction (76.7%), followed by lack of resources (53.4%), whereas lack of content knowledge was rarely mentioned (21.6%). Respondents identified access to environmental literacy-related lesson plans, activities that integrate children’s literature, and access to and training in published environmental education curricula as the resources needed to be more successful in inclusion of environmental literacy concepts in the elementary school classroom.
Correspondence concerning this article should be addressed to Kathryn Stevenson, Jordan 4125, Box 8008, North Carolina State University, Raleigh, NC 27695, kathryn_stevenson@ncsu.edu.
Key words: environmental literacy, environmental education, elementary education, professional development, pedagogical content knowledge
Introduction
pro-Electronic Journal of Science Education ejse.southwestern.edu environmental behavior comprise environmental literacy (Hollweg et al., 2011). Early intervention is likely important, as research suggests experiences in elementary school can predict learning trajectories into adulthood (Gorey, 2001). Young students are able to learn rich science content (Gelman & Brenneman, 2004; National Research Council, 2007), and children in younger grades may be more receptive to environmental literacy efforts, with environmental literacy learning slowing as early as eighth grade (Author, 2013) and interest in science declining at the end of elementary school (Archer et al., 2010; Kirikkaya, 2011). This decline is pronounced with female students (Dawson, 2000; Evans, Schweingruber, & Stevenson, 2002) and especially among low income and minority girls (Calabrese Barton, Tan, & Rivet, 2008). Further, many teachers see environmental literacy as a natural fit for elementary classrooms, as it offers a high potential for cross-disciplinary instruction that becomes less fluid in middle and high school grades (Forbes & Zint, 2010).
Despite the high potential for success of environmental literacy efforts in elementary school classrooms, several barriers related to science instruction may hinder their inclusion. Although environmental literacy concepts are interdisciplinary and include skills built within social studies curricula and address a diverse range of disciplines, most elementary school teachers see environmental education situated within science instruction (Forbes & Zint, 2010). At the same time, elementary science seems to be shortchanged, receiving less instruction than other subjects (Tilgner, 1990). Teachers cite lack of time, testing pressure, lack of background knowledge, and low self-efficacy in teaching science as explanations for deemphasizing science instruction in K-5 classrooms (Ekborg, 2003; Forbes & Davis, 2010; Ko & Lee, 2003; Tal & Argaman, 2005). Within the United States, these barriers have been linked to the weight placed on reading and mathematics testing through No Child Left Behind (NCLB) legislation (107th Congress, 2002), and this pattern of emphasis on mathematics and literacy continues with Common Core standards (National Governors Association [NGA], 2010). Science is less frequently assessed when compared to language arts and mathematics, and some researchers contend that the low emphasis on science in testing and standards makes teachers more likely to marginalize science instruction (Marx & Harris, 2006). Similarly, teacher preparation programs may deemphasize science content, leading to low levels of preparedness in science and self-efficacy among teachers (Appleton & Kindt, 2002). For instance, a 2011 survey reported that 90% of California elementary school teachers felt prepared to teach mathematics and reading, but only one-third felt prepared to teach science (Dorph, Shields, Tiffany-Morales, Hartry, & McCaffrey, 2011). The perceived place of environmental literacy within the science subject area (Forbes & Zint, 2010) may suggest that barriers inhibiting science instruction could also affect the inclusion of environmental literacy concepts. Further, similar barriers have been shown in the context of sustainability education (Evans, Whitehouse, & Gooch, 2012), education for sustainable development (Spiropoulou & Antonakaki, 2007), and outdoor education (Rickinson et al., 2004).
Electronic Journal of Science Education ejse.southwestern.edu education in middle schools and reported that teachers with positive environmental attitudes, high levels of environmental literacy, and overall receptiveness to environmental education were more likely to implement it in their classrooms. Forbes and Zint (2010) suggested that providing curricular materials, offering pre-service environmental education methods courses, and continued professional development focused on environmental issues may build both self-efficacy and motivation for environmental literacy instruction. However, because even those teachers who intended to include environmental literacy reported to devoting less than 1.3% of instructional time to that end (Forbes & Zint, 2010), efforts to boost environmental literacy in K-5 classrooms should focus on building not only motivation among teachers, but also strategies to overcome barriers that even the most dedicated teachers face. Teachers repeatedly point to constraints related to testing and standards as to why science and environmental literacy concepts are not included in the classroom (Ekborg, 2003; Forbes & Davis, 2010; Ko & Lee, 2003; Tal & Argaman, 2005). Despite legitimate concerns about educational barriers created by high stakes testing (Jones, Jones, & Hargrove, 2003), the model is here to stay (Moses & Nanna, 2007), so identifying possible ways to overcome barriers is potentially more important than trying to remove them.
Study objectives and research questions
The present study aimed to address several gaps in research around the inclusion of environmental literacy concepts within elementary school classrooms through a state-wide survey of North Carolina, USA elementary school teachers. Several studies suggest elementary school teachers shy away from environmental literacy concepts because they lack content knowledge (Appleton & Kindt, 2002; Ernst, 2009). Although environmental literacy includes other components (building environmental attitudes, issue identification and analysis skills, and fostering motivation for action), ecology lies at the core of content knowledge (Hollweg et al., 2011; Hungerford & Volk, 1990), and ecological knowledge is the entry point for building environmental literacy. Most of the studies addressing the importance of content knowledge have focused on perceived knowledge levels, and it is possible that low teacher self-efficacy in teaching environmental literacy concepts is related to perceived rather than actual content preparedness. This distinction between actual and perceived preparedness is an important one, as building actual environmental literacy versus building teachers’ confidence in the ability to teach environmental literacy will require different strategies. Additionally, instead of only focusing on the types of barriers teachers face, we were interested in the ways teachers are successful at including environmental literacy in their classrooms with the goal of uncovering potential strategies for overcoming barriers. Specifically, we sought to understand the contexts in which teachers are able to incorporate environmental literacy as well as methods teachers view as important in overcoming the relatively stable institutional barriers of standards and testing. Our research questions included:
1. What are the actual ecological knowledge levels among elementary school teachers? 2. What barriers do teachers find the most constraining to including environmental literacy? 3. In what contexts do teachers successfully incorporate environmental literacy into their
instruction?
Electronic Journal of Science Education ejse.southwestern.edu Methods
Sampling
To construct our random sample of elementary school teachers in North Carolina, we first randomly selected 90 schools of all 1,571 elementary schools in the state. We constructed a list of all K-5 teachers at these 90 schools, which resulted in a list of 1,951 elementary school teachers. We emailed all of these teachers an invitation to participate in the study and included a link to the online survey. The invitation included a brief description of environmental literacy and an explanation that we were seeking to understand how teachers address the environment in their classrooms and identify strategies to support their efforts. After the initial invitation, we sent out four e-mail reminders in 3-7 day increments. Additionally, as an incentive for participation, all teachers who completed the survey were entered into a drawing for one of three gift cards to a popular online merchant. Of the 627 respondents (32.1% response rate), 536 completed the entire survey (85.5% compliance). On average, our sample was mostly female (95.1%) and Caucasian (89.2%) with fewer African-American (7.22%), Asian (0.57%) and mixed race individuals (3.04%). Respondents included 90 Kindergarten teachers (16.7%), 104 first grade teachers (19.4%), 93 second grade teachers (17.4%), 87 third grade teachers (16.2%), 107 fourth grade teachers (20.0%), and 117 fifth grade teachers (21.8%).
We evaluated potential for selection bias using a continuum of resistance model. This approach assumes individuals who display the most resistance to participation (e.g., requiring the most reminders) are more similar to non-respondents than individuals who chose to participate with little or no resistance (Kypri, Stephenson, & J, 2004; Serenari, Peterson, Moorman, Cubbage, & Jervis, 2014). We divided respondents into four groups based on whether they responded after the initial survey invitation or after one, two, or three reminders to participate (n = 95, 301, 78, 57, respectively). We compared these response groups to variables of interest, including ecological knowledge, subjects in which teachers include environmental literacy concepts, barriers teachers experience to including environmental literacy, and resources teachers want more of to teach environmental literacy. Because knowledge level was a continuous variable, we used an ANOVA with a series of post-hoc t-tests corrected for false discovery rate (Benjamini & Hochberg, 1995) to compare the four response groups. Responses to the other four variables were binary (yes/no), and we used a Chi-square test to evaluate differences between the groups. We found differences in knowledge levels among the response groups (see Results), but found no differences related to any other variables of interest.
Instrument development
Electronic Journal of Science Education ejse.southwestern.edu instruction, and resources teachers believe would help promote environmental literacy within elementary school classrooms. See Figures 1-3 for the questions and response options.
Because the MSELS is designed for middle school students and we designed many of the remaining questions, we pilot tested our instrument with 57 pre-service elementary school teachers before use with the full sample. We administered a draft of the survey and asked for general verbal feedback from all pre-service teachers. Following this survey, we held an informal focus group with five of the 57 pre-service teachers to gain insight on general readability and validity. We asked focus group participants questions similar to those that would be used in a cognitive interview (Desimone & Le Floch, 2004), such as “What does this question mean to you?” or “Which questions proved difficult to answer and why?” Insights from the focus group’s verbal feedback resulted in minor revisions to the survey for clarity, although all survey items displayed normality of responses.
Data analysis
We completed analysis using STATA version 12.1. We scored the environmental knowledge scale using guidelines developed by the MSELS authors (McBeth et al., 2008), resulting in scores for each individual question as well as a score for the entire scale. For the question asking teachers to indicate barriers to inclusion of environmental literacy, we first ranked the barriers from most often to least often chosen. Next, we performed a series of one-tailed t-tests to determine whether the percentage of teachers choosing one barrier was statistically more than the next commonly chosen barrier. All tests were performed using alpha level 0.05 after correction for false discovery rate (Benjamini & Hochberg, 1995). When several t-tests are performed on the same sample, the likelihood of making a Type I error increases. Correcting for false discovery rate involves accounting for this possibility by dividing alpha by the number of tests you are preforming (Benjamini & Hochberg, 1995). We performed a similar analysis (ranking and a series of t-tests) for responses to the question asking in which subjects teachers include environmental literacy as well as which resources would most support teachers in including environmental literacy in their instruction.
Results
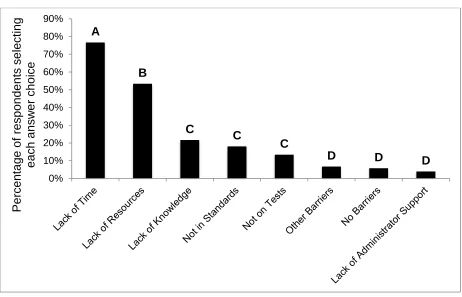
Electronic Journal of Science Education ejse.southwestern.edu reading while integrating other curricular areas.” Teachers listed the absence of environmental literacy concepts in state standards and tests as barriers to the inclusion of environmental literacy (18.1% and 13.4%, respectively), some teachers listed other barriers (6.7%) such as lack of funding or time needed to learn a new curriculum, while others reported that they either experienced no barriers (5.8%) or lack of administrator support (3.9%) (Figure 1).
Figure 1. Percentage of respondents who indicated each barrier presented a constraint to including environmental literacy during instruction. Respondents were asked, “Which of the following barriers, if any, do you experience in teaching about the environment in your class?” They were asked to check all that apply from the choices displayed here. Letters indicate statistical difference based on one-sided t-tests between consecutive pairs of barriers (i.e., A is different from B, is different from C, is different from D).
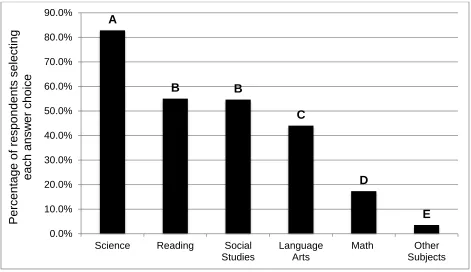
Although teachers were most likely to indicate that they teach environmental literacy concepts in science, most respondents also reported integrating environmental literacy into other subjects (research question three, Figure 2). Almost all teachers reported teaching about the environment in some capacity (91.4%), and teachers were most likely to teach environmental literacy concepts in science (82.8%). Significantly fewer teachers teach environmental literacy in reading and social studies (55.0% and 54.7%, respectively), followed by language arts (44.0%), mathematics (17.4%) and other subjects (3.5%). A majority (79.1%) of teachers reported using children’s literature to teach about the environment, followed by field trips (54.9%), school grounds (54.9%), guest speakers (31.6%), environmental education curricula (27.2%) and other resources (24.3%). Commonly listed resources in the “other” response included Internet resources, streaming videos from websites such as Discovery Education, and textbooks.
A
B
C
C
C
D D D
0% 10% 20% 30% 40% 50% 60% 70% 80% 90%
P
e
rcen
ta
g
e
o
f
resp
o
n
d
e
n
ts
se
lect
ing
e
a
ch
a
n
sw
e
r cho
Electronic Journal of Science Education ejse.southwestern.edu Figure 2. Percentage of respondents who indicated that they teach about the environment in each subject. Respondents were asked “In which subject areas do you teach about the environment?” They were asked to check all that apply from the choices listed here. Letters indicate statistical difference based on one-sided t-tests between consecutive pairs of barriers. (i.e., A is different from B, is different from C, is different from D, is different from E).
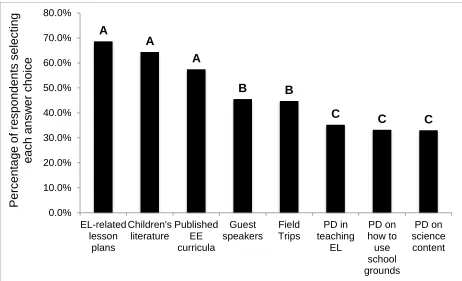
Most teachers reported that they would like to teach about the environment more, and they identified environment-related lesson plans, children’s literature, and published environmental education (EE) curricula (e.g., Project WET, Project WILD) as the most needed resources to support teaching more environmental literacy (research question four, Figure 3). Only one respondent indicated that he or she would like to teach about the environment less (0.2%), 24.8% indicated they are happy with how much they teach about the environment, 45.7% indicated they would like to teach about it a little more, and 29.3% indicated they would like to teach about it much more. Most teachers indicated they would like to have more environment related lesson plans (68.7%), followed by more children’s literature related to the environment (64.4%) and published EE curricula (57.5%). Teachers indicated some desire for guest speakers (45.5%) and field trips (44.8%), followed by professional development in teaching about the environment (33.3%), how to use school grounds to teach about the environment (33.2%) and support for science content (33.0%).
A
B B
C
D
E
0.0% 10.0% 20.0% 30.0% 40.0% 50.0% 60.0% 70.0% 80.0% 90.0%
Science Reading Social
Studies
Language Arts
Math Other
Subjects
P
e
rcen
ta
g
e
o
f
resp
o
n
d
e
n
ts
se
lect
ing
e
a
ch
a
n
sw
e
r cho
Electronic Journal of Science Education ejse.southwestern.edu Figure 3. Percentage of respondents who indicated each type of support to more effectively include environmental literacy during instruction. Respondents were asked, “Which of the following resources would you like more of to teach about the environment?” They were asked to check all that apply out of the choices displayed here. Letters indicate statistical difference based on one-sided t-tests between consecutive pairs of barriers (i.e., A is different from B, is different from C).
Discussion
Our results support previous research indicating state standards and testing create barriers to inclusion of environmental literacy in elementary classrooms (Marx & Harris, 2006), but these barriers were relatively unimportant compared to lack of time and resources. Lack of time was the single most frequently listed barrier to environmental literacy, which may be explained by previous research suggesting that K-5 teachers feel forced to emphasize the heavily tested areas of mathematics and reading over science or interdisciplinary topics related to sustainability (N. Evans et al., 2012; Marx & Harris, 2006). Comments provided by teachers in this study support the assertion that heavy emphasis on mathematics and reading dictated by state standards and high stakes testing ultimately marginalizes environmental literacy (Forbes & Davis, 2010; Ko & Lee, 2003; Tal & Argaman, 2005). Teachers, however, did not explicitly link testing to time constraints as the former was perceived as relatively unimportant. As barriers related to limited time and resources are relatively static and hard to change, our results highlight why negotiation of barriers will be a critical skill teachers need to effectively teach environmental literacy concepts in elementary school classrooms (Ernst, 2009; Stevenson, 2007). Teachers must be equipped with strategies for including environmental literacy despite the marginalization of
A
A
A
B B
C C C
Electronic Journal of Science Education ejse.southwestern.edu science in the elementary school classroom. Promisingly, at least some teachers in this study capitalized on the interdisciplinary nature of environmental literacy, integrating environmental literacy concepts into subjects other than science, especially reading and language arts. Although science is one of the least-tested subjects in elementary school classrooms across the United States and often only tested in fifth grade, reading is heavily tested throughout elementary school (Wright, 2002). Integrating environmental literacy into reading and language arts may be a successful strategy for teachers to introduce and reinforce environmental literacy concepts while augmenting, rather than encroaching on, instructional time dedicated to the more heavily tested subjects. More efforts to teach environmental literacy in elementary school classrooms is critical, but such efforts should support teachers’ efforts to teach environmental literacy within the constraints they face.
Teacher interest in children’s literature related to environmental concepts may point to one way to overcome barriers presented by high stakes testing. Specifically, children’s literature related to environmental concepts can be used to promote environmental literacy while preparing students for more heavily tested subjects such as reading. However, with the implementation of Common Core (NGA, 2010) standards that present science embedded in literacy goals, one concern is that science will be relegated to reading a non-fiction textbook rather than using literacy instruction to supplement students’ science investigations. Environmental literacy efforts should work to ensure literacy instruction complements rather than overwhelms science in K-5 classrooms. Wells and Zeece (2007) have identified strategies for effectively incorporating literature in environmental education with young children, helping students develop a sense of place by linking students’ readings with their experiences in the natural world. Environmental literacy concepts have the potential to engage students in investigations that are place-based and span disciplines in elementary classrooms (Woodhouse & Knapp, 2000). Several scholars suggest framing environmental literacy as a valuable instructional strategy in reading and mathematics rather than yet another topic to cover (N. Evans et al., 2012; Spiropoulou & Antonakaki, 2014). Our finding that teachers listed children’s literature as one of the most-needed resources to teach environmental literacy suggests such framing would be productive and build on demand already present among K-5 teachers. Environmental literacy instruction may offer a path for teachers to effectively build literacy skills while addressing science concepts rather than trying to insert disjointed science topics within non-fictional reading lessons (Glynn & Muth, 1994).
Electronic Journal of Science Education ejse.southwestern.edu (Author, 2013). Especially considering the relatively low percentage of teachers who use EE curricula and the high percentage of teachers who requested it, promoting professional development opportunities centered around EE curricula may be a successful strategy for supporting elementary school teachers in building environmental literacy among their students.
Somewhat surprisingly, both self-report and knowledge test results suggest lack of knowledge was not a serious obstacle for inclusion of environmental literacy concepts among K-5 teachers. Previous literature suggests teachers shy away from teaching environmental literacy topics due to low self-efficacy, which may be rooted in actual lack of content knowledge among teachers, or erroneously believing they lack the knowledge (Appleton & Kindt, 2002; Spiropoulou & Antonakaki, 2007). High scores on the ecological knowledge scale in this study suggest that teachers likely have the level of knowledge necessary to teach environmental literacy. Although we did find some statistical difference between knowledge levels among respondent groups, the differences were not practically meaningful (86.8% vs. 90.1% ), suggesting the population had adequate ecological knowledge despite any variability (Kypri et al., 2004; Serenari et al., 2014). However, a discrepancy between high scores and perceived lack of knowledge still existed, regardless of response group. The discrepancy between knowledge and perceived knowledge may be explained by teachers believing they need content knowledge on specific topics they would like to introduce (e.g., climate change, biodiversity conservation, urbanization). Training in environmental science and background knowledge specific to a diversity of environmental issues may build confidence in teaching environmental literacy concepts (Moseley, Reinke, & Bookout, 2010). Additionally, professional development in how to teach environmental topics or practice teaching them can support self-efficacy (Author, 2009). This research may help explain why teacher training in published EE curricula such as Project Learning Tree, Project WET, or Project WILD is associated with higher student environmental literacy levels (Author, 2013) even though these trainings focus on sharing strategies and practicing teaching environmental literacy rather than delivering environmental content knowledge. This type of training may be especially useful for elementary school teachers who have the ability to address standards from multiple disciplines in the process of building environmental literacy among their students.
Although we were able to uncover several insights related to the contexts in which elementary school teachers are successful in including environmental literacy and define ways to support them more effectively, future research should address limitations of this study. In regards to the knowledge scale, we purposely choose to measure ecological knowledge at a middle school level to address concerns that elementary school teachers are underprepared to teach environmental literacy content (Coyle, 2005; Kaplowitz & Levine, 2007). However, future research should determine how self-efficacy and the likelihood of teaching environmental literacy concepts changes among teachers with very high levels of ecological knowledge. Similarly, future studies should investigate the relative importance of additional environmental issue content knowledge, training in environmental literacy pedagogy and lesson plans, and practice teaching environmental literacy in building self-efficacy for including environmental literacy in elementary school classrooms.
Electronic Journal of Science Education ejse.southwestern.edu 1988; Johnson, 2006; Rickinson et al., 2004; Spiropoulou & Antonakaki, 2014) and until policies shift toward standards and testing structures that lend greater support for interdisciplinary inclusion of environmental literacy, negotiation of barriers may be critical for ensuring young learners become environmentally literate. Barriers related to state standards and testing have changed little since the introduction of NCLB (Author, 2005; West, 2007), but encouragingly, motivated teachers seem to be finding ways to include environmental literacy concepts despite these barriers. Despite some research to the contrary (Appleton & Kindt, 1999; Zembal-Saul, Krajcik, & Blumenfeld, 2002), teachers in this study do seem to possess the content knowledge necessary to build environmental literacy at the elementary level, although self-efficacy in teaching environmental literacy may still prove to be a barrier to including environmental literacy. Further, they identify several strategies for offering more support to the inclusion of environmental literacy, which may prove effective in working around barriers they face. Efforts should focus on providing training and resources that may help teachers eliminate barriers that can be immediately addressed (e.g., low self-efficacy and perceived lack of curriculum) and overcome those that are more static (e.g., standards and testing). Specifically, we should expand opportunities for training in published EE curriculum (e.g. Project WILD, Project Learning Tree) and strive to highlight how environmental literacy can serve as an excellent context for teaching literacy. The former may address the needs of teachers by providing lesson plans, training and practice in teaching environmental literacy concepts, and readily available expert-reviewed background information, and the latter may support teachers in overcoming persistent institutional challenges to the inclusion of environmental literacy.
Acknowledgements
We would like to thank M. Ward for assistance in sampling as well as all the undergraduate students and elementary school teachers who participated in this study.
References
107th Congress. No Child Left Behind (NCLB) Act. , Pub. L. No. Stat. 1425 (2002).
Anderson, R. D. (2002). Reforming science teaching: What research says about inquiry. Journal of Science Teacher Education, 13(1), 1–12.
Appleton, K., & Kindt, I. (1999). How do beginning elementary teachers cope with science: Development of pedagogical content knowledge in science. Research in Science Teaching. Appleton, K., & Kindt, I. (2002). Beginning Elementary Teachers’ Development as Teachers of
Science. Journal of Science Teacher Education, 13(1), 43–61.
Archer, L., DeWitt, J., Osborne, J., Dillon, J., Willis, B., & Wong, B. (2010). “Doing” science versus “being” a scientist: Examining 10/11-year-old schoolchildren’s constructions of science through the lens of identity. Science Education, 94(4), 617–639. doi:10.1002/sce.20399
Benjamini, Y., & Hochberg, Y. (1995). Controlling the false discovery rate: A practical and powerful approach to multiple testing. Journal of the Royal Statistical Society., 57(1), 289– 300.
Electronic Journal of Science Education ejse.southwestern.edu Coyle, K. (2005). Environmental Literacy in America. Washington, DC.
Dawson, C. (2000). Upper primary boys’ and girls' interests in science: have they changed since 1980? International Journal of Science Education, 22(6), 557–570. doi:10.1080/095006900289660
Desimone, L. M., & Le Floch, K. C. (2004). Are We Asking the Right Questions? Using Cognitive Interviews to Improve Surveys in Education Research. Educational Evaluation and Policy Analysis, 26(1), 1–22. doi:10.3102/01623737026001001
Dorph, R., Shields, P., Tiffany-Morales, J., Hartry, A., & McCaffrey, T. (2011). High hopes – few opportunities: The status of elementary science education in California. Sacramento, CA. Retrieved from http://www.cftl.org/documents/2011/StrengtheningScience_full.pdf Ekborg, M. (2003). How student teachers use scientific conceptions to discuss a complex
environmental issue. Journal of Biological Education, 37(3), 126–132.
Ernst, J. (2007). Factors Associated With K-12 Teachers’ Use of Environment-Based Education. The Journal of Environmental Education, 38(3), 15–32. doi:10.3200/JOEE.38.3.15-32 Ernst, J. (2009). Influences on US middle school teachers’ use of environment‐based education.
Environmental Education Research, 15(1), 71–92. doi:10.1080/13504620802710599
Evans, E. M., Schweingruber, H., & Stevenson, H. W. (2002). Gender Differences in Interest and Knowledge Acquisition: The United States, Taiwan, and Japan. Sex Roles, 47(3/4), 153–167.
Evans, N., Whitehouse, H., & Gooch, M. (2012). Barriers, Successes and Enabling Practices of Education for Sustainability in Far North Queensland Schools: A Case Study. The Journal of Environmental Education, 43(2), 121–138. doi:10.1080/00958964.2011.621995
Forbes, C. T., & Davis, E. A. (2010). Curriculum design for inquiry: Preservice elementary teachers’ mobilization and adaptation of science curriculum materials. Journal of Research in Science Teaching, 47(7), 820–839. doi:10.1002/tea.20379
Forbes, C. T., & Zint, M. (2010). Elementary teachers’ beliefs about, percieved copetencies for, and reported use of scientific inquiry to promote student learning about and for the environment. The Journal of Environmental Education, 42(1), 30–42. doi:10.1080/00958961003674673
Gelman, R., & Brenneman, K. (2004). Science learning pathways for young children. Early Childhood Research Quarterly, 19(1), 150–158. doi:10.1016/j.ecresq.2004.01.009
Glynn, S. M., & Muth, K. D. (1994). Reading and writing to learn science: Achieving scientific literacy. Journal of Research in Science Teaching, 31(9), 1057–1073. doi:10.1002/tea.3660310915
Gorey, K. M. (2001). Early Childhood Education: A Meta-Analytic Affirmation of the Short- and Long-Term Benefits of Educational Opportunity. School Psychology Quarterly, 16(1), 9–30.
Ham, S. H., & Sewing, D. R. (1988). Barriers to environmental education. Journal of Environmental Education, 19(2), 17–24.
Hollweg, K. S., Taylor, J., Bybee, R. W., Marcinkowski, T. J., McBeth, W. C., & Zoido, P. (2011). Developing a Framework for Assessing Environmental Literacy. Environmental Education. Washington, DC: NAAEE. Retrieved from http://www.naaee.net
Electronic Journal of Science Education ejse.southwestern.edu Johnson, C. C. (2006). Effective professional development and change in practice: Barriers science teachers encounter and implications for reform. School Science and Mathematics, 106(3), 150–161.
Jones, G. M., Jones, B. D., & Hargrove, T. (2003). The unintended consequences of high stakes testing. Rowman & Littlefield Publishers, Inc.
Kaplowitz, M. D., & Levine, R. (2007). How environmental knowledge measures up at a Big Ten university. Environmental Education Research, 11(2), 143–160.
Kirikkaya, E. B. (2011). Grade 4 to 8 primary school students’ attitudes towards science: Science enthusiasm. Educational Research and Reviews, 6(4), 374–382.
Ko, A. C., & Lee, J. C. (2003). Teachers’ perceptions of teaching environmental issues within the science curriculum: A Hong Kong perspective. Journal Science Education and Technology, 12(3), 187–204.
Kypri, K., Stephenson, S., & J, L. (2004). Assessment of nonresponse bias in an internet survey of alcohol use. Alcoholism: Clinical & Experimental Research, 28(4), 630–634.
Marx, R. W., & Harris, C. J. (2006). No Child Left Behind and science education: Opportunities, challenges, and risks. The Elementary School Journal, 106(5), 467–478.
McBeth, B., Hungerford, H., Marcinkowski, T., Volk, T., & Cifranick, K. (2011). National environmental literacy assessment, phase two: Measuring the effectiveness of North American environmental education programs with respect to the parameters of
environmental literacy. Final Report. Retrieved from
http://www.naaee.net/sites/default/files/programs/research/NELA_Phase_II_Report.pdf McBeth, B., Hungerford, H., Marcinkowski, T., Volk, T., & Meyers, R. (2008). National
Environmental Literacy Assessment Project: Year 1, national baseline study of middle
grades students. Final report. Retrieved from
http://www.epa.gov/education/pdf/MASTERNELA_Year1Report_081208_.pdf
Moseley, C., Reinke, K., & Bookout, V. (2010). The effect of teaching outdoor environmental education on preservice teachers’ attitudes toward self-efficacy and outcome expectancy. The Journal of Environmental Education, 34(1), 9–15. doi:10.1080/00958960209603476 Moses, M. S., & Nanna, M. J. (2007). The Testing Culture and the Persistence of High Stakes
Testing Reforms. Education and Culture, 23(1), 55–72. doi:10.1353/eac.2007.0010
National Governors Association (NGA). (2010). Common Core State Standards. Washington, DC: National Govenors Association Center for Best Practices, Cuncil of Chief State School Officers.
National Research Council. (2007). Taking science to school: Learning and teaching science in grades K-8. Washington, DC.
NGSS. (2013). Progressions Within the Next Generation Science Standards (Public Release II, Draft Form). Retrieved from http://www.nextgenscience.org/sites/ngss/files/Appendix E - Progressions within NGSS - FINAL.pdf
Project Learning Tree. (2014). Retrieved June 02, 2014, from https://www.plt.org/environmental-education-curriculum
Project WET Foundation. (2014). Retrieved June 02, 2014, from http://www.projectwet.org/what-we-do/publications/guides
Project WILD. (2014). Retrieved June 02, 2014, from
http://www.projectwild.org/LearningFramework.htm
Electronic Journal of Science Education ejse.southwestern.edu Serenari, C., Peterson, M., Moorman, C., Cubbage, F., & Jervis, S. (2014). Application of Choice Experiments to Determine Stakeholder Preferences for Woody Biomass Harvesting Guidelines. Journal of Sustainable Forestry, In Press, 1–26.
Spiropoulou, D., & Antonakaki, T. (2007). Primary Teachers ’ Literacy and Attitudes on Education for Sustainable Development. Journal of Science Education and Technology, 16(5), 443–450. doi:10.1007/sl0956-007-9061-7
Stevenson, R. (2007). Editorial. Environmental Education Research, 13(2), 129–138.
Tal, R. (Tali), & Argaman, S. (2005). Characteristics and Difficulties of Teachers Who Mentor Environmental Inquiry Projects. Research in Science Education, 35(4), 363–394. doi:10.1007/s11165-004-8163-y
Tilgner, P. J. (1990). Avoiding science in elementary school. Science Education, 74, 421–431. Wells, R., & Zeece, P. D. (2007). My Place in My World: Literature for Place-Based
Environmental Education. Early Childhood Education Journal, 35(3), 285–291. doi:10.1007/s10643-007-0181-8
West, M. (2007). Testing, learning, and teaching: The effects of test-based accountability on student achievement and instructional time in core academic subjects. In C. E. Finn & D. Ravitch (Eds.), Beyond the Basics: Achieving a liberal education for all children. Washington, DC: Thomas B. Fordham Institute.
Woodhouse, J. L., & Knapp, C. E. (2000). Place-based curriculum and instruction: Outdoor and environmental education approaches. Eric Digest, 1–8.
Wright, W. E. (2002). The effects of high stakes testing in an inner-city elementary school: The curriculum, the teachers, and the English language learners. Current Issues in Education, 5(5), 126–140.
© 2014 Electronic Journal of Science Education (Southwestern University/Texas Christian University) Retrieved from http://ejse.southwestern.edu
Appendix A
Environmental knowledge scale. Standard deviations are based off the proportion of respondents with the correct answer (N = 536)
Question
% of respondents with correct
answer Std. Dev. A flower with colorful petals and a sweet smell would most likely
be pollinated by:
a) Rain, b)Wind, c) A gardener, d) Insects.
94.4% 0.23
A small bird eats a butterfly that has been eating some nectar from a flower. Then, the bird is eaten by a hawk. This is an example of:
a) Mutualism, b) A food chain, c) Competition, d) Survival of the fittest
99.4% 0.07
Which of the following is a predator-prey relationship?
a) A flea bites a dog, b) A robin eats a worm, c) A fish eats aquatic plants, d) a deer eats grass that has a grasshopper in it.
94.2% 0.23
A fox dies. This creates a problem for:
a) The fleas that were drinking the fox’s blood, b) A rabbit that has a nest nearby, c) Another fox whose territory is nearby, d) An animal that hunts in the same area that the fox did.
78.4% 0.41
Termites eat only wood; however they cannot digest it. Tiny organisms that live in termites’ stomachs and intestines digest the wood. The relationship the tiny organisms and the termites have it:
a) Helpful to one and has no effect on the other, b) Helpful to one and harmful to the other, c) Helpful to both of them, d) Helpful to neither of them.
90.1% 0.30
A seagull and a raccoon are after the same dead fish lying on the shore. What is the relationship between the seagull and the raccoon>
a) One is using the other but not harming, b) They are competing with each other, c) They are helping each other, d) One is trying to eat the other one.
Electronic Journal of Science Education ejse.southwestern.edu Table A1 Cont.
Question
% of
respondents with correct answer
Std. Dev. If there were no decomposers on Earth, what would happen?
a) Dead plants and animals wouldn’t become part of the soil, b) Many human diseases would disappear, c) More meat would be available for humans to eat, d) Little would change.
94.8% 0.22
A mangrove forest is destroyed by humans. What will most likely happen to the animals that lived in the mangroves?
a) Most will leave or die, b) They would have more babies to survive, c) Those that lived in the mangrove forest would adapt, d) Many will pass on traits that would help their young survive in the new environments.
92.0% 0.27
Some people started a program in a national forest to protect deer. They started killing wolves. Ten years later, there were no wolves in the forest. For a few years after the wolves were gone there were more deer than there had ever been. Then suddenly there were almost no deer. The people who wanted to protect the deer didn’t know that:
a) Deer only live to be a few years old, b) Fires would kill so many deer, c) Other animals would eat so much of the deer’s food, d) The deer would eat all the food and that many would starve.
80.4% 0.40
The original source of energy for almost all living things is a) the sun, b) water, c) the soil, d) plants.
91.6% 0.28
A dead bird is decomposing. What happens to the energy that was stored in the bird’s body?
a) Nothing happens to it. Once the bird is dead the energy is lost, b) It passes through the organisms that decomposed the bird, c) It is destroyed by solar radiation, d) The bird used up its energy when it was alive.
Electronic Journal of Science Education ejse.southwestern.edu Table A1 Cont.
Question
% of
respondents with correct answer
Std. Dev. A rabbit eats some corn. The energy from the corn goes into the
rabbit. The next day a fox eats the rabbit. The fox gets very little of the energy that was in the corn. Why?
a) A fox can’t digest corn, b) The rabbit had already digested the corn, c) Corn doesn’t have much energy, d) Most of the corn’s energy was used by the rabbit.
76.5% 0.42
Most of the oxygen in the atmosphere comes from: a) Insects, b) Plants, c) the soil, d) The sun.
97.9% 0.14
Which of the following would give humans the most food energy from 10,000 pounds of plants?
a) Feed the plants to insects, feed the insects to fish, and then humans eat the fish, b) Humans eat the plants, c) Feed the plants to cattle then humans eat the cattle, d) Feed the plants to fish then humans eat the fish.
68.1% 0.47
After living things die, they decompose. A result of this process nutrients are:
a) Released back into the environment to be recycled, b) Destroyed by the bacteria of decay, c) Changed from nutrients to oxygen and water vapor, d) Evaporated due to the heat produced during decomposition.
90.9% 0.29
Which of the following is a part of the water cycle?
a) Erosion, b) Ocean tides, c) Evaporation, d) Decomposition.
97.9% 0.14
A pollutant gets into an ecosystem and kills a large numbers of insects. How might this affect the ecosystem?
a) Plants are not damaged so it doesn’t affect the ecosystem, b) It damages part of the ecosystem so it may affect the whole ecosystem, c) It kills only insects so the other animals in the ecosystem stay healthy, d) Most animals eat plants so it doesn’t affect the ecosystem much.