RESEARCH ARTICLE
STUDY OF RADON CONCENTRATION AND THE ASSOCIATED HEALTH EFFECTS IN SELECTED
HOSPITALS IN THE SOUTHERN PART OF WEST BANK – PALESTINE
*Khalil Mohammad Thabayneh, Lilia Abdullah Mashal and Adnan Mohammad Arar
Faculty of Science and Technology, Hebron University, P.O. Box 40, Hebron, Palestine
ARTICLE INFO
ABSTRACT
Indoor radon concentrations (CRn), potential alpha energy concentrations (PAEC), exposure to radon progeny (EP), annual absorbed dose (DRn), annual equivalent dose to the lung (HE) and lung cancer cases per million person (LCC) were estimated in nine hospitals of the southern part of West Bank-Palestine, by using time-integrated passive radon detectors. Solid State Nuclear Track Detectors (SSNTD) technique were used for the measurements and carried out in the hospitals for an average exposure time of 75 day. The obtained mean values of CRn in those hospitals are ranges from 78 to 187
Bqm-3, with highest mean value is recorded in Al- Etimad hospital, and the lowest is in Shaheera hospital. In addition, the estimated mean of DRn to both workers and patients ranges from 0.98 mSv y–1
to 2.34 mSv y–1. The LCC risk for different rooms in the area under investigation varies from 8 per million person to 68 per million person. The results show that the mean CRn and the resulting doses not exceed the reference level recommended by ICRP (2010) in all hospitals. Therefore, health risk due to radon is a few possibilities. The results conclude that the ventilation condition is the major but not the only factor affects the results. Poor ventilated buildings showed the maximum annual effective dose on the other hand the number of floor has insignificant difference.
Copyright © 2016Khalil Mohammad Thabayneh.This is an open access article distributed under the Creative Commons Attribution License, which permits unrestricted use, distribution, and reproduction in any medium, provided the original work is properly cited.
INTRODUCTION
The study of health effects of exposure to low-level alpha radiation emitted particles from radon (222Rn) in dwellings and general environment has been received a continuing attention as the radon has been found to be a ubiquitous indoor radioactive air pollutant to which all people are exposed (Proctor, 1995). Exposure due to natural radiation is of great importance due to its largest contribution (nearly 55%) to the total collective radiation dose to the world population (UNSCEAR, 2000). The major contribution of doses of
normal background regions arises from the inhalation of 222Rn
and their short - lived progeny (Anil et al., 2014). When radon gas is inhaled, densely ionizing alpha particles emitted by depositing short-lived decay products of radon (218Poand 214Po) can interact with biological tissue in the lungs leading to DNA damage (WHO, 2009). A relationship between lung cancer and inhalation of radon and its decay products has been demonstrated. Hence, monitoring of radon in different rooms is important from the point of view of radiation hygienic (Sharma et al., 2014). An individual’s risk of lung cancer infection from radon depends mainly on three factors; the level of radon concentration, duration of exposure and individual’s smoking habits. Risk increases as an individual is exposed to higher levels of radon over a longer period of time.
*Corresponding author: Khalil Mohammad Thabayneh
Faculty of Science and Technology, Hebron University, P.O. Box 40, Hebron, Palestine
Smoking combined with radon is an especially serious health risk. The risk of death from lung cancer due to radon is much larger for smokers than nonsmokers. If the radiation protection community wants to reduce radon-related mortality, then it needs to focus on ordinary people exposed at moderate concentrations, especially smokers, rather than just on people exposed at high concentrations who have the time and inclination to measure the radon concentration in their homes. Most people killed by radon-induced lung cancer would never have developed the disease if they hadn’t also smoked. Absolute risk for life-long smokers about 25 times greater than for life-long non- smokers (John Hunt, 2014). Children have been reported to have greater risk than adults for certain types of cancer from radiation because of their lung shape and rate of breathing (EPA, 1993; Megbar and Bhardwaj, 2014). The workers in hospitals may inhale air polluted with radon and its short-lived progeny, which can enter the lungs during inhalation and then undergo them to radioactive decay thereby. This in turns may cause physical damage which leading to chemical damage and ultimately biological damage. The continuous damage which produced by alpha particles emitted from radon in the lungs may cause cancer. The knowledge of radon levels in building is extremely important in assessing population exposure. Radon in indoor spaces may originate from exhalation from rocks and soils around the building or from construction materials used in walls, floors, and ceilings (Thabayneh et al., 2012; Thabayneh et al., 2015).
ISSN: 0976-3376
Vol.07, Issue, 02, pp.2502-2508, February,Asian Journal of Science and Technology 2016Available Online at http://www.journalajst.com
ASIAN JOURNAL OF
SCIENCE AND TECHNOLOGY
Article History: Received xxxxxx, 2015 Received in revised form xxxxxxxxxxxxx, 2015
Accepted xxxxxxxxxxxxxxx, 2015 Published online xxxxxxxxxxx, 2016 Article History:
Received 30th November, 2015
Received in revised form
07th December, 2015
Accepted 01st January, 2016
Published online 29th February, 2016
Key words:
Once settle inside the building; the radon cannot easily be rid of it. The sealing of buildings to conserve energy reduces the intake of outside air and worsens the hazard of radon. Good ventilation, reduce radon concentrations inside the buildings. Radon levels are generally high in cellars and basements, this is because these areas are closed to the natural sources of radon (soil of the ground), and are usually poorly ventilated. Radon can seep out from the ground and accumulates in confined spaces, such as basements, caves, mines, etc. High concentrations of radon can also be found in buildings because they are usually at a slightly lower pressure than the surrounding atmosphere and so tend to suck in radon (from the soil) through cracks or gaps in the floor (Mansour et al., 2014; Hamori et al., 2004). In the USA, radon is reported to be responsible for 15, 000 –20,000 lung cancer deaths per year (Bochicchio,2005). The risk is reported to be proportional to the radon level down to EPA’s action level of 4 pCiℓ−1 and probably below this level (Somlai et al., 2009; Zakariya et al., 2013). In this study, together with measuring the indoor radon concentration; other highly-related parameters are considered to estimate the risk of inhalation of radon gas by the workers inside the hospitals, these parameters are: potential alpha energy concentration, equilibrium factor between radon and its daughter, annual effective dose and effective dose equivalent.
MATERIALS AND METHODS
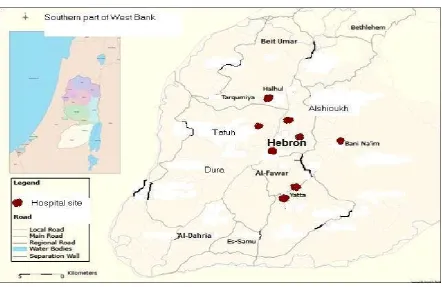
This study addresses the indoor radon concentrations and risk of cancer in nine selected hospitals in four main regions (Hebron, Halhul, Yatta and Bani Naim) in the southern part of West bank – Palestine, which is illustrated in Figure 1. The hospitals are: Alya Governmental Hospital, Al Ahli Private Hospital, Al Mizan private Hospital, Naser Hospital, Red Crescent Hospital, Abu AL Hassan Alqasem Hospital, Bani Naim Hospital for childbirth and surgery, Al- Etimad Hospital and Shaheera Hospital for childbirth.
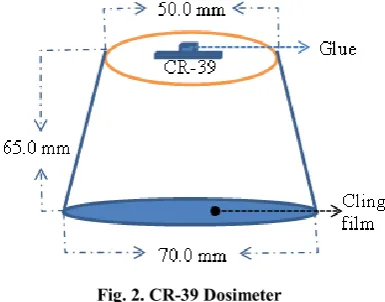
Radon concentrations are measured by using Solid State Nuclear Track Detector (SSNTD) (CR-39 detectors), which supplied by Pershore Mouldings, Ltd., UK. The typical dosimeter consists of a plastic cup in the form of frustum cone having dimensions of 7.0 cm diameter orifice, 5.0 cm diameter base and 6.5 cm depth. The detector (1.0 × 1.0 cm in size) is fixed by blue-tag to the bottom of the dosimeter. The top of the cup was covered with a permeable cling film, which is commercially available over the shelf (polyethylene foil of ~1 mm in thickness), to allow only radon gas to pass through the film and to exclude other radon progeny, particulates and alpha emitters particles from entering the dosimeter (Figure 2). The dosimeters were suspended at a height of about 1.8 m from the ground during autumn season (October to December 2014) in hospitals’ rooms; each of them consists of several floors. The detector exposure registers -tracks attributable to
airborne radon gas and its -emitting progeny. When
α-particle penetrates the detector, the α-particle causes damage along its path, the damage is then made visible by chemical etching. The etching produces a hole in the detector along the path of the particle. The hole can be easily observed in a light transmission microscope with moderate magnification. The detector film detects α-particles from both 222Rn and its daughters during the time of exposure in the indoor environment of a dwelling (Khan et al., 1990). After 75 exposure day, the CR-39 detectors were collected and chemically etched in a 6.25 NaOH solution using a water bath at 70 °C for 6hours. The etched films were washed with distilled water and after that got dried (Jazzar and Thabayneh, 2014). Alpha-particle track measurements per cm2 produced
by the decay of 222Rn and its daughters were conducted using
an optical microscope of 160 x magnification power. The track
density was converted into radon concentration in Bqm-3 using
the calibration factor. The CR-39 radon detector was calibrated in a standard source facility at the National Radiological Protection Board (NRPB), UK (Miles and Strong, 1989).
RESULTS AND DISCUSSION
Radon concentration
The indoor radon concentrations in units of Bqm-3, were measured by applying the following calibration formula (Jazzar and Thabayneh, 2014):
1
t
k
)
(
0 0
0
t
t
C
C
RnWhere Co is the radon concentration of the calibration chamber
(90 kBqm-3), to which the calibration exposure time (48 hr), ρ is the measured track number density per cm2 on the CR-39 detector inside the dosimeter which is used in this study, ρo is
the measured track number density per cm2 on those of the calibrated dosimeters which is equal 3.31104 track.cm-2and t is the exposure time (1800 hr). The following indoor radon concentration data is obtained from 219 dosimeters which are successfully collected out of 270 dosimeters after 75 days. Statistical methods are implemented to analyze the collected data.
Fig. 2. CR-39 Dosimeter
Table 1. Distribution of measured radon concentration levels in each hospital
Hospital Radon concentration (Bqm-3)
No. of detectors Min. Max. Mean SD
Al-Mizan 29 35 295 150 66
Red Crescent 39 33 287 144 68
Al-Ahli 59 49 298 178 67
Alya 27 40 268 137 68
Abu AL Hassan Alqasem 21 67 297 159 65
Shaheera 9 33 121 78 30
Naser 18 67 252 151 53
Bani Naim 8 45 230 119 75
Al-Etimad 9 103 294 187 58
The main parameters are the minimum, maximum; mean and standard deviation of radon concentrations in all hospitals are listed as shown in Table 1 and Figure 3. The present survey shows that the mean indoor radon concentration obtained varies from 78 Bqm-3 in Shaheera hospital to 187 Bqm-3in Al- Etimad hospital. The mean results for all hospitals have been
found lower than the reference level (300 Bqm-3) as
recommended by ICRP (ICRP, 2010).56% of the collected records are higher than the action level of 148 Bqm−3 as recommended by EPA(EPA, 1993). As a result, the mean value for all hospitals is higher than the world average radon
concentration of 40 Bqm-3as recommended by UNSCEAR
(UNSCEAR, 2000). The indoor radon concentrations in the studied hospitals are categorized according to the floor number versus hospitals as shown in Table 2. According to this, the obtained mean values are vary from 92 to 202 Bqm-3 with
overall mean of 158 Bqm-3 in underground floor (F-1), from 33
to 187 Bqm-3 with overall mean of 146.4 Bqm-3 in ground floor (GF), from 84 to 277 Bqm-3 with overall mean of 143 Bqm-3 in first floor (F1), from 120 to 192 Bqm-3 with overall mean of 154.8 Bqm-3 in second floor (F2), from 151 to 163 Bqm-3 with overall mean of 157 Bqm-3 in third floor (F3), and from 116 to 164 Bqm-3 with overall mean of 140 Bqm-3 in fourth floor (F4). The GF and F1 are generally characterized by a high mean radon concentration level compared with the other floors; this can be interpreted due several reasons, such as: Firstly, the upper floors have better ventilation than the lower ones. Secondly, the chance for radon to reach upper floors is very small as compared to that in lower ones. Thirdly, the radon exhalations rates from the ground are decreasing fast as going to higher floors. However, there is a large variation in the radon concentrations within the same floor, especially in underground, ground and the first floor.
Fig. 3. Distribution of mean indoor radon concentrations in each hospital
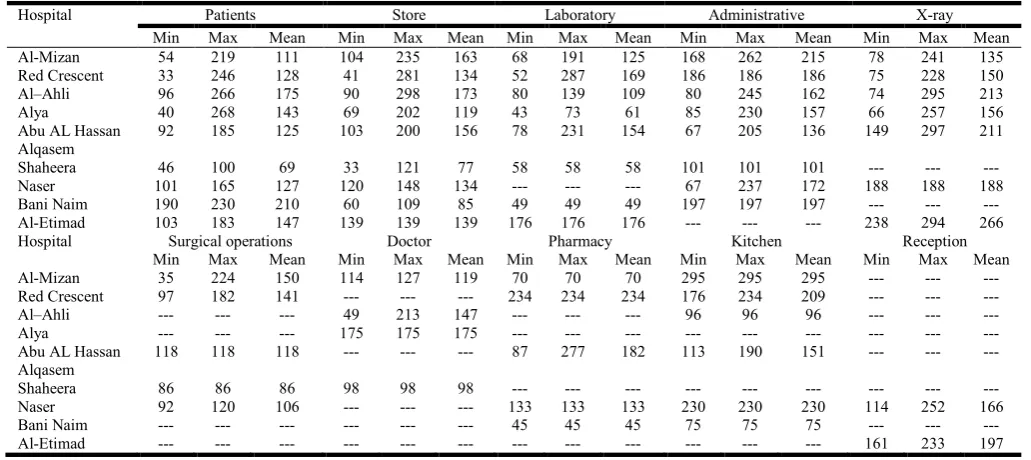
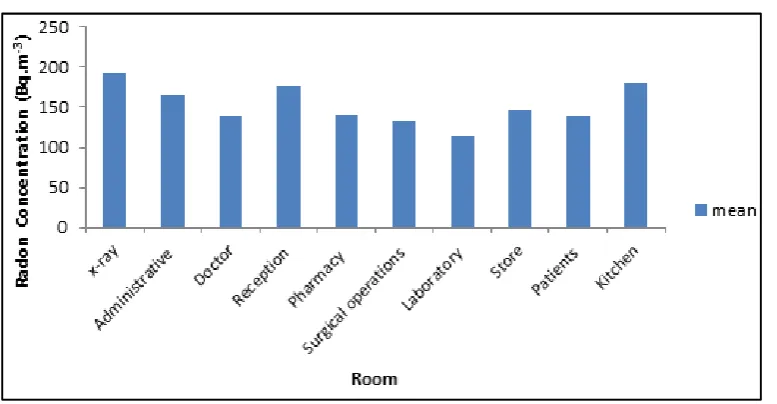
The range of results and mean values of the indoor radon concentration levels in different compartments (x-ray, Administrative, Doctor, Reception, Pharmacy, Surgical operations, Laboratory, Stores, Patients, and Kitchens) are presented in Table 3. The results indicate that the mean values of indoor radon concentration levels in x-ray rooms, stores and kitchens are significantly higher than that measured in the other rooms. The lowest mean values are found in surgical operations, patients and laboratory rooms. Nevertheless, the
highest indoor radon concentration (299 Bqm-3) is recorded in
a kitchen room in Al-Mizan hospital and (298 Bqm-3) is measured in a non-ventilated store in Al-Ahli hospital, while
(294, 295 and 297 Bqm-3) are recorded in X-ray rooms in
Table 2. Distribution of radon concentration levels according to floor number in each hospital
Floor Hospital
Radon concentration levels (Bqm-3)
F -1 GR F 1 F2 F3 F4
Min max mean min max mean min max mean min max mean min max mean min max mean
Al-Mizan 68 295 150 70 262 162 54 170 129 35 224 146 --- --- --- 98 235 164
Red Crescent 63 281 160 52 287 141 111 246 153 33 211 120 91 228 151 41 182 116
Al–Ahli 49 279 164 80 295 179 277 277 277 133 298 192 147 179 163 --- --- ---
Alya 202 202 202 43 257 123 71 230 130 40 268 161 --- --- --- --- --- ---
Abu AL Hassan Alqasem
78 297 172 95 277 167 67 205 124
Shaheera --- --- --- 33 33 33 46 121 84
Naser --- --- --- 67 252 160 92 120 104
Bani Naim 45 230 92 109 197 166 --- --- ---
Al-Etimad --- --- --- 103 294 187 --- --- ---
Table 3. Indoor radon concentration levels for different rooms in each hospital
Hospital Patients Store Laboratory Administrative X-ray
Min Max Mean Min Max Mean Min Max Mean Min Max Mean Min Max Mean
Al-Mizan 54 219 111 104 235 163 68 191 125 168 262 215 78 241 135
Red Crescent 33 246 128 41 281 134 52 287 169 186 186 186 75 228 150
Al–Ahli 96 266 175 90 298 173 80 139 109 80 245 162 74 295 213
Alya 40 268 143 69 202 119 43 73 61 85 230 157 66 257 156
Abu AL Hassan Alqasem
92 185 125 103 200 156 78 231 154 67 205 136 149 297 211
Shaheera 46 100 69 33 121 77 58 58 58 101 101 101 --- --- ---
Naser 101 165 127 120 148 134 --- --- --- 67 237 172 188 188 188
Bani Naim 190 230 210 60 109 85 49 49 49 197 197 197 --- --- ---
Al-Etimad 103 183 147 139 139 139 176 176 176 --- --- --- 238 294 266
Hospital Surgical operations Doctor Pharmacy Kitchen Reception
Min Max Mean Min Max Mean Min Max Mean Min Max Mean Min Max Mean
Al-Mizan 35 224 150 114 127 119 70 70 70 295 295 295 --- --- ---
Red Crescent 97 182 141 --- --- --- 234 234 234 176 234 209 --- --- ---
Al–Ahli --- --- --- 49 213 147 --- --- --- 96 96 96 --- --- ---
Alya --- --- --- 175 175 175 --- --- --- --- --- --- --- --- ---
Abu AL Hassan Alqasem
118 118 118 --- --- --- 87 277 182 113 190 151 --- --- ---
Shaheera 86 86 86 98 98 98 --- --- --- --- --- --- --- --- ---
Naser 92 120 106 --- --- --- 133 133 133 230 230 230 114 252 166
Bani Naim --- --- --- --- --- --- 45 45 45 75 75 75 --- --- ---
Al-Etimad --- --- --- --- --- --- --- --- --- --- --- --- 161 233 197
Table 4. The mean values of (PEAC), (Ep), (DRn), and (HE) for different rooms in each hospital+
Hospital PEAC (×10
-3)(WL) Ep (WLMY-1) D
Rn(mSvy-1) HE (mSvy-1)
Min Max Mean Min Max Mean Min Max Mean Min Max Mean
Al-Mizan 3.8 31.9 16.2 0.16 1.32 0.67 0.44 3.69 1.88 1.05 8.86 4.50
Red Crescent 3.6 31.0 15.6 0.15 1.28 0.64 0.42 3.59 1.81 0.99 8.62 4.33
Al–Ahli 5.3 32.2 19.2 0.22 1.33 0.79 0.62 3.73 2.22 1.47 8.95 5.35
Alya 4.4 28.9 14.8 0.18 1.20 0.61 0.50 3.35 1.71 1.22 8.04 4.11
Abu AL Hassan Alqasem 7.2 32.1 17.2 0.30 1.33 0.71 0.84 3.72 1.99 2.00 8.92 4.77
Shaheera 3.5 13.1 8.5 0.15 0.54 0.35 0.41 1.52 0.98 0.99 3.64 2.35
Naser 7.2 27.2 16.3 0.30 1.12 0.67 0.84 3.15 1.89 2.00 7.54 4.53
Bani Naim 4.8 24.8 12.9 0.20 1.02 0.53 0.56 2.87 1.50 1.35 6.89 3.59
Al-Etimad 11.1 31.7 20.2 0.46 1.31 0.83 1.29 3.67 2.34 3.10 8.81 5.61
Table 5. The values of lung cancer cases (LCC)for different rooms in each hospital
Hospital LCC(×10
-6)
Min Max Mean
Al-Mizan 8 67 34
Red Crescent 8 65 33
Al-Ahli 11 68 40
Alya 9 61 31
Abu AL Hassan Alqasem 15 67 36
Shaheera 8 27 18
Naser 15 57 34
Bani Naim 10 52 27
Furthermore, central heating in winter which is constantly used, this leads to high indoor radon concentration. Moreover, there are some other sources of radiation in laboratories and radiology imaging centers which may increase the concentration of alpha particles in these rooms, such as usage of some radiated materials especially as in nuclear medicine. A comparison of mean values of indoor radon concentrations in different rooms in the studied hospitals is shown in Figure 4.
The radiological effects
The exposure to radon radiation is normally expressed as working level (WL), which represents the total radiated energy of α-particles. In other words, working level is a measure of the concentration of radon progeny, based on the pooled average indoor radon concentration and can be calculated using the reverse-variance-weighted method for determining the expected exposure to radon in various indoor environments (Bodansky, 1989; Ravikumar and Somashekar, 2014).
In this study, to estimate the effective dose of 222Rn progeny in hospitals, it is necessary to know the potential alpha energy concentration (PAEC) in terms (mWL) units, which can be calculated as follows (Ahmed et al., 2012):
23700 )
(WL CRn FR
PAEC
Where (FR) is the equilibrium factor between radon and its
progeny and it is equal to (0.4) as suggested by UNSCEAR (UNSCEAR, 2000).
The potential alpha energy concentration (PAEC) in the
surveyed hospitals is summarized in Table 4. The data show that the highest value of PAEC levels is recorded in Al–Ahli hospital (32.2 mWL) with mean value of 19.2 mWL, while all
hospitals have mean value of PAEC levels more than 10 mWL
except Shaheera hospital. As a result, the overall values of indoor PAEC are lower than the recommended threshold of (53 mWL) which reported in UNSCEAR (UNSCEAR, 1993). The exposure to radon progeny (EP) is then related to the
average indoor radon concentration CRn by following
expression (Mansour et al., 2014; ICRP,1994):
3 3700170 8760 )
( 1
R Rn
P
C F n WLMY
E
Where n is the fraction of time spent indoors which are equal
to (0.8), 8760 is the number of hours per year and 170 represents the number of hours per working month. As it can be seen from Table 4, the highest mean value of exposure to radon progeny (EP) is found in Al-Etimad hospital which is
equal to (0.83 WLMY-1), while the lowest value is found in Shaheera hospital which is equal to (0.35 WLMY-1). The mean values of (EP) in Al-Mizan, Red Crescent, Al-Ahli, Alya,
Abu AL Hassan Alqasem, Shaheera, Naser, Bani Naim, Bani Naim and Al-Etimad are 0.67, 0.64, 0.79, 0.61, 0.71, 0.35,
0.67, 0.53 and 0.83 WLMY-1, respectively. All mean results of
(EP) in indoors rooms in the studied hospitals are lower than
the lower limit of the recommended range (1-2 WLMY-1)
(Ismail and Jaafar, 2010). According to the UNSCEAR report, the annual absorbed dose DRn in (mSvy-1) to the public due to
222
Rn and its progeny is estimated using the following equation
(UNSCEAR, 2000; Zakariya et al., 2013):
4D T H F )
( R
1
Rn
Rn mSvy C
D
Where H is the occupancy factor (0.4), T is hours in a year (8760 hy–1) and D is the dose conversion factor (9.010–6 mSv Bqm–3h–1), which is the effective dose received by adults per unit 222Rn activity per unit of air volume (UNSCEAR, 2000). From eq. (4) and Table (4); the mean values of the annual absorbed dose in the studied hospitals is ranges from 0.98 mSv y–1 (Shaheera hospital)to 2.34 mSv y–1 (Al-Etimad hospital). The results are as follows: from 0.44 to 3.69 mSv y–1 with
mean value of 1.88 mSv y–1 in Al-Mizan hospital, from 0.42 to
3.59 mSv y–1 with mean value of 1.81 mSv y–1 in Red Crescent hospital, from 0.62 to 3.73 mSv y–1 with mean value of 2.22 mSv y–1 in Al-Ahli hospital, from 0.51 to 3.35 mSv y–1 with mean value of 1.71 mSv y–1 in Alya hospital, from 0.84 to 3.72 mSv y–1 with mean value of 1.99 mSv y–1 in Abu AL Hassan
Alqasem hospital, from 0.41 to 1.52 mSv y–1 with mean value
of 0.98 mSv y–1 in Shaheera hospital, from 0.84 to 3.15 mSv y– 1
with mean value of 1.89 mSv y–1 in Al-Naser hospital, from
0.56 to 2.87 mSv y–1 with mean value of 1.50 mSv y–1 in Bani
Naim hospital and from 1.29 to 3.67 mSv y–1 with mean value
of 2.34 mSv y–1 in Al-Etimad hospital. In its recent reports of
ICRP (John Hunt, 2014; ICRP, 2010); it has been recommended that the reference levels of radon in indoor rooms should be set around 5 mSv y–1. On the basis of this recommendation, it has been observed that most of the hospitals rooms monitored for indoor radon concentration show lower values than the action levels. Therefore, the health risk due to radon is a few possibilities. To calculate the annual equivalent dose (HE), one has to apply a tissue and radiation
weighting factors according to ICRP (ICRP, 1991).When concerned with annual absorbed dose, one has to apply a tissue weighting factor in addition to the radiation weighting factor. According to ICRP (ICRP, 1991); the tissue weighting factor for lung is WT = 0.12; the radiation weighting factor for alpha
particles is WR = 20 (Jing Chen, 2005). The annual equivalent
dose is estimated by using the following equation (Nsiah-Akoto et al., 2011):
5 W)
( R
1
T Rn
E mSvy D W
H
As it shown in Table 4, the highest mean annual equivalent dose recorded in Al-Etimad hospital (5.61 mSvy-1), and the
lowest mean annual equivalent dose is 2.35 mSvy-1 in
Shaheera hospital.
The lung cancer cases
Radon decays quickly, giving off tiny radioactive particles. When inhaled, these radioactive particles can damage the cells that line the lung. Long-term exposure to radon can lead to lung cancer, the only cancer proven to be associated with inhaling radon. The lung cancer cases per year per million person (LCC) is estimated by using the risk factor lung cancer induction 18×10-6 mSv-1, and obtained using the relation (Mansour et al., 2014; Battawy et al., 2013):
6 (mSv) 10 18 )
( 1 6 -1
D mSvy
LCC Rn
As it shown from Table 5, the radon induced lung cancer risks for different rooms in the area under investigation is found to vary from 8 per million person (in Shaheera and Red Crescent hospitals) to 68 per million person (in Al-Ahli hospital). The mean values of (LLC) in Al-Mizan, Red Crescent, Al-Ahli, Alya, Abu AL Hassan Alqasem, Shaheera, Naser, Bani Naim and Al- Etimad hospitals are: 34, 33, 40, 31, 36, 18, 34, 27 and 42 per million persons per year, respectively. These values are less than the lower limit of the range (170-230) per million person recommended by the ICRP (ICRP, 1993).
Conclusion
This work assesses the WLM for workers and patients in nine hospitals in the southern part of West Bank – Palestine. Indoor radon concentrations have been measured inside different hospitals (multi-storey and rooms with a variety of usage) in autumn season. The present survey shows that the mean indoor radon concentration for most hospitals have been found lower
than the reference level (300 Bqm-3) as recommended by ICRP
(2010). 56% of them are higher than the reference level of 148
Bqm−3 as recommended by EPA (1993). To estimate the health
effects of radon and its progeny, many of the radiological effects in the surveyed hospitals were calculated. The annual absorbed dose and the annual equivalent dose have been calculated to carry out the assessment of the variability of expected radon exposure of the population due to radon and its
progeny. The lung cancer cases per year per million persons have been calculated where the values are less than the lower limit of the range (170-230) per million persons recommended by the (ICRP, 1993). The results of the present work provide an additional database on indoor radon level in Palestine.
REFERENCES
Ahmed, A. H., Haji, S. O., Azeez, H. H. 2012. Radon dosimetry in Erbil city hospitals, J of Physical Scie and Applic., 2, 240 – 44.
Anil, P., Rajinder, S., Sunil, K. 2014. Estimation of annual effective dose due to low-Level radiation exposure in
dwellings of some districts of Haryana, Nature and
Science, 12, 91 – 94.
Battawy, A. A., Jaafar, M. S., Tawfiq, N. F., Mustafa I. Sh., Ali, A. H., Hussein Z. A.2013. Indoor radon concentration measurement in selected factories in northern and central Iraq, J of Enviro and Earth Scie.3, 105 – 112.
Bochicchio, F. 2005. Radon epidemiology and nuclear track
detectors: methods, Results and perspectives, Radiat
Meas., 40, 177 – 90.
Bodansky, D. 1989. Indoor radon and its hazards In: Overview of indoor radon problem, University of Washington Press, Seattle and London, 9 – 23.
EPA, United States environmental protection agency 1993. "radon measurement in Schools" 402- R-92- 014.
Hamori, K. E., Toth G., Koteles 2004. Radon level of
Hungarian flats 1994-2004..Hungarian Egeszsegtudomany,
48,283 – 99.
ICRP International Commission on Radiological Protection. 1993. Protection against Rn-222 at Home and at Work. ICRP 65.Ann. ICRP 23 2. Pergamon Press; Oxford. ICRP International Commission on Radiological Protection.
1994. Publication againstRadon-222 at home and at work Oxford: Pergamon press, p 1 – 45.
ICRP International Commission on Radiological Protection. 2010. Lung Cancer Risk from Radon and Progeny and Statement on Radon. ICRP Publication 115, Ann. ICRP401.
ICRP, International Commission on Radiological Protection. 1991. Recommendations of the ICRP Publication 60.21 Pergamon Press, Oxford.
Ismail, A., Jaafar, M. 2010. Indoor radon concentration and its health risks in Selected locations in Iraqi Kurdistan using
CR-39 NTDs. 'Bioinformatics and Biomedical
Engineering’’, 4th international Confer. In Cheng Du., 18 – 20.
Jazzar, M. M., Thabayneh, K. M. 2014. Exposure of dwelling populations to alpha Particles and its health impact in Illar region, Tulkarem-Palestine, Int. J. Environ. Eng. Nat. Resour. 1, 171 – 78.
Jing Chen, 2005. A Review of radon doses, Radiat Prot Manag22, 27 – 31.
John Hunt, 2014. Occupational radiation protection in the
workplace involving exposure to radon, International
Conference on Occupational Radiation Protection,1-5 December 2014, Vienna, Austria.
Khan, A. J., Varshney, A. K., Prasad, R., Tyagi, R. K., Ramachandran, T. V. 1990., Calibration of a CR-39 plastic track detector for the measurement of radon and its
daughters in dwellings, Nucl Tracks Radiat Meas.17, 497
Mansour, H. L., Tawfiq, F. T., Mahmood, S. K. 2014. Measurements of radon- 222 Concentrations in dwellings of Baghdad governorate, Indian J of Appl Res.4, 35 – 38. Megbar, W., Bhardwaj, M. K. 2014. Measurements of radon
concentration in indoor air in some dwellings of Debre Markos, Ethiopia, I.J.E.M.S. 5,173 – 76.
Miles, J., Strong J. 1989. Radon calibration facilities at NRPB, Rad Prot. Bull. 6, p 104.
Nsiah-Akoto, I., Fletcher, J., Oppon, O., Andam, A. 2011. Indoor radon levels and the associated effective dose rate determination at Dome in the Greater Accra region of Ghana, Res J of Environ and Earth Scie.3, 124 – 30. Proctor, R. N. 1995. Cancer wars how politics shapes what we
know and don’t know about cancer, New York: Basic Books.
Ravikumar, P., Somashekar, R. 2014. Estimates of the dose of
radon and its Progeny inhaled inside buildings, Europ J of
Environ Scie. 3, 88 – 95.
Sharma, A., Mahur A., Sonkawade Sharma A. C., Prasad, R. 2014. Study of radon, thoron concentration and annual effective dose in some dwellings of Aligarh city Uttar Pradesh and Dwarka Delhi, India, Int. J. Curr. Res. Aca. Rev. 2, 234 – 41.
Somlai, J., Szeiler, G., Szabo, P. 2009. Radiation dose of workers originating from radon in the show cave of
Tapolca, Hungary, Journal of Radio analytical and
Nuclear Chemistry279, 219-225.
Thabayneh, K. M., Abu-Samreh M. M., Mashal L. A. 2015. Indoor radon concentrationLevels inside schools in the north eastern region of Hebron province – Palestine:
Casestudy in summer season, Environmental Science: An
Indian Journal10, 260 – 68.
Thabayneh, K. M., Abu-Samreh, M. M., Elian, M. M 2012. Assessment of indoor radon Levels in dwellings of Beit Fajjar city, Palestine, Hebron Univ Res. J. A., 6, 47 – 60. UNSCEAR, 1993 Genetic and somatic effects of ionizing
radiation. United Nations. UNSCEAR 2000 Sources and Effects of Ionizing Radiation United Nations Scientific Committee on the Effects of Atomic Radiation, United Nations, New York..
WHO, 2009 Handbook on Indoor Radon.A Public Health Perspective. WHO Press, Switzerland.
Zakariya, A. H., Mohamad, S. J., Asaad, H. I. 2013. Measurement of indoor radonconcentration levels and its Risks inside hospitals in Iraqi Kurdistan region: Casestudy
in autumn season. Online Journal of Physical and
Environmental Science Research, 21, 1 – 6.