Available online on 15.10.2018 at http://jddtonline.info
Journal of Drug Delivery and Therapeutics
Open Access to Pharmaceutical and Medical Research© 2011-18, publisher and licensee JDDT, This is an Open Access article which permits unrestricted non-commercial use, provided the original work is properly cited
Open Access
Research Article
Isolation and characterization of bioactive compound anthraquinone
from methanolic extract of
Boerhavia diffusa linn
.
Mrs. U. Kanagavalli
1*, Dr. A. Mohamed Sadiq
21*Assistant Professor, Department of Biochemistry, Adhiparasakthi College of Arts and Science, G.B. Nagar, Kalavai, Vellore
District, Tamilnadu, India
2
Principal, Adhiparasakthi College of Arts and Science, G.B. Nagar, Kalavai, Vellore District, Tamilnadu, India
ABSTRACT
Boerhavia diffusa Linn. (Nyctaginaceae), commonly known as ‘Punarnava’ is a perennial creeping herb widely studied and has a
long history of uses by the tribal people and in Ayurvedic and Unani medicines. Our previous study showed that in different extracts of Boerhavia diffusa (ethanol, methanol, petroleum ether, aqueous and hexane), methanolic extract had significant anti-oxidant activity, but the active components present in that extracts are still unclear. In this study, Boerhavia diffusa Linn was investigated for the bioactive compounds present in its methanolic extract. Separation and purification of the compounds in the most active methanol extract was done using a combination of column chromatography and thin layer chromatography. The compound was identified using gas chromatography and mass spectrophotometry. The resulted compound anthraquinone which is also called as 9, 10 anthracenedione. In addition to their known use as natural dyes, it have several biological activities like antitumor, antiinflammatory, diuretic , antiarthritic, antifungal, antibacterial, antimalarial and antioxidant activities . This justifies the use of this plant in traditional medicine and indicates a promising potential for the development of medicinal agents from Boerhavia diffusa.
Keywords: Antioxidant, Boerhavia diffusa Linn, Anthraquinone, Column chromatography, Thin layer Chromatograhy, GC-MS.
Article Info:Received 17 Sep, 2018; Review Completed 08 Oct 2018; Accepted 09 Oct 2018; Available online 15 Oct 2018
Cite this article as:
Kanagavalli U, Sadiq AM, Isolation and characterization of bioactive compound anthraquinone from methanolic
extract of Boerhavia diffusa linn., Journal of Drug Delivery and Therapeutics. 2018; 8(5-s):232-237
DOI:http://dx.doi.org/10.22270/jddt.v8i5-s.1987
*
Address for Correspondence:Mrs. U. Kanagavalli, Assistant Professor, Department of Biochemistry, Adhiparasakthi College of Arts and Science, G.B. Nagar, Kalavai- 632506. Vellore District, Tamilnadu, India
INTRODUCTION
The use of natural products with therapeutic properties is an ancient as human civilization and for a long time. Recently, herbal medicines have increasingly been used to treat many human diseases. Numerous studies were carried out on plants with antioxidant properties. However, there is still great interest in finding new antioxidants from natural sources1. Plant materials are a rich source of biologically active metabolites. The active secondary metabolites produced by some of these plants have potential bioactive compounds of interest in the pharmaceutical industry. Plant-derived substances have recently become of great interest due to their applications as drugs, as model compounds for drug synthesis or as intermediates for synthetic drugs2.
Boerhaavia diffusa Linn.(F: Nyctaginaceae) a medicinal plant as a whole was commonly known to the world as “Spreading hogweed” and in Sanskrit as “Punarnava”, is widely distributed over the tropical, subtropical and temperate regions of the world. It is traditionally used mostly in treating different ailments like asthma, urinary disorders, leucorrhea, rheumatism, and encephalitis3.
column-chromatographic techniques. Isolation of bioactive compounds using column-chromatographic involves preparation of sample, packing of column, pouring of sample into the column, elution of fractions; and analysis of each fractions using thin layer chromatography. However, depending on nature of research, compounds can be further identified using GCMS (gas chromatography Mass spectrophotometry. This paper focus about the isolation, purification and characterization of bioactive compound anthraquinone, a cardiac glycoside which is used for cardioprotective activity and anticancer activity.
MATERIALS AND METHODS
1. Collection of Plant material:
Healthy, ailment free whole Boerhaavia diffusa L. plant were collected from Samanthipuram village, Arcot, Tamil Nadu. The taxonomical identification was done by Dr. P. JAYARAMAN, Director, Plant anatomy research center, Chennai and voucher specimen was kept for further reference with register number PARC/2014/2078.
2. Preparation of extract:
The plant was shade dried and ground to make fine powder that was then extracted with methanol. The extract solution was evaporated under reduced pressure to obtain solid crude extract.
3. Column-chromatography:
A cylinder shaped glass column containing stationary phase (silica gel) is encountered slowly from the top with a liquid solvent (mobile phase) that flows down the column with the help gravity or external pressure applied. This technique is used for the purification of compounds from a mixture. Once the column is ready, the sample is loaded inside the top of the column. The mobile solvent is then allowed to flow down through the column. The compounds in mixture have different interactions ability with stationary phase (silica gel), and mobile phase, thereby will flow along the mobile phase at different time intervals or degrees. In this way, the separation of compounds from the mixture is achieved. The individual compounds are collected as fractions and analyzed further for structure elucidation.
Isolation and purification of bioactive compounds from plant samples
A suitable size long cylindrical glass column (based on the amount of the sample) should be stand firm on a column-chromatography stand. Completely dried plant extract sample should be mixed with silica gel to make a fine powdered form for easy distribution of sample in already packed silica gel column. Sample powdered mass should be placed on the top of the pre-packed silica column and sample should be covered with a layer of cotton. Then solvents of different polarities were passed through column at uniform rate under gravity to fractionate the sample extract. Each fraction was collected separately in a test tube and numbered consecutively for further analysis on thin layer chromatography.
Thin layer chromatography (TLC) provides partial separation of both organic and inorganic materials using thin-layered chromatographic plates especially useful for checking the purity of fractions. Each fraction is applied on activated TLC plates with the help of capillary tube at a 1/2 inch apart from the lower edge of TLC plate, and plate is kept in a developing chamber containing suitable solvent system for specific time until the developing solvent reaches top of the upper edge of TLC plate. Plate is taken out from developing chamber, dried and solvent front is marked by lead pencil. Compound bands/spots visualized on TLC chromatoplate can be detected by visual detection, under UV light (254 nm), in iodine chamber and by using spray reagent (vanillin-sulfuric acid) for the presence of specific compounds. The visualized spots of the components in the chromatoplate are marked and the Rf value of each spot is calculated by the formula: Rf = distance travelled by the sample (cm)/distance travelled by the solvent (cm). TLC plate showing number of bands (compounds) for each fraction can be further compounds are identified using Gas chromatography Mass spectrophotometry.(GCMS )5.
4. Gas chromatography mass spectrophotometry:
GC-MS analysis of the methanolic extract of B. diffusa
was performed using a Perkin–Elmer GC Clarus 500 system comprising an AOC-20i auto-sampler and a Gas Chromatograph interfaced to a Mass Spectrometer (GC-MS) equipped with a Elite-5MS (5% diphenyl/95% dimethyl poly siloxane) fused a capillary column (30 × 0.25 μm ID × 0.25 μm df). For GC-MS detection, an electron ionization system was operated in electron impact mode with ionization energy of 70 eV. Helium gas (99.999%) was used as a carrier gas at a constant flow rate of 1 ml/min, and an injection volume of 2 μl was employed (a split ratio of 10:1). The injector temperature was maintained at 250 °C, the ion-source temperature was 200 °C, the oven temperature was programmed from 110 °C (isothermal for 2 min), with an increase of 10 °C/min to 200°C, then 5 °C/min to 280°C, ending with a 9 min isothermal at 280 °C. Mass spectra were taken at 70 eV; a scan interval of 0.5 s and fragments from 45 to 450 Da. The solvent delay was 0 to 2 min, and the total GC/MS running time was 36 min. The relative percentage amount of each component was calculated by comparing its average peak area to the total areas. The mass-detector used in this analysis was Turbo-Mass Gold-Perkin-Elmer, and the software adopted to handle mass spectra and chromatograms was a Turbo-Mass ver-5.2.6
RESULT AND DISCUSSION
cytotoxicity, combined with simplicity, specificity, and speed9.
In vitro methods are usually more desirable than in vivo assays because animal experiments are expensive, take more time, and are prone to ethical controversies. There are some factors that make it impossible to find final
procedures or protocols to isolate and characterize certain bioactive molecules. This could be due to different parts (tissues) in a plant, many of which will produce quite different compounds, in addition to the diverse chemical structures and physicochemical properties of the bioactive phytochemicals10.
Figure 1: Isolation of compound through column chromatography
Purification of the Bioactive Molecule.
Many bioactive molecules have been isolated and purified by using paper thin-layer and column chromatographic methods. Column chromatography and thin-layer chromatography (TLC) are still mostly used due to their convenience, economy, and availability in various stationary phases. Silica, alumina, cellulose, and polyamide exhibit the most value for separating the phytochemicals. Plant materials include high amounts of
complex phytochemicals, which make a good separation difficult. Therefore, increasing polarity using multiple mobile phases is useful for highly valued separations. Thin-layer chromatography has always been used to analyze the fractions of compounds by column chromatography. Silica gel column chromatography and thin-layer chromatography (TLC) have been used for separation of bioactive molecules with some analytical tools11.
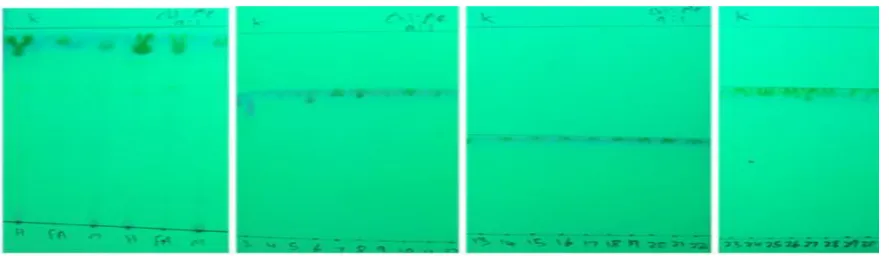
Figure 2: Thin layer chromatogram identified spot at different fractions using chloroform:methanol(9:1) solvent system.
Figure 4: Thin layer chromatogram showing fractions in Long UV.
The visualized spots of the components in the chromatoplate were marked and the Rf value of each spot was calculated by the formula: Rf = distance travelled by the sample (cm)/distance travelled by the solvent (cm).The several fractions gave a many spot at different Rf on silica gel 60 F254 pre-coated aluminum plate, of 0.2 mm thickness using Chloroform: Methanol (9:1) as the developing solvent system. Visualization was carried out by dipping the plate in vanillin- sulphuric acid reagent and heating at 105°C till the color of the spot appeared (Figure:2). Thin layer chromatogram fractions in long and shot UV is shown in figure 3 and 4.
Structural Clarification of the Bioactive Molecules
Determination of the structure of certain molecules uses data from a wide range of spectroscopic techniques such as UV-visible, Infrared ( IR), Nuclear Magnetic Resonance (NMR), a n d mass spectroscopy. The basic principle of spectroscopy is passing electromagnetic radiation through an organic molecule that absorbs some of the radiation, but not all. By measuring the amount of absorption of electromagnetic radiation, a spectrum can be produced. The spectra are specific to certain bonds in a molecule. Depending on these spectra, the structure of the organic molecule can be identified. Scientists mainly use spectra produced from either three or four regions—Ultraviolet (UV), Visible, Infrared (IR), radio frequency, and electron beam for structural clarification12.
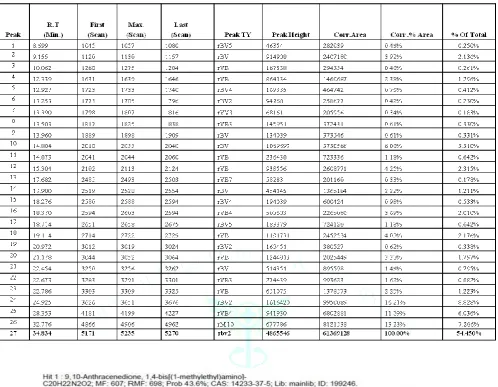
Table 1: GCMS Data of bioactive compounds detected with their percentage area and retention time.
Figure 6: GC-MS data analysis identified compound as anthraquinone.
The results pertaining to GC-MS analysis of the isolated fraction from methanolic extract of Boerhavia diffusa
lead to the identification of a bioactive compound anthraquinone. This compound is identified through mass spectrometry attached with GC at Retention time (34.834). The detected compound present in the entire herb of Boerhavia diffusa by the GC-MS was shown in [Table 1 ].
The GC-MS spectrum confirmed the presence of bioactive components with different retention times as illustrated in [Figure 5, 6]. The mass spectrometer analyzes the compounds eluted at different times to
identify the nature and structure of the compounds. The large compound fragments into small compounds giving rise to appearance of peaks at different m/z ratios. These mass spectra are fingerprint of that compound which can be identified from the data library.
CONCLUSION
Phytochemicals are naturally occurring and biologically active plant compounds that have potential disease inhibiting capabilities. Hence the medicinal values of these plants lie in their phytochemicals, which produce
definite physiological actions on the human body. This is the first report that studied isolation and identification
of anthraquinones from methanolic extract of Boerhavia
Diffusa Linn. Thisidentified important compound which
may be used to develop biopharmaceuticals against infectious diseases with antioxidants source in future.
REFERENCES
1. Sayed A etal.,Anthraquinone glycosides from Cassia roxburghii and evaluation of its free radical scavenging activity., Carbohydrate Research 2012; 360:47–51.
2. Nagy Morsy, Phytochemical analysis of biologically active constituents of medicinal plants Main Group Chemistry 2014; 13:7–21.
3. Sahu.A. Phytopharmacological Review of Boerhaavia diffusa Linn.(Punarnava) Pharmacognosy Reviews, Supplement 2008; 2(4).
4. Gaspar Diaz-Munoz etal., Anthraquinones: An Overview., Studies in Natural Products Chemistry, 313–338.
5. Vivek K. etal., Isolation and purification of plant secondary metabolites using column-chromatographic technique, Bangladesh J Pharmacol. 2016; 11:844-848.
6. Kanthal LK., etal., GC-MS analysis of bio-active compounds in methanolic extract of Lactuca runcinata, Pharmacognosy Research, 2014; 6(1):58-61.
7. Altemimi, A.W etal., Simultaneous extraction, optimization, and analysis of flavonoids and polyphenols from peach and
pumpkin extracts using a TLC-densitometric method. Chem. Cent. J. 2015; 9:1–15.
8. Altemimi, A et al., Employing response surface methodology for the optimization of ultrasound assisted extraction of lutein and β-carotene from spinach. Molecules 2015, 20: 6611– 6625.
9. Mulinacci, N etal., Commercial and laboratory extracts from artichoke leaves: Estimation of caffeoyl esters and flavonoidic compounds content. J. Pharm. Biomed. Anal. 2004; 34:349–357.
10. Sarajlija,H etal., Preparation of flaxseed for lignan determination by gas chromatography-mass spectrometry method. Czech J. Food Sci. 2012; 30:45–52.
11. Zhang, Z etal., Role of peroxidase in anthocyanin degradation in litchi fruit pericarp. Food Chem. 2005; 90:47– 52.
12. Popova, I.E etal., Determination of lignans in flaxseed using
liquid chromatography with time-of-flight mass