R E S E A R C H
Open Access
Epidemiological study and genetic
characterization of inherited muscle
diseases in a northern Spanish region
Inmaculada Pagola-Lorz
1, Esther Vicente
2,3, Berta Ibáñez
4, Laura Torné
1, Itsaso Elizalde-Beiras
5,6,
Virginia Garcia-Solaesa
1,7, Fermín García
7, Josu Delfrade
2,8and Ivonne Jericó
1,9*Abstract
Background:Inherited muscle diseases are a group of rare heterogeneous muscle conditions with great impact on quality of life, for which variable prevalence has previously been reported, probably due to case selection bias. The aim of this study is to estimate the overall and selective prevalence rates of inherited muscle diseases in a northern Spanish region and to describe their demographic and genetic features. Retrospective identification of patients with inherited muscle diseases between 2000 and 2015 from multiple data sources. Demographic and molecular data were registered.
Results:On January 1, 2016, the overall prevalence of inherited muscle diseases was 59.00/ 100,000 inhabitants (CI 95%; 53.35–65.26). Prevalence was significantly greater in men (67.33/100,000) in comparison to women (50.80/100, 000) (p= 0.006). The highest value was seen in the age range between 45 and 54 (91.32/100,000) years. Myotonic dystrophy type 1 was the most common condition (35.90/100,000), followed by facioscapulohumeral muscular dystrophy (5.15/100,000) and limb-girdle muscular dystrophy type 2A (2.5/100,000).
Conclusions:Prevalence of inherited muscle diseases in Navarre is high in comparison with the data reported for other geographical regions. Standard procedures and analyses of multiple data sources are needed for
epidemiological studies of this heterogeneous group of diseases.
Keywords:Inherited muscle diseases, Epidemiology, Prevalence, Neuromuscular
Background
Inherited muscle diseases (IMDs), defined as rare dis-eases due to their low prevalence, make up a complex group of clinically and genetically heterogeneous condi-tions. IMDs can appear at any age and are characterized by a variety of symptoms including progressive muscle weakness, cramps, stiffness, joint deformities, chronic pain, respiratory and/or cardiac involvement, and a broad range of cognitive impairments [1,2]. These path-ologies cause variable degrees of disability in patients and have a major impact on the quality of life and health budgets worldwide [3]. The number of subjects with this
type of condition is expected to increase due to better prevention of complications and genetic diagnosis ad-vances, thus, prevalence data are essential for future budget estimates.
Despite the relevance of identifying these data only few epidemiological studies include all types of IMDs, and their methodology and results vary widely [4–14]. There seems to be regional differences concerning the prevalence of these conditions and potential ethnic dif-ferences are not fully understood.
For comparison purposes, standardized procedures for conducting epidemiological studies in this field have been proposed [15]. In Spain, there is little published in-formation about IMDs. Most studies have been per-formed at regional level, focusing on a certain type of IMD and with wide regional variations [16–19]. The aim of our study is to describe the demographic and genetic
© The Author(s). 2019Open AccessThis article is distributed under the terms of the Creative Commons Attribution 4.0 International License (http://creativecommons.org/licenses/by/4.0/), which permits unrestricted use, distribution, and reproduction in any medium, provided you give appropriate credit to the original author(s) and the source, provide a link to the Creative Commons license, and indicate if changes were made. The Creative Commons Public Domain Dedication waiver (http://creativecommons.org/publicdomain/zero/1.0/) applies to the data made available in this article, unless otherwise stated. * Correspondence:ijericop@cfnavarra.es
1
Department of Neurology, Complejo Hospitalario de Navarra, IdiSNA (Navarre Institute for Health Research), Pamplona, Spain
9Department of Neurology, Complejo Hospitalario de Navarra, 31008
Pamplona, C/ Irunlarrea, Spain
features of this group of neuromuscular diseases in Na-varre for a 16-year period (2000–2015) and to estimate the prevalence according to IMD subtype, age group and geographical distribution.
Patients and methods
Observational retrospective study based on the identifi-cation of adults and children with IMDs using all health databases available within the regional health system (from January 1, 2000 to December 31, 2015). The Na-varre Ethics Research Committee approved this study. The procedures followed are in accordance with the Helsinki Declaration of 1975, as revised in 2000.
Study population
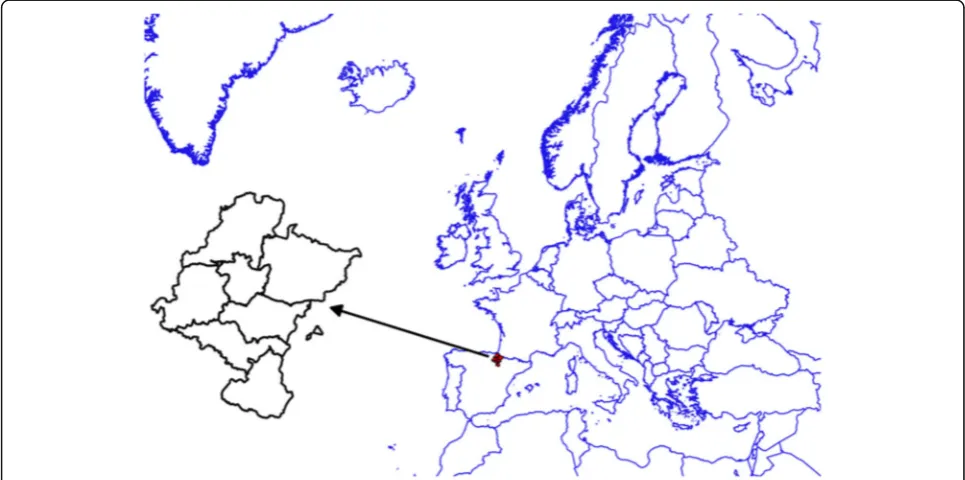
The study was conducted on a well-defined population from the Navarre Community in Northern Spain (Fig.1) with an estimated population of 640,647 inhabitants as per the 2016 census [20]. Most citizens are covered by the Regional Public Health Service of Navarre - Osasun-bidea, part of the Spanish National Health Service. Only 3.1% of the population has private o mixed health insur-ance [21]. Navarre is organized in seven geographic areas (Fig.1) (Navarre 2000 Zoning) [22].
Diagnostic criteria
The study considered patients of any age, residents in Navarre during 2000–2015, with a definitive diagnosis or with high suspicion of suffering an IMD even without confirmed genetic diagnosis. We distinguished two groups of patients: 1) The definitive diagnosis of IMD
group included subjects with genetically confirmed diag-nosis as proposed in the 2017 version of the gene table of monogenic neuromuscular disorders [23] or with typ-ical clintyp-ical phenotype consistent with a pathogenic mu-tation verified within the pedigree or patients with specific and well-correlated histopathological findings even in the absence of genetic confirmation. 2) The un-classified IMD group included patients with suspected but undiagnosed genetic muscle disease according to the phenotypes described by Harris et al. [24] following a thorough analysis of the patient: a) congenital onset and normal or mildly elevated creatine kinase (CK) levels; b) adult onset proximal weakness with significantly elevated CK and possible recessive inheritance; c) myopathy with prominent contractures. Patients from the second group did not meet the criteria of definitive IMD subtype as shown in Table 1. Subjects with muscle channelopathy, mitochondrial myopathies, female carriers of dystrophi-nopathy or isolated hyperCKemia were excluded from this study.
Genetic analysis
Blood was collected from patient after obtaining in-formed consent. DNA was extracted using standard pro-cedures from peripheral blood samples taken from all patients. Appropriate genetic studies were performed in each case.
Sequencing techniques after amplification of all coding exons and adjacent areas of different genes associated to inherited muscle disease (CAPN3, DYSF, SGCG, SGCA, FKRP, ANO5, PABPN1, EMD, LMNA, GMPPB, GAA,
PYGM, CPT2, MYH-7, ACTA1, LDB3) were performed to determine the DNA variants consistent in base changes; substitutions, and small insertions and dele-tions. First studies were carried out by Sanger sequen-cing following diagnostic algorithms gene-to-gene, while the implementation of the next generation se-quencing (NGS) techniques in clinical diagnosis was studied by groups or panels in different NGS plat-forms. Bioinformatic tools were used to the alignment
of the sequences to human reference genome; and de-tection, annotation and prioritization of variants.
DMD gene dosage analysis was determined by multi-plex ligation-dependent probe amplification (MLPA). The SALSA® MLPA® P034 DMD-1 and P035 DMD-2 (MRC-Holland, Amsterdam) were used for the detec-tion of exon deledetec-tions or duplicadetec-tions in the DMD gene while point mutations were identified by sequen-cing studies.
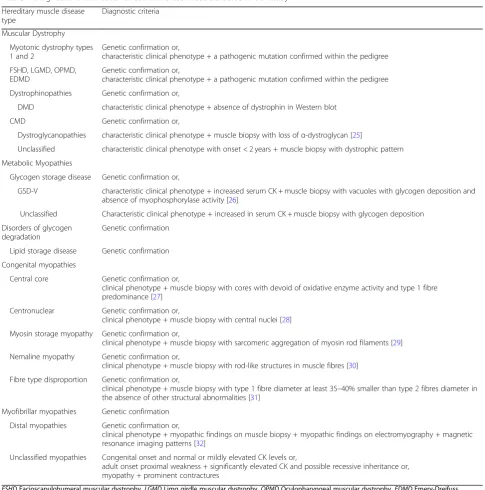
Table 1Diagnostic criteria used for each Inherited Muscle Disease in our study
Hereditary muscle disease type
Diagnostic criteria
Muscular Dystrophy
Myotonic dystrophy types 1 and 2
Genetic confirmation or,
characteristic clinical phenotype + a pathogenic mutation confirmed within the pedigree
FSHD, LGMD, OPMD, EDMD
Genetic confirmation or,
characteristic clinical phenotype + a pathogenic mutation confirmed within the pedigree
Dystrophinopathies Genetic confirmation or,
DMD characteristic clinical phenotype + absence of dystrophin in Western blot
CMD Genetic confirmation or,
Dystroglycanopathies characteristic clinical phenotype + muscle biopsy with loss ofα-dystroglycan [25]
Unclassified characteristic clinical phenotype with onset < 2 years + muscle biopsy with dystrophic pattern
Metabolic Myopathies
Glycogen storage disease Genetic confirmation or,
GSD-V characteristic clinical phenotype + increased serum CK + muscle biopsy with vacuoles with glycogen deposition and absence of myophosphorylase activity [26]
Unclassified Characteristic clinical phenotype + increased in serum CK + muscle biopsy with glycogen deposition
Disorders of glycogen degradation
Genetic confirmation
Lipid storage disease Genetic confirmation
Congenital myopathies
Central core Genetic confirmation or,
clinical phenotype + muscle biopsy with cores with devoid of oxidative enzyme activity and type 1 fibre predominance [27]
Centronuclear Genetic confirmation or,
clinical phenotype + muscle biopsy with central nuclei [28]
Myosin storage myopathy Genetic confirmation or,
clinical phenotype + muscle biopsy with sarcomeric aggregation of myosin rod filaments [29]
Nemaline myopathy Genetic confirmation or,
clinical phenotype + muscle biopsy with rod-like structures in muscle fibres [30]
Fibre type disproportion Genetic confirmation or,
clinical phenotype + muscle biopsy with type 1 fibre diameter at least 35–40% smaller than type 2 fibres diameter in the absence of other structural abnormalities [31]
Myofibrillar myopathies Genetic confirmation
Distal myopathies Genetic confirmation or,
clinical phenotype + myopathic findings on muscle biopsy + myopathic findings on electromyography + magnetic resonance imaging patterns [32]
Unclassified myopathies Congenital onset and normal or mildly elevated CK levels or,
adult onset proximal weakness + significantly elevated CK and possible recessive inheritance or, myopathy + prominent contractures
Myotonic dystrophy type l (DM-1) is caused by (CTG)n repeat expansion in the 3′-untranslated region of the DMPK gene. The sizing of this expansion was done by conventional PCR, fragment-length analysis, repeat-primed PCR, and fragment-length analysis.
The contraction of the D4Z4 repeat on chromosomes 4 is responsible of the facioscapulohumeral muscular dystrophy type 1 (FSHD1). The size of the D4Z4 repeats was determined by pulsed field gel electrophoresis (PFGE) as previously described [33]. Facioscapulohum-eral muscular dystrophy type 2 (FSHD2) was studied by sequencing of SMCHD1 gene, which is involved in the maintenance of D4Z4 methylation.
Variants of interest detected by sequencing were classi-fied according to different databases and the published lit-erature. Population databases: 1000 Genomes Project (http://browser.1000genomes.org), Exome Variant Server (http://evs.gs.washington.edu/EVS) and Exome Aggrega-tion Consortium (http://exac.broadinstitute.org/). Disease databases: Human Gene Mutation Database (http://www. hgmd.org), Leiden Open Variation Database (http://www. lovd.nl) and ClinVar ( http://www.ncbi.nlm.nih.gov/clin-var). In silico approach was carried out to assess the pathogenicity of new variants using different tools as Mu-tation Taster (http://www.mutationtaster.org).
Methodological validation and segregation studies were performed by direct sequencing (ABI 3500 Genetic Analyzer, Applied Biosystems, Warrington, UK) using Big Dye Terminator Cycle Sequencing Kit (Applied Bio-systems, Warrington, UK). The subsequent analysis was done with SeqScape software (Thermo Fisher).
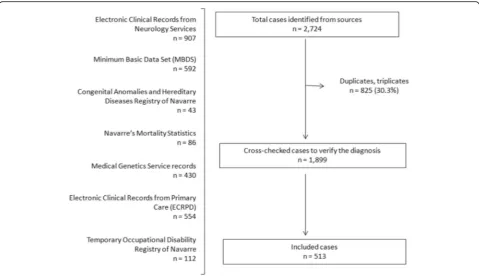
Case ascertainment sources
Case ascertainment was achieved using multiple overlap-ping sources:
(1) Navarre’s Minimum Basic Data Set (MBDS), a re-gional computer-based database system designed to collect demographic, clinical and administrative data on discharges, including both private and publicly funded hospitals. Inter-national Classification of Diseases (Ninth Revision, Clinical Modification, ICD-9-CM), including 271.0, 272.7, 359.0, 359.1, 359.2, 359.21, 359.22, 359.29, 359.89 and 359.9, were used to search patients affected by IMDs [34].
(2) Electronic Clinical Records in Primary Care (ECRPC) of Navarre‘s Public Health System, a regional healthcare information system that allows registering demographic, clinical and administrative data on primary care episodes. International Classification of Primary Care, second edition (ICPC-2) was used to encode healthcare episodes [35]. In Navarre, the ECRPC system proposes several literal descriptors linked to the ICPC-2 codes for general practitioners, including muscular dystrophy and unspecified myopathy for code N99 (Neurological disease, other), which we used for selecting the patients [36].
(3) Temporary Occupational Disability Registry of Na-varre, designed to collect data on sick leaves. ICD-9-CM codes, including the aforementioned ones, were used to select patients affected by IMDs [36].
(4) Records from the Medical Genetics Service allowed selecting patients that were being monitored for IMD suspicion. Several keywords enabled us to detect these patients, depending on the reason for the request of the genetic study.
(5) The Congenital Anomalies and Hereditary Diseases Registry of Navarre, a population-based listing affiliated member to EUROCAT [37]. Keyword diagnostic searches were used to select patients suffering IMDs.
(6) Navarre’s Mortality Statistics in which the primary cause of death from the Medical Death Certificate [38, 39] is listed. We used the ICD-10 codes, including G71.0, G71.1, G71.2, G71.3, G71.8, G71.9, G72.8, G72.9 and G73.6 to identify IMD patients.
(7) Electronic Clinical Records from the Neurology Services of Navarre’s public hospitals. Patients with IMDs were detected using keyword diagnostic searches.
The information from the various data sources showed all potential diagnoses of IMDs. This information was cross-checked with the databases for duplication. Next, a neuromuscular neurologist verified the diagnosis of each double-checked case based on the inclusion and exclu-sion criteria for each condition.
We collected the following information: type of IMD, gender, date of birth, date of death, place of residence on January 1, 2016, and genetic diagnosis.
Data analysis
January 1, 2016 was the date chosen for estimating prevalence. The population at risk is defined as the resi-dents of Navarre as per the Spanish National Statistics Institute and the Statistics Institute of Navarre [20] (Na-varre population = 640,647). The 2016 prevalence rates are expressed as cases/100,000 inhabitants. An overall prevalence was estimated globally and by gender, age and geographical area within Navarre. Descriptive results are presented as frequencies and proportions. Poisson distribution was assumed to estimate CI 95% for preva-lence and proportions rates. For inter-group proportion comparisons, the Pearson Chi-square test was applied. Statistical analyses were conducted using the OpenEpi program [40].
Results
(1.21:1). Twenty-six different disease entities were de-tected. During the study period, 23.20% of the subjects (62 males and 57 females) died.
Genetic and other diagnostic standards
From the 513 identified IMDs, 464 were definitive and 49 unclassified IMDs, respectively. Concerning the de-finitive IMD cases, 329 (70.90%) were genetically veri-fied, 113 (24.35%) had a clinical phenotype with a pathogenic mutation confirmed with the pedigree, and in 22 (4.74%), characteristic muscle biopsy pathogenic features were found (Table2).
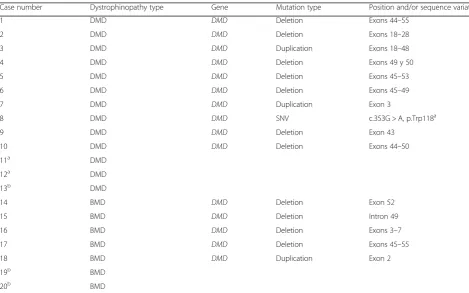
Genetic descriptions of dystrophinopathies are detailed in Table3, while the rest of IMDs can be seen Table4.
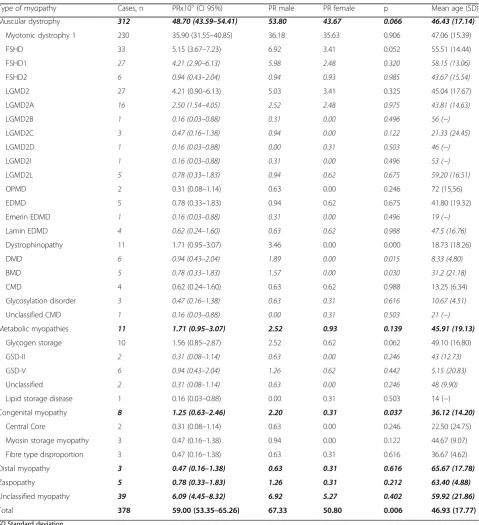
Prevalence
On 1 January 2016, 378 subjects with IMDs (56.61% male and 43.39% female) were residents of Navarre, im-plying a prevalence of 59.00/100,000 inhabitants (CI 95%; 53.35–65.26) (Table5). DM-1 represented the most common IMDs, with a prevalence of 35.90/100,000 (CI 95%; 31.55–40.85), followed by facioscapulohumeral muscular dystrophy (FSHD) and limb girdle muscular dystrophy 2A (LGMD2A) affecting 5.15/100,000 (95% CI; 3.67–7.23) and 2.5/100,000 (CI 95%; 1.54–4.05) in-habitants, respectively. There were 11 cases of dystrophi-nopathies, with Duchenne muscular dystrophy (DMD) present in 0.94/100,000 (CI 95%; 0.43–2.04) and Becker
muscular dystrophy (BMD) in 0.78/100,000 (CI 95%; 0.33–1.83) individuals. Congenital myopathy, congenital muscular dystrophy (CMD), myofibrillar myopathy, and metabolic myopathy were observed in 1.25 (CI 95%; 0.63–2.46), 0.62 (CI 95%; 0.24–1.60), 0.78 (CI 95%; 0.33–1.83), and 1.71 (CI 95%; 0.95–3.07) per every 100, 000 inhabitants, respectively.
The range of age was 1–89 years, with a mean age of 46.93 years (SD 17.77) (45.70 (SD 19.01) for males and 48.54 (SD 15.93) for females). The highest age-specific prevalence (Table6) was obtained for the age range between 45 to 54 years, with a prevalence of 91.32/100,000 (CI 95%; 74.31–112.2) subjects. Prevalence was statistically significant higher in males in comparison to females for the following groups: under 15, 25 to 34, and 75 to 84 years of age.
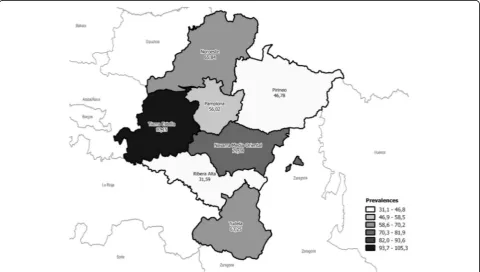
The prevalence of IMDs differed notably by geo-graphic areas, with the highest estimate found for the region of Tierra Estella (97.15/100,000 subjects), significantly higher in comparison to all other areas, ex-cept for the Eastern Middle area of Navarre. Figure 3 shows the geographical distribution of IMD prevalence.
Discussion
In this study, we present data on Inherited Muscle Dis-eases compiled over a 16-year period from different healthcare information systems. Our results show a prevalence of IMDs in Navarre of 59.00/100,000 sub-jects, being higher in males than in females, highest for
the 45 to 54 years age range, and with remarkable geo-graphical variability. DM-1, FSHD, and LGMD2A are the most common subtypes IMDs.
We believe the non-inclusion in the analyses of the unclassified group of IMDs may underestimate the real prevalence, bearing in mind that each case was thor-oughly assessed by a specialized neurologist. To avoid selection biases when comparing with other studies, we also present prevalence with a confirmed genetic diagno-sis: 50.10/100,000 (CI 95%; 44.92–55.89), which remains to be high in comparison to the results published
elsewhere [5]. Four hundred and forty two cases (86.16%) of IMDs had a confirmed genetic diagnosis.
Epidemiological studies of neuromuscular diseases Prevalence studies require exhaustiveness. The lack of specific registries and the absence of diagnostic code veri-fications [9,41–43] could lead an IMD selection bias [15]. Moreover, for comparability purposes stringent inclusion criteria is mandatory.
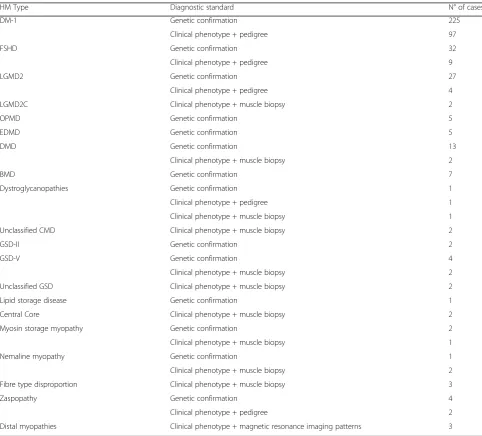
Aiming to avoid these intrinsic limitations in preva-lence studies, for this study we used seven case Table 2Inherited Muscle Disease subtype and diagnostic standard used
HM Type Diagnostic standard N° of cases
DM-1 Genetic confirmation 225
Clinical phenotype + pedigree 97
FSHD Genetic confirmation 32
Clinical phenotype + pedigree 9
LGMD2 Genetic confirmation 27
Clinical phenotype + pedigree 4
LGMD2C Clinical phenotype + muscle biopsy 2
OPMD Genetic confirmation 5
EDMD Genetic confirmation 5
DMD Genetic confirmation 13
Clinical phenotype + muscle biopsy 2
BMD Genetic confirmation 7
Dystroglycanopathies Genetic confirmation 1
Clinical phenotype + pedigree 1
Clinical phenotype + muscle biopsy 1
Unclassified CMD Clinical phenotype + muscle biopsy 2
GSD-II Genetic confirmation 2
GSD-V Genetic confirmation 4
Clinical phenotype + muscle biopsy 2
Unclassified GSD Clinical phenotype + muscle biopsy 2
Lipid storage disease Genetic confirmation 1
Central Core Clinical phenotype + muscle biopsy 2
Myosin storage myopathy Genetic confirmation 2
Clinical phenotype + muscle biopsy 1
Nemaline myopathy Genetic confirmation 1
Clinical phenotype + muscle biopsy 2
Fibre type disproportion Clinical phenotype + muscle biopsy 3
Zaspopathy Genetic confirmation 4
Clinical phenotype + pedigree 2
Distal myopathies Clinical phenotype + magnetic resonance imaging patterns 3
ascertainment sources at different healthcare levels and made an exhaustive verification of the diagnoses with well-defined inclusion and exclusion criteria.
Data sources
This study was affected by the lack of disease codifica-tion specificity in the Spanish healthcare informacodifica-tion systems for IMDs. Only 27.01% of the cases initially identified with the selected codes and keywords met the inclusion criteria for IMD. Thus, it is essential to review and verify the diagnosis procedures to obtain quality data for this type of epidemiological.
The introduction of population-based registries spe-cific for neuromuscular and/or other rare diseases, in-cluding specific codes, would be of great help in future studies.
Overall and disease-specific prevalence data
Our study shows a prevalence of IMDs of 59.00/100,000 (CI 95%; 53.35–65.26) inhabitants for Navarre. Compari-sons with prevalence data from other regions is compli-cated due to the lack of methodological homogeneity and because most studies focus on a specific IMD. Emery [44] reports a global prevalence of hereditary neuromuscular disorders of 1/3500 inhabitants
(prevalence 28.57/100,000), including spinal muscular atrophy and hereditary sensitive-motor neuropathy. In another study carried out in the UK, a prevalence of IMDs of 37/100,000 people is described for a Northern region of England [6]. More recently, Theadom et al. [5] describe a prevalence of 22.3/100,000 inhabitants of all genetic muscle disorders in New Zealand, with higher incidence in subjects of European ancestry.
To the best of our knowledge, this is the first time a study includes all types of IMDs in a Spanish region.
The subtype of IMD with the highest number of cases in our series was DM-1 (58.87% of the cases) with a prevalence of 35.90/100,000 (CI 95%; 31.55–40.85). In previous works, the prevalence of this particular condi-tion showed wide geographical variacondi-tions. The lowest re-ported for Japan (0.2/100,000) [8] up to 172/100,000 for Quebec [45] due to the founder effect. Regarding data from Spanish regions, Burcet et al. [18] found 10.9/100, 000 cases of DM-1 in Majorca, while Munain et al. [16] reported 26.5/100,000 in Guipuzcoa. These regional var-iations could indicate a possible underestimation of prevalence linked to the used methodology.
However, we believe that despite the used method-ology, the high prevalence of DM-1 in Navarre could be explained by a possible founding effect, similar to that reported for Guipuzcoa [16], considering that both Table 3Genetically confirmed dystrophinopathies
Case number Dystrophinopathy type Gene Mutation type Position and/or sequence variation
1 DMD DMD Deletion Exons 44–55
2 DMD DMD Deletion Exons 18–28
3 DMD DMD Duplication Exons 18–48
4 DMD DMD Deletion Exons 49 y 50
5 DMD DMD Deletion Exons 45–53
6 DMD DMD Deletion Exons 45–49
7 DMD DMD Duplication Exon 3
8 DMD DMD SNV c.353G > A, p.Trp118a
9 DMD DMD Deletion Exon 43
10 DMD DMD Deletion Exons 44–50
11a DMD
12a DMD
13b DMD
14 BMD DMD Deletion Exon 52
15 BMD DMD Deletion Intron 49
16 BMD DMD Deletion Exons 3–7
17 BMD DMD Deletion Exons 45–55
18 BMD DMD Duplication Exon 2
19b BMD
20b BMD
a
No mutation identified. Negative deletion/duplication study. Positive familial segregation
b
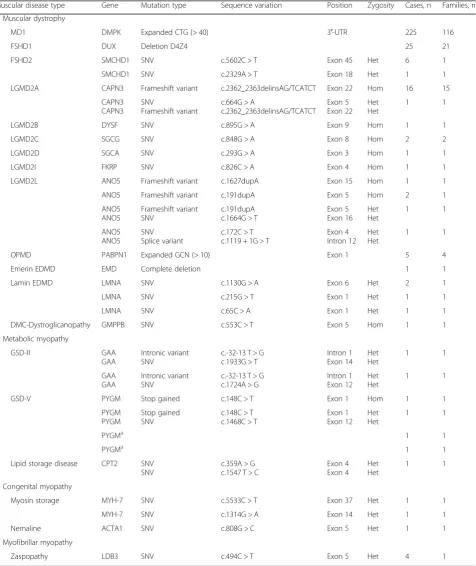
Table 4Pathogenic molecular defect of each genetically confirmed IMD
Muscular disease type Gene Mutation type Sequence variation Position Zygosity Cases, n Families, n
Muscular dystrophy
MD1 DMPK Expanded CTG (> 40) 3′-UTR 225 116
FSHD1 DUX Deletion D4Z4 25 21
FSHD2 SMCHD1 SNV c.5602C > T Exon 45 Het 6 1
SMCHD1 SNV c.2329A > T Exon 18 Het 1 1
LGMD2A CAPN3 Frameshift variant c.2362_2363delinsAG/TCATCT Exon 22 Hom 16 15
CAPN3 CAPN3
SNV
Frameshift variant
c.664G > A
c.2362_2363delinsAG/TCATCT
Exon 5 Exon 22
Het Het
1 1
LGMD2B DYSF SNV c.895G > A Exon 9 Hom 1 1
LGMD2C SGCG SNV c.848G > A Exon 8 Hom 2 2
LGMD2D SGCA SNV c.293G > A Exon 3 Hom 1 1
LGMD2I FKRP SNV c.826C > A Exon 4 Hom 1 1
LGMD2L ANO5 Frameshift variant c.1627dupA Exon 15 Hom 1 1
ANO5 Frameshift variant c.191dupA Exon 5 Hom 2 1
ANO5 ANO5
Frameshift variant SNV
c.191dupA c.1664G > T
Exon 5 Exon 16
Het Het
1 1
ANO5 ANO5
SNV Splice variant
c.172C > T c.1119 + 1G > T
Exon 4 Intron 12
Het Het
1 1
OPMD PABPN1 Expanded GCN (> 10) Exon 1 5 4
Emerin EDMD EMD Complete deletion 1 1
Lamin EDMD LMNA SNV c.1130G > A Exon 6 Het 2 1
LMNA SNV c.215G > T Exon 1 Het 1 1
LMNA SNV c.65C > A Exon 1 Het 1 1
DMC-Dystroglicanopathy GMPPB SNV c.553C > T Exon 5 Hom 1 1
Metabolic myopathy
GSD-II GAA
GAA
Intronic variant SNV
c.-32-13 T > G c.1933G > T
Intron 1 Exon 14
Het Het
1 1
GAA GAA
Intronic variant SNV
c.-32-13 T > G c.1724A > G
Intron 1 Exon 12
Het Het
1 1
GSD-V PYGM Stop gained c.148C > T Exon 1 Hom 1 1
PYGM PYGM
Stop gained SNV
c.148C > T c.1468C > T
Exon 1 Exon 12
Het Het
1 1
PYGMa 1 1
PYGMa 1 1
Lipid storage disease CPT2 SNV SNV
c.359A > G c.1547 T > C
Exon 4 Exon 4
Het Het
1 1
Congenital myopathy
Myosin storage MYH-7 SNV c.5533C > T Exon 37 Het 1 1
MYH-7 SNV c.1314G > A Exon 14 Het 1 1
Nemaline ACTA1 SNV c.808G > C Exon 5 Het 1 1
Myofibrillar myopathy
Zaspopathy LDB3 SNV c.494C > T Exon 5 Het 4 1
aEvidence of genetic confirmation in the clinical record; no access to the identified mutation
regions share cultural and background similarities. Moreover, the management of the patients by multidis-ciplinary teams in recent years may have a positive effect on survival by lowering the complications.
Prevalence of LGMD also differs between studies. Theadom’s review [15] reports a global prevalence of
LGMD of 0.9/100,000 inhabitants. Here, we show a higher prevalence of LGMD (4.21/100,000) (CI of 95% 2.90–6.13), closer to the 4.8/100,000 estimated by Far-deu et al. [46] in a tiny community in Reunion, where high rates of endogamy have been described. In Spain, a study by Urtasun et al. in the Basque Country found a Table 5Inherited muscle disease prevalence in Navarre by January 1, 2016
Type of myopathy Cases, n PRx105(CI 95%) PR male PR female p Mean age (SD) Muscular dystrophy 312 48.70 (43.59–54.41) 53.80 43.67 0.066 46.43 (17.14)
Myotonic dystrophy 1 230 35.90 (31.55–40.85) 36.18 35.63 0.906 47.06 (15.39)
FSHD 33 5.15 (3.67–7.23) 6.92 3.41 0.052 55.51 (14.44)
FSHD1 27 4.21 (2.90–6.13) 5.98 2.48 0.320 58.15 (13.06)
FSHD2 6 0.94 (0.43–2.04) 0.94 0.93 0.985 43.67 (15.54)
LGMD2 27 4.21 (0.90–6.13) 5.03 3.41 0.325 45.04 (17.67)
LGMD2A 16 2.50 (1.54–4.05) 2.52 2.48 0.975 43.81 (14.63)
LGMD2B 1 0.16 (0.03–0.88) 0.31 0.00 0.496 56 (−)
LGMD2C 3 0.47 (0.16–1.38) 0.94 0.00 0.122 21.33 (24.45)
LGMD2D 1 0.16 (0.03–0.88) 0.00 0.31 0.503 46 (−)
LGMD2I 1 0.16 (0.03–0.88) 0.31 0.00 0.496 53 (−)
LGMD2L 5 0.78 (0.33–1.83) 0.94 0.62 0.675 59.20 (16.51)
OPMD 2 0.31 (0.08–1.14) 0.63 0.00 0.246 72 (15,56)
EDMD 5 0.78 (0.33–1.83) 0.94 0.62 0.675 41.80 (19.32)
Emerin EDMD 1 0.16 (0.03–0.88) 0.31 0.00 0.496 19 (−)
Lamin EDMD 4 0.62 (0.24–1.60) 0.63 0.62 0.988 47.5 (16.76)
Dystrophinopathy 11 1.71 (0.95–3.07) 3.46 0.00 0.000 18.73 (18.26)
DMD 6 0.94 (0.43–2.04) 1.89 0.00 0.015 8.33 (4.80)
BMD 5 0.78 (0.33–1.83) 1.57 0.00 0.030 31.2 (21.18)
CMD 4 0.62 (0.24–1.60) 0.63 0.62 0.988 13.25 (6.34)
Glycosylation disorder 3 0.47 (0.16–1.38) 0.63 0.31 0.616 10.67 (4.51)
Unclassified CMD 1 0.16 (0.03–0.88) 0.00 0.31 0.503 21 (−)
Metabolic myopathies 11 1.71 (0.95–3.07) 2.52 0.93 0.139 45.91 (19.13)
Glycogen storage 10 1.56 (0.85–2.87) 2.52 0.62 0.062 49.10 (16.80)
GSD-II 2 0.31 (0.08–1.14) 0.63 0.00 0.246 43 (12.73)
GSD-V 6 0.94 (0.43–2.04) 1.26 0.62 0.442 5.15 (20.83)
Unclassified 2 0.31 (0.08–1.14) 0.63 0.00 0.246 48 (9.90)
Lipid storage disease 1 0.16 (0.03–0.88) 0.00 0.31 0.503 14 (−)
Congenital myopathy 8 1.25 (0.63–2.46) 2.20 0.31 0.037 36.12 (14.20)
Central Core 2 0.31 (0.08–1.14) 0.63 0.00 0.246 22.50 (24.75)
Myosin storage myopathy 3 0.47 (0.16–1.38) 0.94 0.00 0.122 44.67 (9.07)
Fibre type disproportion 3 0.47 (0.16–1.38) 0.63 0.31 0.616 36.67 (4.62)
Distal myopathy 3 0.47 (0.16–1.38) 0.63 0.31 0.616 65.67 (17.78)
Zaspopathy 5 0.78 (0.33–1.83) 1.26 0.31 0.212 63.40 (4.88)
Unclassified myopathy 39 6.09 (4.45–8.32) 6.92 5.27 0.402 59.92 (21.86)
Total 378 59.00 (53.35–65.26) 67.33 50.80 0.006 46.93 (17.77)
SDStandard deviation.
prevalence of 6.9/100,000 [17]. The most common form of LGMD is LGMD2A in the Basque Country and in our study, with over 50% of LGMD cases (59.26 and 61.29%, respectively). Both studies detected a high fre-quency of the c.2362_2363delinsAG/TCATCT mutation in exon 22 of theCAPN3gene, which has been observed primarily in chromosomes of Basque natives and more exceptionally in individuals from other parts of the world [17]. In our study, this pathogenic variant is present in 100% of the LGMD2A.
The prevalence of dystrophinopathies in our study is 0.94/100,000 for DMD and 0.78/100,000 for BMD. These values are lower than those reported elsewhere. The meta-analysis conducted by Mah et al. [47] showed an estimated prevalence of 4.78/100,000 (CI 95%; 1.94– 11.81) for DMD and 1.53/100,000 (CI 95%; 0.26–8.94) for BMD. The study performed in New Zealand [5] shows a prevalence of DMD of 2.45/100,000 (CI 95%; 2.01–2.98) and 1.67/100,000 (CI 95%; 1.32–2.12) for BMD with ethnic differences. However, some studies
Fig. 3Geographical distribution of prevalence (per 100,000) of inherited muscle disease in Navarre Table 6Prevalence of Inherited Muscle Disease according to group age and gender
Group age
PR/100,000 (CI 95%)
PR/100,000 (CI 95%) by gender
p
Women Men
< 15 21.87 (14.44–33.11) 10.20 (4.36–23.87) 32.97 (20.59–52.80) 0.015
15–24 41.84 (28.56–61.30) 42.84 (25.04–73.29) 40.89 (23.9–69.95) 0.906
25–34 48.99 (35.39–67.82) 21.93 (11.11–43.27) 75,68 (52.37–109.40) 0.000
35–44 72.13 (57.64–90.26) 70.53 (50.95–97.62) 73.63 (54.08–100.24) 0.853
45–54 91.32 (74.31–112.2) 93.36 (69.79–124.92) 89.37 (66.81–119.6) 0.836
55–64 91.50 (72.56–115.40) 82.69 (58.58–116.7) 100.27 (73.37–137.20) 0.421
65–74 59.40 (42.92–82.23) 57.51 (36.38–90.9) 61.43 (38.86–97.09) 0.844
75–84 39.08 (24.06–63.47) 21.42 (9.15–50.14) 62.48 (34.9–111.90) 0.044
≥85 23.38 (9.99–54.73) 13.92 (3.81–50.76) 42.73 (14.53–125.62) 0.245
show a prevalence of DMD below 2/100,000 [43, 48]. We believe that the poor exploitation of electronic clin-ical records from Paediatric Services did not cause a biased estimation of dystrophinopathies in our study.
We observed higher prevalence of IMDs in men than in women. This difference could be due to the X-linked inheritance of DMD and BMD. However, we also ob-served significant differences in the congenital myop-athies subgroup, with higher prevalence in men. Furthermore, there was higher prevalence in men in the following age groups: under 15, 25 to 34, and 75 to 84 years of age. In the under 15 group, the X-linked nature of DMD could explain this elevated prevalence [49]. In the other two age groups, the IMD subtypes differ greatly and we have clear explanation for the gender dif-ferences. The highest prevalence of IMDs is seen for the working age group (between 35 to 64 years) probably contributing to huge socio-economic burden. Further studies should be designed to analyse the impact these conditions have on the economy.
We also detected prevalence geographical distribution differences within Navarre, which may be useful when planning resources. The highest prevalence of IMDs was determined for Tierra Estella Area (PR 97.15 with IC 95% 70.19–134.50) (Fig.3).
Unclassified inherited muscle disease
In the course of this study, we identified 49 patients (9.55%) with a potential genetic cause for their muscle disease. During the period of our study (2000 to 2015), most genetic diagnosis followed the gene-by-gene testing strategy based on their phenotype. Current availability of next-generation sequencing is changing the diagnostic approach, increasing confirmed genetic diagnosis, as well as the identification of new IMD-associated mutations.
Thirty-nine patients remained alive by the end of the study (December 2015) and from the end of the study to the present time genetic IMD confirmation was obtained for 18 (46, 15%).
Study limitations
Although the study has been exhaustive, poor exploit-ation of the electronic clinical records in Paediatric Ser-vices could bias childhood IMD data, e.g., DMD. However, we believe that the exploitation of other data sources counteracts this deficiency, consequently with mild underestimation of IMD prevalence in this age group.
Conclusions
The prevalence of IMDs in Navarre is 59.00/100,000 in-habitants CI (53.35–65.26), which is a high number if compared with data reported for other geographical re-gions. If only patients with confirmed genetic diagnosis
are considered, the prevalence is 50.10/100,000 (CI 95%; 44.92–55.89). The high prevalence of DM-1 (35.90/100, 000 with CI 31.55–40.85) and of LGMD2A (2.5/100,000 with CI 1.54–4.05) could suggest the existence of a founding effect in Navarre. Genetic confirmation was available in 442 (86.16%) of IMD patients in our region. Our population study has a high sensitivity because all possible sources of information have been used. The lack of specificity of disease coding in our health information system for IMDs has made the study difficult and has forced us to review the clinical data of each case to verify the diagnosis. It is essential to implement specific popu-lation based registries for neuromuscular and other rare diseases, taking into account the heterogeneity of these disorders.
Abbreviations
BMD:Becker Muscular Dystrophy; CMD: Congenital Muscular Dystrophy; DM-1: Myotonic Dystrophy type 1; DMD: Duchenne Muscular Dystrophy; FSHD: Facioscapulohumeral Dystrophy; ICD: International Classification of Diseases; IMDs: Inherited Muscle Diseases; LGMD: Limb Girdle Muscular Dystrophy
Acknowledgements
The authors would like to thank all those responsible of the case ascertainment sources consulted for their collaboration; to María A. Ramos-Arroyo and Eva Ardanaz for their kind advices; to the Genetic Department of the Sant Pau Hospital (Barcelona) and the Biodonostia Institute for their col-laboration in genetic analysis.
Authors’contributions
Conceptualization and design: IJ, EV and IP; Methodology: IP, EV, BI and IJ; Funding acquisition: IJ and EV; Data curation: IP, EV, LT, FG, IEB and JD; Map design: JD; Supervision: IJ, EV and BI; writing-original draft: IP and IJ. All au-thors read and approved the final manuscript.
Funding
This study was partially supported by the Health Department of the Navarre Government (project 007–2017), co-funded (50%) by the European Regional Development Fund (ERDF) through the Navarre ERDF 2014–2020 Operative Programme.
Availability of data and materials
The data that support the findings of this study are available in the records of the health systems described in the study, but restrictions apply to the availability of these data, which were used under license for the current study, and so are not publicly available. Data are however available from the authors upon reasonable request and with permission of Complejo Hospitalario de Navarra and Navarra’s Public Health System.
Ethics approval and consent to participate
The study protocol was approved by the Navarre Ethical Committee for Medical Research (Pyto 2016/31).
Consent for publication
Not applicable.
Competing interests
The authors declare that they have no competing interests.
Author details
1Department of Neurology, Complejo Hospitalario de Navarra, IdiSNA
(Navarre Institute for Health Research), Pamplona, Spain.2Community Health
Observatory Section, Instituto de Salud Pública y Laboral de Navarra, IdiSNA, Pamplona, Spain.3Department of Health Sciences, Universidad Pública de
Navarra (UPNA), IdiSNA, Pamplona, Spain.4Methodology Unit.
Spain.5Primary Care, Servicio Navarro de Salud–Osasunbidea, IdiSNA,
Pamplona, Spain.6Miguel Servet Foundation, Navarrabiomed, Pamplona,
Spain.7Department of Genetics, Complejo Hospitalario de Navarra, IdiSNA,
Pamplona, Spain.8CIBER Epidemiology and Public Health (CIBERESP), Madrid, Spain.9Department of Neurology, Complejo Hospitalario de Navarra, 31008
Pamplona, C/ Irunlarrea, Spain.
Received: 19 March 2019 Accepted: 10 October 2019
References
1. Mercuri E, Muntoni F. Muscular dystrophies. Lancet. 2013;381:845–60. 2. D’Angelo MG, Bresolin N. Report of the 95th European neuromuscular
Centre (ENMC) sponsored international workshop cognitive impairment in neuromuscular disorders, Naarden, the Netherlands, 13-15 July 2001. Neuromuscul Disord. 2003;13:72–9.
3. Boyer F, Drame M, Morrone I, Novella J-L. Factors relating to carer burden for families of persons with muscular dystrophy. J Rehabil Med. 2006;38:309–15.
4. Lefter S, Hardiman O, Ryan AM. A population-based epidemiologic study of adult neuromuscular disease in the Republic of Ireland. Neurology. 2017;88:304–13.
5. Theadom A, Rodrigues M, Poke G, O’Grady G, Love D, Hammond-Tooke G, et al. A Nationwide, population-based prevalence study of genetic muscle disorders. Neuroepidemiology. 2019;52:128–35.
6. Norwood FLM, Harling C, Chinnery PF, Eagle M, Bushby K, Straub V. Prevalence of genetic muscle disease in northern England: in-depth analysis of a muscle clinic population. Brain. 2009;132:3175–86.
7. Hughes MI, Hicks EM, Nevin NCPV. The prevalence of inherited neuromuscular disease in Northern Ireland. Neuromuscul Disord. 1996;6:69–73.
8. Araki S, Uchino M, Kumamoto T. Prevalence studies of multiple sclerosis, myasthenia gravis, and myopathies in Kumamoto district. Japan Neuroepidemiology. 1987;6:120–9.
9. Darin N, Tulinius M. Neuromuscular disorders in childhood: a descriptive epidemiological study from western Sweden. Neuromuscul Disord. 2000; 10:1–9.
10. Chung B, Wong V, Ip P. Prevalence of neuromuscular diseases in Chinese children: a study in southern China. J Child Neurol. 2003;18:217–9. 11. El-Tallawy HN, Khedr EM, Qayed MH, Helliwell TR, Kamel NF.
Epidemiological study of muscular disorders in Assiut. Egypt Neuroepidemiology. 2005;25:205–11.
12. Tangsrud SE, Halvorsen S. Child neuromuscular disease in southern Norway. Prevalence, age and distribution of diagnosis with special reference to "non-Duchenne muscular dystrophy". Clin Genet. 1988;34(3):145–52. 13. Kurtzke JF. Neuroepidemiology. Ann Neurol. 1984;16:265–77. 14. Ahlström G, Gunnarsson LG, Leissner P, Sjödén PO. Epidemiology of
neuromuscular diseases, including the postpolio sequelae, in a Swedish county. Neuroepidemiology. 1993;12:262–9.
15. Theadom A, Rodrigues M, Roxburgh R, Balalla S, Higgins C, Bhattacharjee R, et al. Prevalence of muscular dystrophies: a systematic literature review. Neuroepidemiology. 2014;43:259–68.
16. López de Munain A, Blanco A, Emparanza JI, Poza JJ, Martí Massó JF, Cobo A, et al. Prevalence of myotonic dystrophy in Guipúzcoa (Basque Country, Spain). Neurology. 1993;43:1573–6.
17. Urtasun M, Sáenz A, Roudaut C, Poza JJ, Urtizberea JA, Cobo AM, et al. Limb-girdle muscular dystrophy in Guipúzcoa (Basque Country, Spain). Brain. 1998;121:1735–47.
18. Burcet J, Cañellas F, Cavaller G, Vich M. Epidemiologic study of myotonic dystrophy on the island of Mallorca. Neurologia. 1992;7:61–4.
19. Arpa J, Cruz-Martínez A, Campos Y, Gutiérrez-Molina M, García-Rio F, Pérez-Conde C, et al. Prevalence and progression of mitochondrial diseases: a study of 50 patients. Muscle Nerve. 2003;28:690–5.
20. Statistics Navarre 2016 Census.https://administracionelectronica.navarra.es/ GN.InstitutoEstadistica.Web/informacionestadistica.aspx?R=1&E=1. Accessed 1 Jun 2018.
21. Ministerio de Sanidad y Consumo. Encuesta Nacional de Salud 2011–2012. https://www.navarra.es/home_es/Temas/Portal+de+la+Salud/Profesionales/ Informacion+tecnica/Sanidad/encuesta+de+salud.htm. Accessed 1 Jun 2018. 22. European data portal. Zonificación Navarra. 2000https://www.
europeandataportal.eu/data/en/dataset/spasitnaestadi_pol_szonnav2000-xml01. Accessed 1 Jun 2018.
23. Bonne G, Rivier F, Hamroun D. The 2018 version of the gene table of monogenic neuromuscular disorders (nuclear genome). Neuromuscul Disord. 2017;27:1152–83.
24. Harris E, Laval S, Hudson J, Barresi R, De Waele L, Straub V, et al. Undiagnosed genetic muscle disease in the north of England: an in depth phenotype analysis. PLoS Curr. 2013;5.
25. Bönnemann CG, Wang CH, Quijano-Roy S, Deconinck N, Bertini E, Ferreiro A, et al. Diagnostic approach to the congenital muscular dystrophies. Neuromuscul Disord.
2014;24:289–311.
26. McARDLE B. Myopathy due to a defect in muscle glycogen breakdown. Clin Sci. 1951;10:13–35.
27. Jungbluth H, Sewry CA, Muntoni F. Core myopathies. Semin Pediatr Neurol. 2011;18:239–49.
28. Bornemann A, Goebel HH. Congenital myopathies. Brain Pathol. 2001;11:206–17. 29. Tajsharghi H, Thornell L-E, Lindberg C, Lindvall B, Henriksson K-G, Oldfors A.
Myosin storage myopathy associated with a heterozygous missense mutation in MYH7. Ann Neurol.
2003;54:494–500.
30. Wallgren-Pettersson C, Sewry CA, Nowak KJ, Laing NG. Nemaline myopathies. Semin Pediatr Neurol. 2011;18:230–8.
31. Clarke NF, North KN. Congenital fiber type disproportion--30 years on. J Neuropathol Exp Neurol. 2003;62:977–89.
32. Udd B. Distal myopathies. Curr Neurol Neurosci Rep. 2014;14:434. 33. Lemmers RJ, van der Vliet PJ, Klooster R, Sacconi S, Camaño P, Dauwerse JG,
et al. A unifying genetic model for facioscapulohumeral muscular dystrophy. Science. 2010;329(5999):1650–3.
34. Fernández-Navarro P, López-Abente G, Salido-Campos C, Sanz-Anquela JM. The minimum basic data set (MBDS) as a tool for cancer epidemiological surveillance. Eur J Intern Med. 2016;34:94–7.
35. Esteban-Vasallo MD, Domínguez-Berjón MF, Astray-Mochales J, Gènova-Maleras R, Pérez-Sania A, Sánchez-Perruca L, et al. Epidemiological usefulness of population-based electronic clinical records in primary care: estimation of the prevalence of chronic diseases. Fam Pract. 2009; 26:445–54.
36. Ancín Ducay J, Erce López S, Extramiana Cameno E, Izcue Argandoña A. Correlación de códigos CEI-9-MC (8aedic) - CIAP-2 para la gestión de
Incapacidad Teporal. Inst Salud Pública y Labor Navarra. 2014;https://www. navarra.es/NR/rdonlyres/E520399C-0612-4C75-A912-B16295014FC3/281429/ codigosCIE_9_MC.pdf. Accessed 1 Jun 2018.
37. Kinsner-Ovaskainen A, Lanzoni M, Garne E, Loane M, Morris J, Neville A, et al. A sustainable solution for the activities of the European network for surveillance of congenital anomalies: EUROCAT as part of the EU platform on rare diseases registration. Eur J Med Genet. 2018;61:513–7.
38. Floristán Floristán Y, Delfrade Osinaga J, Carrillo Prieto J, Aguirre Perez J, Moreno-Iribas C. Coding causes of death with IRIS software. Impact in Navarre mortality statistic. Rev Esp Salud Publica. 2016;90:e1–9. 39. Gómez-Redondo R, Faus-Bertomeu A, Poniakina S, Cámara-Izquierdo N.
About Spain data on causes of death. 2017.https://www.causesofdeath.org/ Data/ESP/20170126/ESP_bd.pdf. Accessed 1 Jun 2018.
40. Estadísticas epidemiológicas de código abierto para Salud Pública. Versión 3.01.http://www.openepi.com/Menu/OE_Menu.htm. Accessed 1 Jun 2018.
41. Yates JR, Emery AE. A population study of adult onset limb-girdle muscular dystrophy. J Med Genet. 1985;22:250–7.
42. Merlini L, Stagni SB, Marri E, Granata C. Epidemiology of neuromuscular disorders in the under-20 population in Bologna Province. Italy Neuromuscul Disord. 1992;2:197–200.
43. Ballo R, Viljoen D, Beighton P. Duchenne and Becker muscular dystrophy prevalence in South Africa and molecular findings in 128 persons affected. S Afr Med J. 1994;84:494–7.
44. Emery AE. Population frequencies of inherited neuromuscular diseases-a world survey. Neuromuscul Disord. 1991;1:19–29.
45. Mathieu J, Prévost C. Epidemiological surveillance of myotonic dystrophy type 1: a 25-year population-based study. Neuromuscul Disord. 2012;22:974–9. 46. Fardeau M, Hillaire D, Mignard C, Feingold N, Feingold J, Mignard D, et al.
Juvenile limb-girdle muscular dystrophy. Clinical, histopathological and genetic data from a small community living in the Reunion Island. Brain. 1996;119:295–308.
and Becker muscular dystrophy. Neuromuscul Disord. 2014;24:482–91.
48. Siciliano G, Tessa A, Renna M, Manca ML, Mancuso M, Murri L. Epidemiology of dystrophinopathies in North-West Tuscany: a molecular genetics-based revisitation. Clin Genet. 1999;56:51–8.
49. Birnkrant DJ, Bushby K, Bann CM, Apkon SD, Blackwell A, Brumbaugh D, et al. Diagnosis and management of Duchenne muscular dystrophy, part 1: diagnosis, and neuromuscular, rehabilitation, endocrine, and gastrointestinal and nutritional management. Lancet Neurol. 2018;17(3):251–67.
Publisher’s Note