R E S E A R C H
Open Access
Tea and coffee consumption in relation to
vitamin D and calcium levels in Saudi adolescents
Abdulaziz Al-Othman
1,2, Sara Al-Musharaf
3, Nasser M Al-Daghri
1,4,5,11*, Sobhy Yakout
4, Khalid M Alkharfy
1,6,
Yousef Al-Saleh
1,7, Omar S Al-Attas
1,4,5, Majed S Alokail
1,4,5, Osama Moharram
8, Shaun Sabico
4,
Sudhesh Kumar
9and George P Chrousos
4,10Abstract
Background:Coffee and tea consumption was hypothesized to interact with variants of vitamin D-receptor polymorphisms, but limited evidence exists. Here we determine for the first time whether increased coffee and tea consumption affects circulating levels of 25-hydroxyvitamin D in a cohort of Saudi adolescents.
Methods:A total of 330 randomly selected Saudi adolescents were included. Anthropometrics were recorded and fasting blood samples were analyzed for routine analysis of fasting glucose, lipid levels, calcium, albumin and phosphorous. Frequency of coffee and tea intake was noted. 25-hydroxyvitamin D levels were measured using enzyme-linked immunosorbent assays.
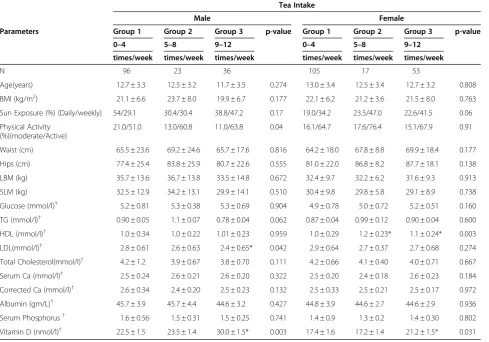
Results:Improved lipid profiles were observed in both boys and girls, as demonstrated by increased levels of HDL-cholesterol, even after controlling for age and BMI, among those consuming 9–12 cups of coffee/week. Vitamin D levels were significantly highest among those consuming 9–12 cups of tea/week in all subjects (p-value 0.009) independent of age, gender, BMI, physical activity and sun exposure.
Conclusion:This study suggests a link between tea consumption and vitamin D levels in a cohort of Saudi adolescents, independent of age, BMI, gender, physical activity and sun exposure. These findings should be confirmed prospectively.
Keywords:Coffee intake, Tea intake, Vitamin D levels, Saudi adolescents
Background
Coffee is arguably the most widely consumed non-carbonated beverage around the world [1]. In Saudi Ara-bia, the Arabian coffee“Gahwa”, is a common hot drink. It is a mainstay drink served to guests, consumed almost daily in most Saudi homes, and is served heavily in all local social occasions and gatherings. This coffee is served in traditional standard small cups (around 30 ml each) and is usually consumed with fresh or preserved dates.
Traditionally, the beneficial effects of coffee have been attributed solely to caffeine, but increasing evidence sug-gests that other compounds may contribute to the health benefits of coffee consumption [2]. In fact, coffee is a
complex mixture of compounds composed of more than a thousand different chemicals, including carbohydrates, lipids, nitrogenous compounds, vitamins, minerals, alka-loids and phenolic compounds among them caffeine, cafestol, and kahweol [3].
The effects of caffeine consumption in children is lim-ited, and most studies have focused on behavioral effects [4]. In general, caffeine doses less than 3.0 mg/kg of body weight have not resulted in any adverse effects on children in controlled clinical trials, but concerns regarding its effects on the developing nervous system have led to recommendations that daily intake should be limited to 2.5 mg/kg of body weight [5].
With regards to bone metabolism, increased coffee consumption was documented to cause a negative shift in overall calcium balance, but was not related to bone turnover in postmenopausal women with fracture osteo-porosis [6]. Furthermore, caffeine was observed to
* Correspondence:aldaghri2011@gmail.com 1
Prince Mutaib Chair for Biomarkers of Osteoporosis, King Saud University, Riyadh, KSA
4
Biomarkers Research Program, Biochemistry Department, College of Science, King Saud University, Riyadh, Kingdom of Saudi Arabia (KSA)
Full list of author information is available at the end of the article
interact with the TT genetic variant of vitamin D recep-tor [7]. Hannan and colleagues however reported no as-sociation between caffeine intake on bone metabolism [8]. There is scarcity of information with regards to tea consumption and vitamin D, although in terms of skel-etal effect, it has been reported that excessive consump-tion of brewed tea can lead to skeletal fluorosis and increased bone mineral density [9]. This study aims to determine associations between the frequency of coffee and tea consumption and serum measures of vitamin D and calcium levels in a cohort of adolescent Saudis.
Methods
In this cross-sectional study, a total of 330 (155) Saudi boys and (175) girls aged 11–14 years were randomly selected from the existing Biomarkers Screening in Riyadh Program (RIYADH Cohort), a capital-wide study com-posed of randomly selected individuals from different Pri-mary Health Care Centers (PHCCs) in Riyadh, KSA. The study was carried out at the Biomarkers Research Pro-gram (BRP), King Saud University, Riyadh, KSA. A self-administered questionnaire was given to all participating subjects containing demographic and dietary information, particularly the frequency of coffee and tea intake. No dis-tinction was made between the types of coffee (filtered, boiled, instant, pads) and between caffeinated and decaf-feinated coffee. Subjects were divided into three groups based on coffee and tea consumption: Group I included those who drank 0to 4 cups of tea or coffee weekly, group II included those who consume 5–8 cups of tea or coffee per week and group III included those who consume tea or coffee 8–12 times per week. Furthermore, the question-naire also sought information about sun exposure [fre-quency of exposure (e.g. no exposure, daily weekly) and physical activity [inactive, moderate, active], which were self reported.
Children with co-morbidities that needed immediate medical attention were excluded from the study. Written consent was obtained after orientation of the study protocol. Ethical approval was granted by the Ethics Committee of the College of Science Research Center, King Saud University, Riyadh, KSA.
Anthropometry and blood collection
Participating subjects were requested to return to their respective PHCCs after an overnight fast for anthro-pometry and blood withdrawal. Anthropometry included height (to the nearest 0.5 cm), weight (to the nearest 0.1 kg), utilizing a standardized measuring tape in cm; and BMI (calculated as kg/m2). Blood was transferred immediately to a non-heparinized tube for centrifugation. Serum was then transferred to a pre-labeled plain tube, stored in ice, and delivered to the
Biomarker Research Program in King Saud University on the same day.
Sample analyses
Fasting serum samples were stored in a −20C freezer until analysis. Fasting blood glucose, lipid profile, phos-phorus and calcium were measured using a chemical analyzer (Konelab, Vantaa, Finland). Serum 25-OH-VitD was measured by enzyme linked immunosorbent assays (ELISA) (IDS Ltd, Boldon Colliery, Tyne & Wear, UK) according to manufacturer's instruction. The inter- and intra-assay variabilities for 25-OH D ELISA were 5.3% and 4.6% respectively. All sample measurements were done in BRP, a participating laboratory for DEQAS (Vitamin D External Quality Assessment Scheme) based in UK.
Statistical analysis
Data was analyzed using the Statistical Package for the Social Sciences (SPSS for Windows version 16.5). Data are expressed as mean ± standard deviation for normally distributed parameters. Group comparisons were done using analysis of covariance (ANCOVA), adjusted for age and BMI. P-value less than 0.05 was deemed significant.
Results
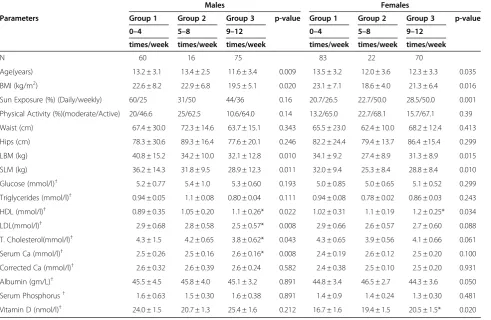
Comparisons between subjects based on coffee consump-tion are presented in Table 1. In both males and females, those consuming the most coffee cups per week were sig-nificantly younger with lower BMI, lean and soft body mass as compared to those who were drinking coffee less. In males, LDL- and HDL-cholesterol levels were highest among those consuming coffee 9–12 times week (p-values 0.022 and 0.0008 respectively) and although the same trend were observed in females, only HDL-cholesterol was significant. Circulating 25-hydroxyvitamin D levels were significantly elevated among girls consuming coffee 9–12 times per week, even after adjusting for age and BMI.
Discussion
To the best of our knowledge, there is no recorded study on the association of caffeine intake with circulating levels of 25-hydroxyvitamin D. Current evidence how-ever relate caffeine intake to calcium metabolism [10-12]. It has been demonstrated that caffeine negatively influ-ences calcium balance by reducing renal reabsorption of calcium, and possibly by reducing intestinal calcium ab-sorption efficiency. High caffeine intake may involve con-siderable renal and intestinal calcium losses [13]. Results of previous epidemiological studies have suggested a rela-tionship between high caffeine consumption and low bone mineral density (BMD) and osteoporotic fractures, which however may be offset by a high calcium intake [14,15]. Caffeine intake also reduces inositol levels in the blood. Inositol is a regulating factor in calcium metabol-ism [13], and can modestly increase calcium excretion and reduce absorption (Barrett-Connor et al., 1994). Caf-feine intake >300 mg/d (514 g, or 18 oz, brewed coffee) accelerate bone loss at the spine in elderly postmenopau-sal women [7]. Furthermore, women who harbor the TT genetic variant ofVDR appear to be at a greater risk for this deleterious effect of caffeine on bone [7]. The
polymorphisms in the VDR gene correlate with BMD, bone turnover and bone loss [16,17]. In our study, serum vitamin D level increases as coffee and tea consumption increases. Increased caffeine dose decreases VDR protein expression and alkaline phosphatase enzyme activity, a marker of osteoblast differentiation in osteoblast cells [18]. Caffeine is also metabolized in the liver via the cyto-chrome P450 oxidase enzyme system [19,20]. About a dozen metabolites can be recovered in the urine of regu-lar coffee consumers [19,21]. Methylxanthine, theophyl-line and caffeine were found to inhibit the conversion of 25 hydroxyvitamin D3, to 1,25 dihydroxyvitamin D3 in isolated renal tubules in vitamin D deficient chicks, which led to increased vitamin D circulating levels [22].
The role of caffeine as a risk factor for bone loss is controversial. Moderate coffee consumption has no ef-fect on bone health [13]. However, low calcium intake is clearly linked to skeletal fragility, and it is likely that a high caffeine intake is often a marker for low calcium in-take [11]. The negative effect of caffeine on calcium ab-sorption is small enough to be fully offset by as little as 1–2 tablespoons of milk. All of these observations impli-cating caffeine-containing beverages as a risk factor for Table 1 Comparison of male and female subjects based on coffee intake
Males Females
Parameters Group 1 Group 2 Group 3 p-value Group 1 Group 2 Group 3 p-value 0–4 5–8 9–12 0–4 5–8 9–12
times/week times/week times/week times/week times/week times/week
N 60 16 75 83 22 70
Age(years) 13.2 ± 3.1 13.4 ± 2.5 11.6 ± 3.4 0.009 13.5 ± 3.2 12.0 ± 3.6 12.3 ± 3.3 0.035 BMI (kg/m2) 22.6 ± 8.2 22.9 ± 6.8 19.5 ± 5.1 0.020 23.1 ± 7.1 18.6 ± 4.0 21.3 ± 6.4 0.016 Sun Exposure (%) (Daily/weekly) 60/25 31/50 44/36 0.16 20.7/26.5 22.7/50.0 28.5/50.0 0.001 Physical Activity (%)(moderate/Active) 20/46.6 25/62.5 10.6/64.0 0.14 13.2/65.0 22.7/68.1 15.7/67.1 0.39 Waist (cm) 67.4 ± 30.0 72.3 ± 14.6 63.7 ± 15.1 0.343 65.5 ± 23.0 62.4 ± 10.0 68.2 ± 12.4 0.413 Hips (cm) 78.3 ± 30.6 89.3 ± 16.4 77.6 ± 20.1 0.246 82.2 ± 24.4 79.4 ± 13.7 86.4 ±15.4 0.299 LBM (kg) 40.8 ± 15.2 34.2 ± 10.0 32.1 ± 12.8 0.010 34.1 ± 9.2 27.4 ± 8.9 31.3 ± 8.9 0.015 SLM (kg) 36.2 ± 14.3 31.8 ± 9.5 28.9 ± 12.3 0.011 32.0 ± 9.4 25.3 ± 8.4 28.8 ± 8.4 0.010 Glucose (mmol/l)† 5.2 ± 0.77 5.4 ± 1.0 5.3 ± 0.60 0.193 5.0 ± 0.85 5.0 ± 0.65 5.1 ± 0.52 0.299 Triglycerides (mmol/l)† 0.94 ± 0.05 1.1 ± 0.08 0.80 ± 0.04 0.111 0.94 ± 0.08 0.78 ± 0.02 0.86 ± 0.03 0.243 HDL (mmol/l)† 0.89 ± 0.35 1.05 ± 0.20 1.1 ± 0.26* 0.022 1.02 ± 0.31 1.1 ± 0.19 1.2 ± 0.25* 0.034 LDL(mmol/l)† 2.9 ± 0.68 2.8 ± 0.58 2.5 ± 0.57* 0.008 2.9 ± 0.66 2.6 ± 0.57 2.7 ± 0.60 0.088 T. Cholesterol(mmol/l)† 4.3 ± 1.5 4.2 ± 0.65 3.8 ± 0.62* 0.043 4.3 ± 0.65 3.9 ± 0.56 4.1 ± 0.66 0.061 Serum Ca (mmol/l)† 2.5 ± 0.26 2.5 ± 0.16 2.6 ± 0.16* 0.008 2.4 ± 0.19 2.6 ± 0.12 2.5 ± 0.20 0.100 Corrected Ca (mmol/l)† 2.6 ± 0.32 2.6 ± 0.39 2.6 ± 0.24 0.582 2.4 ± 0.38 2.5 ± 0.10 2.5 ± 0.20 0.931 Albumin (gm/L)† 45.5 ± 4.5 45.8 ± 4.0 45.1 ± 3.2 0.891 44.8 ± 3.4 46.5 ± 2.7 44.3 ± 3.6 0.050 Serum Phosphorus† 1.6 ± 0.63 1.5 ± 0.30 1.6 ± 0.38 0.891 1.4 ± 0.9 1.4 ± 0.24 1.3 ± 0.30 0.481 Vitamin D (nmol/l)† 24.0 ± 1.5 20.7 ± 1.3 25.4 ± 1.6 0.212 16.7 ± 1.6 19.4 ± 1.5 20.5 ± 1.5* 0.020
Data represented by Mean ± standard deviation;
osteoporosis have been made in populations consuming substantially less than optimal calcium intakes [11].
Another factor that may contribute to higher vitamin D in the heavy drinkers is the weight reducing effect of coffee. In our study BMI mean value was significantly decreased in heavy drinkers when compared to low and moderate drinkers (mean of BMI =20 ± 5.8 kg/m2, P < 0.05). Both sexes showed a decrease in BMI (appen-dix). In a study done by Jorde et al. (2001), both gender's serum calcium showed a positive association with body mass index (BMI) and coffee consumption that persisted after correcting for other variables in a multiple regres-sion model (P < 0.05) [23].
Coffee intake should reduce BMI because coffee con-sumption decreases the amount of fat tissue by elevating thermogenesis [24-26] and stimulating the sympathoa-drenal system [27]. Aside from caffeine's ability to in-crease fat oxidation and lipolysis [28-30], there is a weak but significant positive association with BMI for coffee intake in both sexes [30]. Coffee may reduce body weight through lipolysis stimulation [27]. Fat loss from
adipose tissue is hypothesized to be accompanied by vitamin D withdrawal from its fat store leading to ele-vated serum vitamin D levels. Studies on weight reduc-tion show that serum 25(OH)D levels rise when obese individuals lose body fat [31-33].
There is consistent epidemiological evidence that con-sumption of these hot beverages is associated with a reduced risk of diabetes mellitus type 2 (DMT2) and coronary heart disease [34-36]. It has been hypothesized that the protective effect of coffee and tea consumption on DMT2 risk is mediated by a reduction in obesity [37]. This hypothesis is supported by a handful of clin-ical intervention studies which report that the frequency of coffee or tea consumption is related to weight loss and change in body fat distribution [37,38].
The study has limitations. Comprehensive data on out-door physical activity and diet were lacking, and these can be considered major confounders that affect circu-lating vitamin D levels. The type of coffee and tea were also not taken into consideration. Nevertheless, the number of subjects involved increases the reliability of Table 2 Comparison of male and female subjects based on tea intake
Tea Intake
Male Female
Parameters Group 1 Group 2 Group 3 p-value Group 1 Group 2 Group 3 p-value 0–4 5–8 9–12 0–4 5–8 9–12
times/week times/week times/week times/week times/week times/week
N 96 23 36 105 17 53
Age(years) 12.7 ± 3.3 12.5 ± 3.2 11.7 ± 3.5 0.274 13.0 ± 3.4 12.5 ± 3.4 12.7 ± 3.2 0.808 BMI (kg/m2) 21.1 ± 6.6 23.7 ± 8.0 19.9 ± 6.7 0.177 22.1 ± 6.2 21.2 ± 3.6 21.5 ± 8.0 0.763 Sun Exposure (%) (Daily/weekly) 54/29.1 30.4/30.4 38.8/47.2 0.17 19.0/34.2 23.5/47.0 22.6/41.5 0.06 Physical Activity
(%)(moderate/Active)
21.0/51.0 13.0/60.8 11.0/63.8 0.04 16.1/64.7 17.6/76.4 15.1/67.9 0.91
Waist (cm) 65.5 ± 23.6 69.2 ± 24.6 65.7 ± 17.6 0.816 64.2 ± 18.0 67.8 ± 8.8 69.9 ± 18.4 0.177 Hips (cm) 77.4 ± 25.4 83.8 ± 25.9 80.7 ± 22.6 0.555 81.0 ± 22.0 86.8 ± 8.2 87.7 ± 18.1 0.138 LBM (kg) 35.7 ± 13.6 36.7 ± 13.8 33.5 ± 14.8 0.672 32.4 ± 9.7 32.2 ± 6.2 31.6 ± 9.3 0.913 SLM (kg) 32.5 ± 12.9 34.2 ± 13.1 29.9 ± 14.1 0.510 30.4 ± 9.8 29.8 ± 5.8 29.1 ± 8.9 0.738 Glucose (mmol/l)† 5.2 ± 0.81 5.3 ± 0.38 5.3 ± 0.69 0.904 4.9 ± 0.78 5.0 ± 0.72 5.2 ± 0.51 0.160 TG (mmol/l)† 0.90 ± 0.05 1.1 ± 0.07 0.78 ± 0.04 0.062 0.87 ± 0.04 0.99 ± 0.12 0.90 ± 0.04 0.600 HDL (mmol/l)† 1.0 ± 0.34 1.0 ± 0.22 1.01 ± 0.23 0.959 1.0 ± 0.29 1.2 ± 0.23* 1.1 ± 0.24* 0.003 LDL(mmol/l)† 2.8 ± 0.61 2.6 ± 0.63 2.4 ± 0.65* 0.042 2.9 ± 0.64 2.7 ± 0.37 2.7 ± 0.68 0.274 Total Cholesterol(mmol/l)† 4.2 ± 1.2 3.9 ± 0.67 3.8 ± 0.70 0.111 4.2 ± 0.66 4.1 ± 0.40 4.0 ± 0.71 0.667 Serum Ca (mmol/l)† 2.5 ± 0.24 2.6 ± 0.21 2.6 ± 0.20 0.322 2.5 ± 0.20 2.4 ± 0.18 2.6 ± 0.23 0.184 Corrected Ca (mmol/l)† 2.6 ± 0.34 2.4 ± 0.20 2.5 ± 0.23 0.132 2.5 ± 0.33 2.5 ± 0.21 2.5 ± 0.17 0.972 Albumin (gm/L)† 45.7 ± 3.9 45.7 ± 4.4 44.6 ± 3.2 0.427 44.8 ± 3.9 44.6 ± 2.7 44.6 ± 2.9 0.936 Serum Phosphorus† 1.6 ± 0.56 1.5 ± 0.31 1.5 ± 0.25 0.741 1.4 ± 0.9 1.3 ± 0.2 1.4 ± 0.30 0.802 Vitamin D (nmol/l)† 22.5 ± 1.5 23.5 ± 1.4 30.0 ± 1.5* 0.003 17.4 ± 1.6 17.2 ± 1.4 21.2 ± 1.5* 0.031
Data represented by Mean ± standard deviation;
Analysis of Variance (ANOVA) is done across different tea drinkers.
our results, which shows for the first time a dose-dependent relationship between circulating vitamin D levels in relation to coffee and tea consumption among Saudi adolescents, even after adjustment for physical ac-tivity, sun exposure, gender, age and BMI.
In summary, the study suggests that increased coffee and tea consumption elevates circulating vitamin D levels among Saudi Arab adolescents independent of physical activity, sun exposure, age, gender and BMI. Further studies are needed to confirm these findings as assessment of the health risks and benefits of coffee and tea consumption requires reliable data that can accur-ately for studying relationships between coffee and tea consumption and health-related endpoints.
Competing interests
The authors declare that they have no competing interests
Authors’contributions
AA, SA and NMA conceived and carried out the study. KMA, YA, OSA and MSA participated in the design, subject recruitments and data collection. OM and SY carried out sample analysis. SA, SS, SK and GPC performed statistical analysis and drafted the final version of the manuscript. All authors approved and read the final manuscript.
Acknowledgments
The authors wish to thank Mr. Benjamin Vinodson for the statistical analyses of the data.
Author details
1Prince Mutaib Chair for Biomarkers of Osteoporosis, King Saud University,
Riyadh, KSA.2College of Applied Medical Sciences, King Saud University, Riyadh, KSA.3College of Science, King Saud University Women's Section,
Riyadh, KSA.4Biomarkers Research Program, Biochemistry Department,
College of Science, King Saud University, Riyadh, Kingdom of Saudi Arabia (KSA).5Center of Excellence in Biotechnology Research, King Saud University,
Riyadh, KSA.6Clinical Pharmacy Department, College of Pharmacy, King Saud University, Riyadh, KSA.7College of Medicine, King Saud University of Health
Sciences, Riyadh, KSA.8King Abdulaziz University Hospital, King Saud University, Riyadh, KSA.9Clinical Sciences Research Institute, Diabetes and
Metabolism Unit, Warwick University, Coventry CV47AL, UK.10First Department of Pediatrics, Athens University Medical School, Athens 11527, Greece.11Prince Mutaib Bin Abdullah Chair for Osteoporosis, Biochemistry Department, College of Science, King Saud University, PO Box, 2455, Riyadh 11451, Kingdom of Saudi Arabia.
Received: 3 January 2012 Accepted: 11 August 2012 Published: 20 August 2012
References
1. Food and Agricultural Organization:Food balance sheets. http://www.fao. org.
2. Butt MS, Sultan MT:Coffee and its consumption: Benefits and risks.Crit Rev Food Sci Nutr2011,51:363–373.
3. Spiller MA:The chemical components of coffee. InCaffeine. Boca Raton: CRC Press; 1998:97–161.
4. Castellanos FX, Rapoport JL:Effects of caffeine on development and behavior in infancy and childhood: a review of the published literature.
Food Chem Toxicol2002,40:1235–1242.
5. HealthCanada:Fact Sheet Caffeine and Your Health.2003. http://www.hc-sc. gc.ca/foodaliment/dg/ecaffeine.html.
6. Hasling C, Sondergaard K, Charles P, Mosekilde L:Calcium metabolism in postmenopausal osteoporotic women is determined by dietary calcium and coffee intake.J Nutr1992,122:1119–1126.
7. Rapuri PB, Gallagher JC, Kinyamu HK, Ryschon KL:Caffeine intake increases the rate of bone loss in elderly women and interacts with vitamin D receptor genotypes.Am J Clin Nutr2001,74:694–700.
8. Hannan MT, Felson DT, Dawson-Hughes B, Tucker TL, Cupples LA, Wilson PW, Kiel DP:Risk factors for longitudinal bone loss in elderly men and women: the Framingham Osteoporosis Study.J Bone Miner Res2000, 15:710–720.
9. Izuora K, Twombly JG, Whitford GM, Demertzis J, Pacifici R, Whyte MP: Skeletal fluorosis from brewed tea.J Clin Endocrinol Metab2011,96:2318– 2324.
10. Heaney RP:Bone mass, nutrition, and other lifestyle factors.Nutr Rev 1996,54:S3–10.
11. Heaney RP:Effects of caffeine on bone and the calcium economy.Food Chem Toxicol2002,40:1263–1270.
12. Heaney RP, Recker RR:Effects of nitrogen, phosphorus, and caffeine on calcium balance in women.J Lab Clin Med1982,99:46–55.
13. Massey LK, Whitling SJ:Caffeine, urinary calcium, calcium metabolism and bone.J Nutr1993,123:1611–1614.
14. Kreiger N, Gross A, Hunter G:Dietary factors and fracture in postmenopausal women: a case–control study.Int J Epidemiol1992, 21:953–958.
15. Huopio J, Kroger H, Honkanen R, Saarikoski S, Alhava E:Risk factors for perimenopausal fractures: a prospective study.Osteoporos Int2000, 11:219–227.
16. Gong G, Stern HS, Cheng SC, Fong N, Mordeson J, Deng HW, Recker RR: The association of bone mineral density with vitamin D receptor gene polymorphisms.Osteoporos Int1999,9:55–84.
17. Woods RJ, Fleet JC:The genetics of osteoporosis: vitamin D receptor polymorphisms.Annu Rev Nutr1998,18:233–258.
18. Rapuri PB, Gallagher JC, Nawaz Z:Caffeine decreases vitamin D receptor protein expression and 1,25(OH)2D3 stimulated alkaline phosphatase activity in human osteoblast cells.J Steroid Biochem Mol Biol2007, 103:368–371.
19. Barone JJ, Roberts HR:Caffeine consumption.Food Chem Toxicol1996, 34:119–129.
20. Gates S, Miners JO:Cytochrome P450 isoform selectivity in human hepatic theobromine metabolism.Br J Clin Pharmacol1999,47:299–305. 21. Ullrich D, Compagnone D, Munch B, Brandes A, Hille H, Bircher J:Urinary
caffeine metabolites in man. Age-dependent changes and pattern in various clinical situations.Eur J Clin Pharmacol1992,43:167–172.
22. Taft JL, French M, Danks JA, Larkins RG:Opposing actions of
methylxanthines and dibutyryl cyclic AMP on 1,25 dihydroxyvitamin D3 production and calcium fluxes in isolated chick renal tubules.Biochem Biphys Res Commun1984,121:355–363.
23. Jorde R, Sundsfjord J, Bonaa KH:Determinants of serum calcium in men and women. The Tromso Study.Eur J Epidemiol2001,17:1117–1123. 24. Tagliabue A, Terracina D, Cena H, Turconi G, Lanzola E, Montomolli C: Coffee induced thermogenesis and skin temperature.Int J Obes Relat Metab Disord1994,18:537–541.
25. Dulloo AG, Geissler CA, Horton T, Collins A, Miller DS:Normal caffeine consumption: influence on thermogenesis and daily energy expenditure in lean and postobese human volunteers.Am J Clin Nutr1989,49:44–50. 26. Graham TE:Caffeine and exercise: metabolism, endurance and
performance.Sports Med2001,31:785–807.
27. Astrup A:Thermogenic drugs as a strategy for treatment of obesity.
Endocrine2000,13:207–212.
28. Ryu S, Choi SK, Joung SS, Suh H, Cha YS, Lee S, Lim K:Caffeine and lipolytic food component increases endurance performance in rats and athletes.J Nutr Sci Vitaminol2001,47:139–146.
29. Keijzers GB, De Galan BE, Tack CJ, Smits P:Caffeine can decrease insulin sensitivity in humans.Diabetes Care2002,25:364–369.
30. Kamycheva E, Joakimsen RM, Jorde R:Intakes of calcium and vitmin D predict body mass index in the population of Northern Norway.J Nutr 2003,133:102–106.
31. Riedt CS, Cifuentes M, Stahl T, Chowdhury HA, Schlussel Y, Shapses SA: Overweight postmenopausal women lose bone with moderate weight reduction and 1 g/day calcium intake.J Bone Miner Res2005,20:455–463. 32. Tzotas T, Papadopoulou FG, Tsiomaoos K, Karras S, Gastaris K, Perros P,
Krassas GE:Rising serum 25-hydroxy-vitamin D levels after weight loss in obese women correlate with improvement in insulin resistance.J Clin Endocrinol Metab2010,95:4251–4257.
33. Zittermann A, Frisch S, Berthold HK, Gotting C, Kuhn J, Kleesiek K, Stehle P, Koertke H, Koerfer R:Vitamin D supplementation enhances the beneficial effects of weight loss on cardiovascular disease risk markers.Am J Clin Nutr2009,89:1321–1327.
34. Higdon JV, Frei B:Coffee and health: a review of recent human research.
Crit Rev Food Sci Nutr2006,46:101–123.
35. Schneider C, Serge T:Green tea: potential health benefits.Am Fam Physician2009,79:591–594.
36. Greenberg JA, Axen KV, Schnoll R, Boozer CN:Coffee, tea and diabetes: the role of weight loss and caffeine.Int J Obes (Lond)2005,29:1121–1129. 37. He RR, Chen L, Lin BH, Matsui Y, Yao XS, Kurihara H:Beneficial effects of
oolong tea consumption on diet-induced overweight and obese subjects.Chin J Integr Med2009,15:34–41.
38. Thom E:The effect of chlorogenic acid enriched coffee on glucose absorption in healthy volunteers and its effect on body mass when used long-term in overweight and obese people.J Int Med Res2007, 35:900–908.
doi:10.1186/1475-2891-11-56
Cite this article as:Al-Othmanet al.:Tea and coffee consumption in relation to vitamin D and calcium levels in Saudi adolescents.Nutrition Journal201211:56.
Submit your next manuscript to BioMed Central and take full advantage of:
• Convenient online submission
• Thorough peer review
• No space constraints or color figure charges
• Immediate publication on acceptance
• Inclusion in PubMed, CAS, Scopus and Google Scholar
• Research which is freely available for redistribution