DOI 10.1007/s13174-011-0037-8 S I : C L O U D C O M P U T I N G
Placement of applications in computing clouds using Voronoi
diagrams
Caroline Shouraboura·Pavel Bleher
Received: 23 October 2010 / Accepted: 5 September 2011 / Published online: 23 September 2011 © The Brazilian Computer Society 2011
Abstract The vision of millions of users launching tens of millions of applications running on millions of glob-ally scattered servers presents a new challenge for Cloud Providers: how to assign so many virtual applications to physical servers, while meeting latency needs, improving network utilization, and satisfying availability constraints. Today’s application placement puts too much burden on the cloud user, lacks scalability and inhibits the global reach of Public Clouds.
The size, breadth, and dynamic nature of Public Clouds present a special challenge to the task of placement. Cloud Providers able to provide rapid decisions and frequent op-timizations for placement will have significant competitive advantage. Not only will they provide the best customer ex-perience, their costs will be lower as they make more effi-cient use of their network resources. However, given the cal-culations required, data structures and the algorithms used to process location-based decisions must be as globally scal-able as the Public Clouds themselves.
In our study, we define a novel data structure, the Vir-tual Cloud Model, for modeling global cloud resources. We adapt a well-known geometric device, Voronoi Diagrams, and combine it with near-real-time network latency infor-mation. We then solve the application placement problem and suggest an API for Cloud Providers to support both “low-latency” and “high-availability” applications. The al-gorithms are scalable, parallelizable and distributable.
C. Shouraboura
Forest Ridge, 9927 171st Ave SE, Newcastle, WA 98059, USA e-mail:[email protected]
P. Bleher (
)Indiana University-Purdue University Indianapolis, 402 N. Blackford Street, Indianapolis, IN 46202, USA
e-mail:[email protected]
Keywords Cloud computing·Application placement· Virtual cloud model·Voronoi diagram
1 Introduction
The vision for Cloud Computing is to have millions of users launching tens of millions of applications running on mil-lions of globally scattered servers. This presents a new chal-lenge for Cloud Providers, which requires new data struc-tures and scalable algorithms for placing and managing user applications.
Behind the Public Cloud is a physical network of data centers with millions of servers, hidden from us through vir-tualization. Virtualization offers Public Cloud providers the flexibility to assign each application to run on any of its available physical servers. The primary variables in decid-ing placement of an application within the Public Cloud are (1) minimizing latency (and therefore bandwidth consump-tion) of the compute resource with respect to points on the network with which it must communicate (other compute resources, persistence layers, and endpoints outside of the cloud are a few examples) and (2) availability constraints specifying a minimum separation compute resources must have from other resources to avoid correlated failure.
underlying application architectures and assumptions about data locality, both the Volley approach described in [1] and the approach we describe here should be useful for those building cloud applications and providing cloud infrastruc-ture. A data-oriented approach to placement can and should coexist with an application-oriented approach.
In this paper we choose latency as the driving variable be-cause it is a characteristic of the physical layout of the cloud, dictated by such things as speed of light, network device limitations, and the network cabling connecting compute re-sources. Bandwidth is a parallel variable, but is generally highly correlated with latency [25]. We discuss a case where bandwidth is an independent constraint in the Future Work section. In practice cloud providers face many more restric-tions such as capacity and cost of system resources, cost of relocating Virtual Machines (VMs) to remote sites, disas-ter recovery, committed vs. uncommitted quality of service, and others. In this paper we propose two extensions to our algorithm for applying geography and capacity constraints.
Traditional techniques for managing application pla-cement lack the scalability required by Public Clouds [16,
32]. A large-scale private data center might contain tens of thousands of servers running well-understood applications statically allocated to servers. Even if the private data cen-ter is virtualized, the numbers of servers involved and the slow rates of change limit issues of scale. Public Clouds to-day are rapidly growing to, and beyond, millions of servers scattered across different countries and continents, running dynamically changing application mixes. Many applications automatically scale up by requesting more resources from the Cloud and then scale down by releasing resources, as demand subsides. Frequently, applications must communi-cate with each other, whether for synchronizing game state, exchanging intermediate computational results, assembling web pages, or querying databases. The network in a Public Cloud supplies substantial network bandwidth in support of cross-application communication.
For a group of applications requiring communication with each other, placement proximity on the underlying physical servers is critical. Cloud Providers have a strong incentive to keep communication paths as short as possible, because the cost of provisioning bandwidth increases with distance. Latency also increases significantly with distance, so customers of a Cloud receive a better experience with shorter network paths. In order to find two or more servers which are “close” to each other, it would seem necessary to examine the latencies between all pairs of servers in the Cloud to compute an optimal placement. The calculation of latencies must be executed frequently given the network is a shared resource and is therefore subject to regular changes in performance. This would mean a running time ofO(n2), wherenis the number of servers in the cloud. Public Clouds might have millions of servers running tens of millions of
applications owned by different companies and individuals. This kind of scale requires a high-performance algorithm capable of running in near-real time.
In this paper we describe a viable model of the Cloud precomputed inO(nlogn)time and a scalableO(k+logn) algorithm to solve the application placement problem, where kis the number of servers required by the application andn is the number of servers in the Cloud. The model is based on Voronoi Diagrams.
2 Voronoi diagrams
In this paper we use a 2-dimensional Voronoi Diagram com-puted for a set ofnpoints on a plane. It is defined as follows.
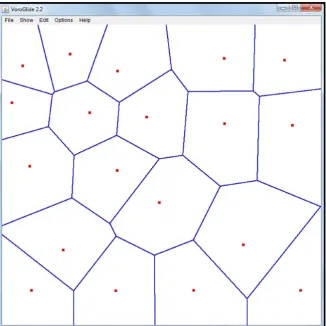
Definition 1 The set of all points closer to a given point in a point set than to all other points in the set is the Voronoi Polygon for the point. The collection of all the Voronoi Poly-gons for a point set is called its Voronoi Diagram.
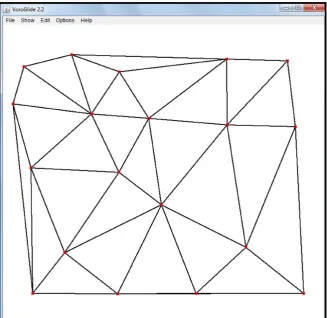
The dual graph to the Voronoi Diagram (Fig.1) is a De-launay Triangulation (Fig.2). By definition, the Delaunay Triangulation contains an edge connecting two points if and only if their Voronoi regions share a common edge. The De-launay Triangulation DT(P)for a set P of points in the plane possesses a remarkable property such that no point inP is inside the circumcircle of any triangle in DT(P). This property characterizes a DT uniquely [29]. Shamos and Hoey [31] described a divide-and-conquer algorithm to compute the Voronoi Diagram in O(nlogn) time. Subse-quently, many other usable and efficient algorithms and data structures were discovered [2] and implemented for com-puting Voronoi Diagrams [3,4,10,13,24,27]. Voronoi Di-agrams found their application in many different fields, in-cluding computer science [3,4,12,24,26,27].
Fig. 1 An example of a Voronoi diagram
3 Virtual cloud model (VCM)
To reduce the network congestion and latency in communi-cation between applicommuni-cations, we would like to position con-nected applications “close” to each other. Several properties of Voronoi Diagrams make it a relevant and appealing struc-ture for Cloud partitioning: the linear size of the Voronoi agram, the proximity information stored in the Voronoi Di-agram in an explicit and computationally useful manner and its localized and easily distributable behaviors. This allows us to store and perform operations on Voronoi Diagrams locally, utilizing the distributed computing Cloud environ-ment.
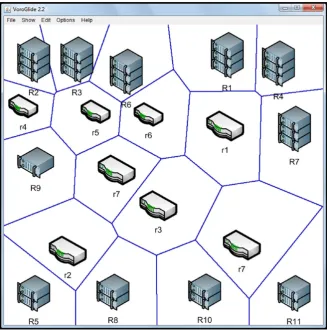
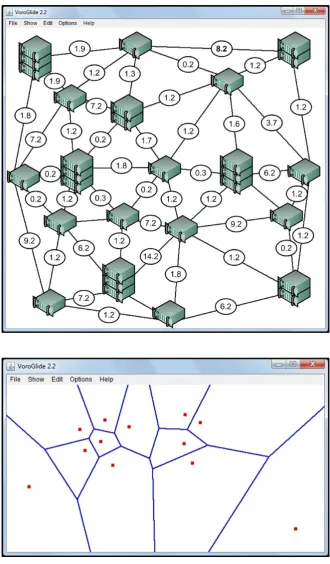
Let{R}be a set of all server racks and{r}be a set of all routers, switches, load balancers, and other traffic related network devices in the cloud (Fig.3). The main objects of our model are server racks, but we are also going to include other devices to reflect the actual physical network. Let{D} be the union of{R}and{r}, representing all relevant devices in the Cloud. Let us assume that each device has an IP ad-dress, which is uniquely mapped to its geographic location using the functionLocat ion(D). The geographic location of a given device is a good approximation of its network “closeness” to other devices. To best economize cost and la-tency, Cloud Providers keep physical cabling and network
distances at a minimum, making physical location a reason-able first-order approximation of network closeness.
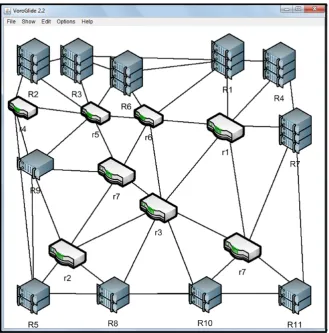
For each deviceD we call functionLocat ion(D)and establish a set of points on the plane, representing geo-graphical coordinates of all server racks and routers on the network. We then perform Voronoi tessellation (Fig.4) on the points and obtain a Geographic Delaunay Triangu-lation (Fig. 5) using VoroGlide software [34]. While the VoroGlide algorithm was sufficient for our study, a paral-lel algorithm described in [21] could be better suited for the distributed architecture of the Cloud. We use the precom-puted Geographic Delaunay Triangulation as the foundation for building a VCM. We still need to address two important challenges of modeling the Cloud: first, network traffic be-tween servers is routed inconsistently with respect to phys-ical geography due to network engineering factors such as distances of cabling/fiber runs, over-subscription of band-width between switches and routers, and routing weights for cost and redundancy; and second, the “distances” effectively change as networks become more or less congested.
Fig. 2 Dual Delaunay triangulation
of our precomputed Geographic Delaunay Triangulation. It is important to note that the number of edges in Delaunay Triangulation is O(n). For every edge we capture its la-tency, defined as the time it takes for a packet of informa-tion to travel between its vertices in milliseconds. A variety of network monitoring tools could be used to perform this task. A Cloud Provider with access to the physical devices would simply be able to run the probe from each of its de-vices directly. We then assign weightwl to every edge of
Geographic Delaunay Triangulation equal to the network la-tency of the edge. The resulting structure is theVirtual Cloud Model (VCM), which we are going to use next for appli-cation placement. Note that this diagram is not a physical representation of how network packets move across the net-work; rather it reflects the relative latency servers have with respect to each other.
For scaled up implementation, VCM could be distributed and the weight of edges could be dynamically updated as the latency of the network changes due to congestion. Using VCM, we can now define the “distance” between devices in the network.
Definition 2 The distance between deviceD1and deviceD2 in the VCM is the sum of weights of all edges on the shortest path betweenD1andD2.
Fig. 3 An example of racks and routers in the cloud
Fig. 4 Geographic Voronoi diagram
the impact of these devices on the performance of the net-work. Based on this, we decided to use a simplified model, which excludes routers, switches, load balancers and other traffic related network devices.
In our simplified Virtual Cloud Model we only consider server racks, and we perform the Voronoi tessellation for the set {R}of all server racks and we obtain a Geographic Delaunay Triangulation for the set{R}. The algorithm per-forms in O(nlogn) time and requires O(n) space [10], wherenis the number of server racks. We capture the weight of each edge as a latency of each edge of Delaunay Triangu-lation for{R}(Fig.6).
The well-explored algorithmic space of Delaunay Trian-gulation provides us with readily available methods for effi-ciently dealing with changes in resource capacity and loca-tion, such as rack addition or failure. Methods for efficiently recalculating only a local portion of the triangulation are de-scribed in [15]. Paper [19] also describes algorithms for dis-tributing a Delaunauy Triangulation across many separate computers.
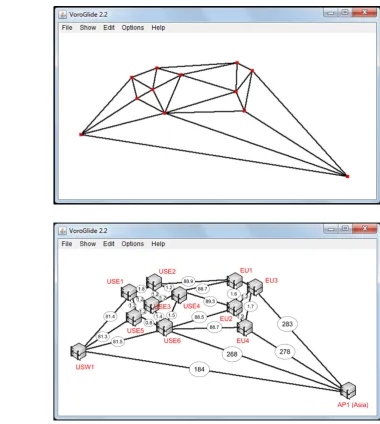
To illustrate VCM using a very small subset of a real-life Cloud, we selected 12 servers on Amazon’s Cloud in 12 different locations: four servers in Europe running in differ-ent locations, one server in Asia, in Singapore, one server
on the US West Coast in San Francisco, and six servers on the US East Coast in different locations. We then es-timated server locations based on the region information, provided by Amazon, and constructed Geographic Voronoi Diagram for 12 servers shown by points in Fig.7and corre-sponding Geographic Delaunay Triangulation (Fig.8) using VoroGlide software [34].
We then used “ping” to dynamically capture the actual network latency between server racks for every edge of Ge-ographic Delaunay Diagram. Ping is a computer network utility used to measure the round-trip time for packets sent from the local host to a destination computer in milliseconds (ms). We constructed the VCM for 12 servers as an illustra-tion for our model. For every edge of the Delaunay Triangu-lation we assigned the weightwlequal to the average
Fig. 5 Geographic Delaunay triangulation
that for a given a set of sites on a sphere, their spherical Voronoi Diagram can be derived by computing two planar Voronoi Diagrams of suitably transformed sites in the plane.
4 Placing applications in the cloud using VCM
When a user launches an application in the Cloud, the user first defines a virtual machine image specifying the software that will be run upon startup. The user then requests a single or multiple virtual machines from the Cloud via an API call. The Cloud Provider allocates a set {Vj} of requested
vir-tual machines and then launches a copy of user-defined soft-ware image on each virtual machine, thus providing the user with a set of running “instances”. Typically there are many instances running simultaneously to provide scalability of an application. For example, in an online gaming applica-tion a virtual “world” will be hosted on many instances of the game’s application. This is important because no single server could possibly have enough capacity to serve all users of the game. Each user will be assigned to a particular virtual machine instance. Instances will communicate state infor-mation with each other in order to keep the “world” consis-tent in appearance to all participants. When a user launches
an application, the number of instances required is specified as an API parameter. These instances can be placed any-where in the cloud, however, some locations are better than others stemming from application requirements. For exam-ple:
1. If an application requires a frequent communication with computers outside the cloud, it is better to place applica-tion instances close to user’s anchor locaapplica-tionU.
2. If an application requires frequent communication among instances, it is important to place those instances close to each other to reduce latency in communication and avoid performance degradation. In those cases the proximity of application placement would also benefit the cloud provider by reducing the consumption of network re-sources.
Fig. 6 An example of simplified virtual cloud model with weights
Fig. 7 Geographic Voronoi diagram for 12 servers
under those scenarios, it might be desirable to space the application across remote servers to increase availability at the price of latency.
Given the variety of application placement requirements, the Cloud Provider could offer customers an API to specify
the desired application placement strategy. The conceptual API for a launch request ofkinstances could look like:
Launch(k:number,
Fig. 8 Dual geographic Delaunay triangulation
Fig. 9 An illustration: VCM for 12 servers
We propose to use VCM for the implementation of different placement strategies.
4.1 Latency constraint
The following algorithm uses VCM to place instances close to a user’s location and to each other. Let us assume that a user defined a desired software imageI and requestedk in-stances running the imageI, launched in proximity to his lo-cationU. We first use the VCM to find the triangle with three server racks as vertices containingU. There are several well-known algorithms to perform this search in O(logn)time (see [9] and references therein). Once we found the triangle containingU, we consider its three vertices and server racks associated with them and select the server rack Ri closest
toU.
We then allocate virtual machines onRi to run user
ap-plications until we exhaust the capacity ofRi.
Capacity can be measured and optimized in a number of ways here, the variety of which is discussed in the Future Work section below. For the purposes of this algorithm, we assume that the virtual machine we are placing has an ap-plication capacity which can be compared to the capacity available onRi. We then perform a breadth-first search of
VCM graph to find required capacity, looking for the clos-est servers toRi. This placement algorithm reduces latency
and bandwidth consumption, for a given application, placing parts of the application on neighboring servers by traversing the VCM and taking into the account actual, near-real-time network latency.
1. Put all neighbors ofRi in a list.
2. Examine all server racks in the list and select the server rack Rj closest to Ri using the definition of the
3. If Rj has available capacity then allocate available
ca-pacity ofRj to our application.
4. Add all neighbors ofRjto the list.
5. RemoveRjfrom the list.
6. Repeat steps 2–5 until we find requested capacity to launchkinstances to run the application.
The algorithm performs in O(k+logn)time. We first find the closest server rack to user locationU inO(logn) time and then we traverse the VCM to place k instances in O(k) time. Here we make an assumption that the de-gree of each vertex in the VCM graph is bounded by a con-stant independent ofn. This assumption looks plausible but it requires an additional verification in concrete Comput-ing Clouds. In the Poisson-Voronoi probabilistic model, in which the sites are random points from a standard Poisson process on the plane (see, e.g., the paper [11] of Hinde and Miles and the monograph [22] of Møller), there are various theoretical and numerical results supporting the assumption. As shown in the classical paper [20] of Meijering, the mathe-matical expectation of the numberNof the site neighbors in the Poisson–Voronoi model is equal to 6. Calka [6] derives an exact formula for the probabilitypkthatN=kas a
com-plicated 2k-dimensional integral, but as the author remarks himself, the integral is very difficult for an asymptotic anal-ysis ask→ ∞. Numerical results of Tanemura [33], Brakke [5], and others, strongly indicate that pk decay
exponen-tially ask→ ∞, andpk is well approximated by a
gener-alized gamma distribution. Therefore, the estimateO(k)for the time to placekinstances in the Poisson–Voronoi model looks very reasonable.
4.2 Availability constraint
For applications wishing to minimize latency, the aforemen-tioned algorithm alone may be applied. However, minimiz-ing network distance typically increases the probability of correlated failure. For example, two virtual machines placed on the same physical machine have extremely low latency but obvious correlated failure cases. The same virtual ma-chines placed on different physical servers in the same rack still typically depend on a common network switch and power path. While power and network redundancy can be implemented within servers and racks at increased expense, even separation of virtual machines across racks within a data facility leaves exposure to correlated failure due to un-expected events. Examples include room cooling malfunc-tion, failure of automatic power transfer switches, unantic-ipated ground faults, and network route misconfiguration. Different application architectures require different trade-offs between latency and availability. High-performance computing applications bias entirely toward latency and will generally desire placement within the same rack. Mission-critical business applications or backup solutions may re-quire geographic separation. VCM offers a good structure to
support availability requirements. For “availability” place-ment we assume that all edge weightswl are equal to one,
because we want to spread instances regardless of the lat-est network conglat-estion. This means that the “distance” be-tween server racks is simply the number of edges on the shortest path on VCM graph. Similar to the previous algo-rithm, we consider the customer’s locationU and the cor-responding triangle on VCM containing U. We then pick one of the server racks associated with that triangle, but in-stead of exhausting its capacity, we place only one instance on it. We then do a breadth-first search to spread instances (Fig. 10). We start with the first server and then allocate the next server by jumping over two (or more) Delaunay edges to ensure that there is some distance between the parts of an application. If we would like to guarantee that parts of an application are going to be placed preciselypcells away from each other, we could also compute the “pth nearest point” Voronoi Diagram—another extension of the Voronoi Diagram described in [24].
5 Geography, capacity, and other business constraints
In its simplest form, a placement algorithm makes a binary decision based on whether a particular target for placement has the desired capacity. There are many reasons why cloud providers would want to modify this approach. Some targets might be in lower cost locations, managing power efficiency is one example [18]. Supply could be constrained in a par-ticular location, causing the cloud provider to want to bias placements toward adjacent locations. The cloud provider may wish to reserve capacity in a particular geography for customers either willing to pay more or willing to make a long term commitment to use that capacity. Also, a bin-packing algorithm could be applied to a collection of physi-cal capacity to ensure that un-utilized “bubbles” do not form within the cloud. Finally, the cloud provider may wish to gradually drain capacity from a rack of servers, for example, to return at end of a lease or refresh with new technology.
VCM and application placement algorithms could be ex-tended to satisfy those additional business requirements. Be-low are two examples of such algorithmic extensions.
Fig. 10 Availability placement algorithm
effectively scatters instances to at leastN Delaunay edges apart, stricter guarantees about either distance separation or location within a political boundary could require a more exact geographic constraint. Because the VCM encodes ge-ographic location in a computationally accessible manner, an efficient addition to the placement algorithm is enabled. Instead of a general “separation” parameter, the API out-lined above could include a “distance-separation” or “ju-risdiction” parameter. The enhanced separation parameter would specify a minimum distance betweenV Ms activated. Instead of skipping edges for spread, as detailed previously in Fig.10, we continue the breadth-first search to identify the next placement candidate vertex. We calculate the distance between each prior placement vertex and the candidate. If the distance satisfies the separation constraint, we place the VM, otherwise we continue the breadth-first search.
Strict guarantees on geographic placement can also be satisfied using the VCM. The Cloud Provider could define Jurisdictions across the VCM and use this information to exclude candidate placement vertices which do not meet the Jurisdiction constraint.
Example 2(Satisfying Capacity Constraints) Cloud provid-ers need the ability to weight placement decisions to steer capacity utilization based on the factors described above.
We are using the term “capacity” to subsume the available quantity of a range of resources that applications may re-quire from a VM. Network I/O, CPU, Disk I/O, disk space, and memory are the most important of these though there are also special resources, such as the existence of a GPU or other special processing unit. Cloud Providers, today, are trending toward providing these in fixed ratios per VM. Al-lowing applications variability in their use of resources cre-ates the potential for one application to impact the perfor-mance of another by increasing its consumption to a point of competition. Variability also makes bin-packing on physical servers far more difficult. For the purposes of our placement algorithm, however, we only suggest that the cloud provider encapsulate all of the applications’ various resource needs in a single function, encapsulate the available capacity on a physical server in a similar single function, and then com-pare the two for placement.
commu-nication of capacity utilization across the cloud. Each server, gossiping its current capacity as well as re-gossiping infor-mation on other servers it has heard about, becomes aware of the general state of capacity in all directions from the similar gossip of all other servers.
Upon being chosen as the target for assignment of a vir-tual machine, the server’s utilization—its capacity used di-vided by capacity available—is compared with the aver-age AU of all gossiped utilization. If greater, the server is skipped as though it had been full and the breadth-first search continues.
1. Put all neighbors ofRi in a list (same as before).
2. Examine all server racks in the list and select the server rack Rj closest to Ri using the definition of the
“dis-tance” provided above (same as before).
3. Compare the utilized capacity ofRj withAU. If below
AU, allocate capacity ofRj to our application
4. Add all neighbors ofRjto the list.
5. RemoveRjfrom the list.
6. Repeat steps 2–5 until we find requested capacity to launchkinstances to run the application.
Rather than being calculated dynamically the utilization target could be set by the Cloud Provider explicitly. Setting a target is useful for guiding capacity or draining racks prior to maintenance or upgrade. The target could also incorpo-rate historical analysis of existing occupants, probabilistic demand, and could lead to sophisticated decision-making on placement of the sort considered in [17].
6 Virtual machine migration
There are several reasons to periodically examine and re-arrange applications:
1. Similar to disk fragmentation, over time the Computer Cloud becomes fragmented.
2. With changes in network latency, application might ben-efit from a new placement, which takes into account the latest network latency (stored as weightswl in VCM).
3. Cloud Providers might discover that several applications are expressing virtual affinity implicitly through network utilization and would benefit from being placed closer.
It is advisable to perform periodic Cloud defragmentation. Defragmentation is performed by re-arranging parts of ap-plication, which are talking through a congested area using placement algorithm described above. Given the distributed nature of Voronoi Diagram, defragmentation could be per-formed locally in response to network congestion and also scheduled periodically as a preemptive maintenance of the Cloud.
There has been significant research in using live migra-tion of virtual machines to optimize resource utilizamigra-tion.
VM migration as described in [7] uses low-latency, high-bandwidth local networks to achieve interruption times as low as 60 ms. The notion of “capsules” in [28] provides some hope for moving VMs over longer distances. A check-pointing approach is used in [14] to specifically tackle the problem of migration over longer distances. The problem of scheduling migrations is tackled in [30]. In addition to meth-ods for migration, analysis on the lifetime of virtual work-loads suggests that opportunity for optimization does exist. In a study of PlanetLab resources [25] 25% of “slices” were shown to live more than 1 week, offering significant oppor-tunity for observation and migration. Research and practice on migration of VMs shows that proximity plays an impor-tant part in the decision for placing migrations. Applications “dirty” more or less memory at different rates, driving the amount of bandwidth and time required to sync a new VM, influencing the constraint on distance to the new location. Tolerance for the duration of interruption also influences the optimal choice of a distance constraint. Current research does not suggest how VM proximity should be managed. The VCM’s ability to consider distance in every placement makes it especially suited to solving the migration problem, both to minimize downtime for the application and to enable a wider geographic choice of placement.
Using a working example of vacating a rack of serversRi
to allow replacement or retirement, a list of VMs hosted on Ri which require relocation is established. This list contains
the capacity requirement of the VMCvand the location of
its userUv. For each member of the list, the aforementioned
Latency Constraint placement algorithm is performed:
1. Find the triangleT in the Delaunay triangulation con-tainingUv.
2. Identify the three vertices ofT, select the closest vertex toUv.
3. If the server rack at this vertexRj has capacityCv,
exe-cute migration of the VM toRj, process next member of
the list.
4. If not, put all neighbors ofRjin a list.
5. Examine all server racks in the list and select the server rack Rj closest to Ri using the definition of the
“dis-tance” provided above (as the sum of all weights on the shortest path).
6. IfRj has available capacity then allocate available
ca-pacity ofRjto our application.
7. Add all neighbors ofRj to the list.
8. RemoveRj from the list.
9. These steps are repeated until all VMs on the list have been migrated.
priority to VMs with the heaviest dependency on the net-work. Additionally, the list could be pre-sorted byU, ensur-ing that an individual user’s VMs were placed and migrated as a group, maximizing their chance of maintaining the clos-est possible distance between them.
7 Conclusions and future work
In our study we propose to adapt a well-known structure, the Voronoi Diagram, to modeling Computer Clouds. We present a novel Virtual Cloud Model—a combination of static geographical Delaunay Triangulation, supplemented with near-real-time network latency information. We de-scribe one algorithm for placing “low-latency” applications and another algorithm for placing “high-availability” appli-cations in the Computer Cloud using VCM. It appears to be the first application of Voronoi Diagrams to managing the assignment of applications to physical servers in the Cloud. The algorithm is scalable and easily localizable and dis-tributable, which is instrumental in managing tens of mil-lions of applications running on milmil-lions of servers, located across the world. The proposed system can be used as a part of a larger system which can take all of the user parame-ters into account and suggest placement strategies. In our discussion below on future research we highlight a few of these areas, specifically Virtual Machine Migration, Band-width Weighting and Group Placement Constraints.
7.1 Bandwidth weighting
Up to now, we have considered applications for which la-tency is the most significant network consideration. While latency generally correlates with bandwidth [25] it is pos-sible to construct networks and applications optimized for bandwidth over latency. For these applications we propose carrying dual edge weights, one for latency and the other for bandwidth. While multiple VCM edge weights would be problematic in the case where a given placement would re-quire consideration of all weights simultaneously, the high-bandwidth high-delay network requirement could be satis-fied with such a scheme.
7.2 Group placement constraints
Though default placement considers all members of a group of virtual machines in a placement request to have equal connectivity requirements with respect to each other, many distributed applications have components which may re-quire specific network affinity to other components. Con-sider a web application made up of many web servers each tied to a specific memory cache server, where session affin-ity desires low latency between specific pairs of web and
cache servers. The simplest form of our placement algo-rithm, described above, could be modified to allow group placement through successive calls, favoring closeness of specific virtual machines to other, previously placed virtual machines. If theU location parameter is set equal to a pre-vious Ri which received a placement, the subsequent call
will attempt to place the new virtual machine as close as possible (respecting any specification of a required avail-ability separation, of course). However, it is easy to imag-ine a set of constraints which should be satisfied as a group, at the time of a single launch request for a set of virtual machines. For this case, our algorithm could be improved further by creating a constraint list declaration to be pro-cessed during the breadth-first search for rack capacity. A set of physical racks, and/or specific servers would be selected and reserved, which meet all requirements of the group’s constraint list, followed by the actual placement through the reservations. This would allow the group’s placement re-quest to be processed as an all-or-none transaction, ensuring all constraints are met.
Additional applications of VCM could be the object of further research:
1. For example, VCM could be used by Cloud Providers to identify and cure inefficient routing and network topolo-gies by examining cases where the weightwlof an edge
is out of proportion with its length.
2. VCM could also be used for making bandwidth reserva-tions by allocating static routes and reserving resources for Quality of Service (QoS). Some applications require predictable, guaranteed performance and VCM might of-fer an efficient structure to manage and prioritize Cloud resources to offer a certain guaranteed level of perfor-mance to some applications.
3. VCM could also be used to share application placement information across different Clouds. This allows cus-tomers to control application placement and run their ap-plications close to each other, but on different Clouds of-fered by different providers.
4. VCM could also be used to manage Cloud Capacity. Each placement request creates demand for a particular placement. In addition to satisfying the request, we could add phantom points on the VCM graph representing op-timal placement, thus indicating a need for new capacity in a region of the VCM. We would need additional in-formation on total demand, target utilization factors, and server-rack capacity, to produce a set of candidate points near which additional capacity is recommended. 5. We could also use VCM to manage donations of excess
Acknowledgements The second author is supported in part by the National Science Foundation (NSF) Grants 0652005 and DMS-0969254.
References
1. Agarwal S, Dunagan J, Jain N, Saroiu S, Wolman A, Bhogan H Volley: Automated data placement for geo-distributed cloud ser-vices. In: Proceedings of 7th USENIX symposium on networked systems design and implementation (NSDI)
2. Aurenhammer F (1991) Voronoi diagrams—a survey of a funda-mental geometric data structure. ACM Comput Surv 23(3):345– 405
3. Bae SW, Chwa K-Y (2004) Voronoi diagrams with a transporta-tion network on the Euclidean plane. In: Algorithms and compu-tation: 15th international symposium, ISAAC, Hong Kong, 2004, pp 101–124
4. Beaumont O et al (2006) VoroNet: a scalable object network based on Voronoi tessellations. Laboratoire de l’Informatique du Paral-lélisme, Lyon, France, RR2006-11
5. Brakke KA (1985) Statistics of random plane Voronoi tessella-tions. Techn Report, Department of Math Sciences, Susquehanna University, Selinsgrove
6. Calka P (2003) An explicit expression of the distribution of the number of sides of the typical Poisson? Voronoi Cell Adv Appl Probab 35:863–870
7. Clark C et al (2005) Live migration of virtual machines. In: USENIX NSDI
8. Demers A, Gealy M, Greene D, Hauser C, Irish W, Larson J (1989) Epidemic algorithms for replicated database maintenance. Associ-ation of Computing Machinery, New York
9. Devillers O, Pion S, Teillaud M (2001) Walking in a triangula-tion. In: 17th annual ACM symposium on computational geometry (SCG), pp 106–114
10. Fortune S (1992) Voronoi diagrams and Delaunay triangulations. In: Hwang F, Du D-Z (eds) Computing in Euclidean geometry. World Scientific, Singapore, pp 193–233
11. Hinde AL, Miles RE (1980) Monte Carlo estimates of the distri-butions of the random polygons of the Voronoi tessellation with respect to a Poisson process. J Stat Comput Simul 10:205–223 12. Hu S-Y, Liao G-M (2004) Scalable peer-to-peer networked virtual
environment. In: Proc ACM SIGCOMM workshop on NetGames, pp 129–133
13. Icking C et al (2003) Java applets for the dynamic visualization of Voronoi diagrams. In: Lecture notes in computer science, pp 191–205
14. Jin H, Liu H, Liao X, Hu L, Li P (2009) Live migration of vir-tual machine based on full-system trace and replay. In: HPDC ’09 proceedings of the 18th ACM international symposium on high performance distributed computing. ACM, New York
15. Khanban A, Edalat A, Lieutier A et al (2002) Computability of partial Delaunay triangulation and Voronoi diagram. In: Com-putability and complexity in analysis, CCA 2002, July 2002
16. Kozuch M, Gass R, Ryan M (2009) Tashi: Location-aware cluster management. In: International conference on autonomic comput-ing. ACM, New York, pp 43–48
17. Kramer L, Barbulescu L, Smith S Understanding performance tradeoffs in algorithms for solving oversubscribed scheduling. The Robotics Institute, Carnegie Mellon University
18. Le K, Zhang J, Meng J, Bianchini R, Nguyen T, Jaluria Y (2010) Reducing electricity cost through virtual machine placement in high performance computing clouds. Technical Report DCS-TR-680, Dept of Computer Science, Rutgers University, November 2010
19. Lee D, Lam SS (2008) Efficient and accurate protocols for dis-tributed Delaunay triangulation under churn. In: Network proto-cols, ICNP 2008, pp 124–136
20. Meijering JL (1953) Interface area, edge length, and number of vertices in crystal aggregates with random nucleation. Philips Res Rep 8:270–290
21. Meyerhenke H (2005) Constructing higher-order Voronoi dia-grams in parallel. In: EWCG, pp 123–126
22. Møller J (1994) Lectures on random Voronoi tessellations. Springer, New York
23. Na H-S, Lee C-N, Cheong O (2002) Voronoi diagrams on the sphere. In: Computational geometry: theory and applications, September 2002, pp 183–194
24. Okabe A, Boots B, Sugihara K (1992) Spatial tessellations: con-cepts and applications of Voronoi diagrams. Wiley, Chichester 25. Oppenheimer D, Chun B, Patterson D, Snoeren A, Vahdat A
(2006) Service placement in a shared wide-area platform. In: ATEC ’06 proceedings of the annual conference on USENIX ’06 annual technical conference. USENIX Association, Berkeley 26. Ostrobsky-Berman Y (2005) Computing transportation Voronoi
diagram in optimal time. In: EWCG, pp 159–162
27. Ostrovsky-Berman Y (2003) Transportation Voronoi diagrams. Leibniz Center for Research in Computer Science, Jerusalem 28. Sapuntzakis C, Chandra R, Pfaff B, Chow J, Lam S, Rosenblum
M (2002) Optimizing the migration of virtual computers. In: Pro-ceedings of the 5th symposium on operating systems design and implementation (OSDI’02), December 8–11, 2002, Boston, MA, USA
29. Sedgewick R (1990) Algorithms in C. Addison-Wesley, Reading 30. Setzer T, Stage A (2009) Network-aware migration control
and scheduling of differentiated virtual machine workloads. In: CLOUD ’09 proceedings of the 2009 ICSE workshop on software engineering challenges of cloud computing. IEEE Computer So-ciety, Washington
31. Shamos M, Hoey D (1975) Closest-point problems. In: Proc 16th annu IEEE sympos found comput sci, pp 151–162
32. Sriram I, Khajeh-Hosseini A (2010) Research agenda in cloud technologies. In: 1st ACM symposium on cloud computing, SOCC. ACM, New York
33. Tanemura M (2003) Statistical distributions of Poisson Voronoi cells in two and three dimensions. Forma 18(4):221–247 34. VoroGlide (2010) Interactive Voronoi diagrams. Cooperative