R E S E A R C H
Open Access
Effects of green tea consumption on
cognitive dysfunction in an elderly
population: a randomized
placebo-controlled study
Kazuki Ide
1, Hiroshi Yamada
1*, Norikata Takuma
2, Yohei Kawasaki
1, Shohei Harada
1, Junpei Nakase
3,
Yuuichi Ukawa
3and Yuko M. Sagesaka
3Abstract
Background:Green tea is a beverage with potential effects on cognitive dysfunction, as indicated by results of experimental studies. However, its effects in humans, especially at real-world (typical) consumption levels, are unclear. Methods:A double-blind, randomized controlled study was conducted to assess the effects of green tea consumption on cognitive dysfunction (Mini-Mental State Examination Japanese version (MMSE-J) score <28) in Japan. Participants were randomly allocated to the green tea or placebo group, and consumed either 2 g/day of green tea powder (containing 220.2 mg of catechins) or placebo powder (containing 0.0 mg of catechins), respectively, for 12 months. Cognitive function assessments were performed every 3 months using the MMSE-J and laboratory tests.
Results:Thirty-three nursing home residents with cognitive dysfunction were enrolled (four men, 29 women; mean age ± SD, 84.8 ± 9.3; mean MMSE-J score ± SD, 15.8 ± 5.4), of whom 27 completed the study. Changes of MMSE-J score after 1 year of green tea consumption were not significantly different compared with that of the placebo group (−0.61 [−2.97, 1.74], least square mean (LSM) difference [95 % CI];P= 0.59). However, levels of malondialdehyde-modified low-density lipoprotein (U/L), a marker of oxidative stress, was significantly lower in the green tea group (−22.93 [−44.13, −1.73], LSM difference [95 % CI];P= 0.04).
Conclusions:Our results suggest that 12 months green tea consumption may not significantly affect cognitive function assessed by MMSE-J, but prevent an increase of oxidative stress in the elderly population. Additional long-term controlled studies are needed to clarify the effects.
Trial registration:UMIN000011668
Keywords:Green tea, Oral administration, Cognitive function, Elderly, Randomized-controlled trial
Background
With the increasing age of the global population, the prevalence of age-related diseases, especially dementia is increasing [1].
Globally, dementia affects 5 to 7 % of individuals over 60 years old [2]. Alzheimer’s disease International re-ported 44.35 million people with dementia in 2013
worldwide, and estimated that this number nearly dou-bles every 20 years. Their updated report estimated a total of 135.46 million people with dementia by 2050 [3]. Despite the availability of medications, such as choline-sterase inhibitors and memantine, no curative therapy is currently available [1, 4, 5]. Additionally, no candidate drug for dementia treatment has been approved since memantine’s approval in 2002 for Europe and 2003 for the U.S. [5]. Given this situation, preventing dementia and limiting its progression with a combination of pharmaceutical and non-pharmaceutical treatments are important to improve the quality of life of the elderly. A * Correspondence:[email protected]
1Department of Drug Evaluation & Informatics, Graduate school of
Pharmaceutical Sciences, University of Shizuoka, 52-1 Yada, Suruga-ku, Shizuoka 422-8526, Japan
Full list of author information is available at the end of the article
number of epidemiological studies suggest that lifestyle, including dietary and nutritional factors, is related to risk of dementia [6–9]. In addition to these studies and the pathophysiology of dementia suggests that the modi-fication of oxidative stress is important for preventing the disease and limiting its progression [8, 10, 11].
Green tea is a beverage with anti-oxidative stress and neuromodulating properties, as revealed by experimental studies in vitro and in vivo [12–14]; this is also supported by clinical studies [15, 16]. Epidemiological studies, in-cluding cross-sectional and longitudinal studies, focusing on cognitive function, have yielded contrasting results. Some found a relationship between green tea consump-tion and the prevalence of dementia and/or cognitive de-cline [17–21], while others did not find a correlation at all, or identified sex-related differences [22–25]. In addition, only 3 intervention studies on the effect of green tea consumption on cognitive dysfunction were conducted [26–28]. All of these intervention studies suggested that green tea or green tea-based dietary supplements may reduce the rate of cognitive decline or even improve cogni-tive function. However, one of them used green tea-based supplements [28], and the results of other two studies were inconclusive [26, 27].
In a previous pilot intervention study [26], we used normal green tea powder. Participants consumed 2 g/day of the powder (approximately equal to two to four cups of tea/day). Improvement of cognitive function, as evaluated by the Mini-Mental State Examination Japanese version (MMSE-J), was measured after 3 months of daily con-sumption. The results suggest potential effects of typical green tea consumption on cognitive dysfunction. How-ever, the design of the pilot study was a before-after trial, and 3 months of study period was too short to reliably measure the effects. Additional studies with a longer study period are thus needed.
Based on this, we conducted a randomized, placebo-controlled study to evaluate the effects of 12 months of green tea consumption on cognitive dysfunction and re-lated risk factors in the elderly.
Methods
Design overview
A randomized placebo-controlled study was conducted to evaluate the effect of green tea consumption on cogni-tive dysfunction in the elderly. The study took place at White Cross Nursing Home in Higashi-murayama, Tokyo, Japan. Thirty-three participants were enrolled to consume 2 g/day of green tea or placebo powder for 12 months. The MMSE-J, for assessments of cognitive function, and laboratory tests, for related risk factors, were administered before the intervention, and then every 3 months. Changes in MMSE-J scores and laboratory test results were com-pared between the green tea and the placebo groups. The
supporting CONSORT checklist are available as sup-porting information; see Additional file 1.
Setting and participants
Participant recruitment was performed at the nursing home by posters and announcements. The inclusion cri-teria were as follows: 1)≥50 years of age; 2) ability to orally ingest green tea and placebo powder; 3) No consumption of food supplements with anti-oxidative stress effects (vitamins E, C, A, and β-carotene) during the study period; and 4) An MMSE-J score of <28 [29]. The ex-clusion criteria were as follows: 1) tea allergy; 2) severe cardiac, respiratory, hepatic, or renal dysfunction; and 3) severe anemia. The MMSE-J was administered to all applicants to evaluate the inclusion criteria and assess the baseline cognitive performance.
The following baseline clinical characteristics were re-corded by the nursing home medical staff for each partici-pant: age, sex, body mass index (BMI), underlying disease, complications, medications, alcohol consumption, smoking habits, tea and supplement consumption habits, activity of daily living, and brain magnetic resonance imaging (MRI) or computed tomography (CT). A tea consumption habit was defined as≥1 cup/day.
Randomization and interventions
Eligible participants were randomized by a computer gen-erated permuted block randomized schema, and stratified according to the nursing home building. A 1:1 allocation ratio was used. The randomization process was performed at the Data Management Center of Shizuoka General Hospital in Japan.
The participants orally consumed 2.0 g/day of green tea or placebo powder. The green tea powder contained 220.2 mg of catechins (gallocatechin, 10.9 mg; epigallocate-chin, 72.0 mg; cateepigallocate-chin, 2.0 mg; epicateepigallocate-chin, 22.0 mg; epi-gallocatechin gallate, 88.0 mg; epi-gallocatechin gallate, 8.0 mg; epicatechin gallate, 17.3 mg), 20.8 mg of theanine, and 60.0 mg of caffeine. The placebo powder consisted of 1.6 g of cellulose powder and 0.4 g of gardenia/caramel pigment and contained 0.0 mg of catechins. Both powders were manufactured by ITO EN Ltd. (Tokyo, Japan). The nursing home staff maintained a daily compliance report.
All participants and/or their legal representatives gave written informed consent before entering the study.
Outcome and follow-up
The primary outcome measure was the difference of MMSE-J score changes from the baseline after 12 months of intervention between the green tea and the placebo groups.
data. Changes of MMSE-J scores measured every 3 months were also compared between groups. The Neuropsychi-atric Inventory Questionnaire (NPI-Q) was administered to assess behavioral and psychological symptoms of de-mentia (BPSD) [30] and was rated by caregivers (care-giving staff in the nursing home). The following data were also collected: blood pressure; serum lipid levels (Total cholesterol [TC], low-density lipoprotein cholesterol [LDL-C], high-density lipoprotein cholesterol [HDL-C], triglycerides [TG], and malondialdehyde-modified low-density lipoprotein [MDA-LDL]); blood glucose levels (fasting plasma glucose [FPG]); and hemoglobin A1c (HbA1c). All outcome measures were assessed before intervention (baseline) and every three months during the study period.
Statistical analyses
Based on our previous study and studies using the MMSE [26, 31–33], we estimated the mean difference of MMSE-J scores between the two groups 12 months after starting the intervention as 1.7 points, with 1.4 points of standard deviation (SD). Sample size was estimated as 12 for each group, with a power level of 0.80 to detect a difference of MMSE score changes and a 2-sided alpha level of 0.05. Given the nature of the tested population (elderly people with cognitive dysfunction), dropout rate was estimated as 25 %. We thus set our total sample size at 32.
Both the full analysis set (FAS) and the per-protocol set (PPS) were used for all efficacy and safety analyses. No interim analysis was planned. The FAS was deter-mined by excluding participants from the intention-to-treat population according to the following criteria: 1) no
green tea or placebo consumption, and/or 2) no interven-tion data collected, or withdrawal from the study with or without refusal to have data included in the study. In addition to these criteria, the PPS was defined with the following criteria: 1) adherence rate of green tea or pla-cebo consumption at or above 90 %.
Continuous variables were expressed as mean ± SD, while categorical variables were expressed as numbers and per-centages of the group. Differences in the mean values of continuous measurements were tested by analysis of covari-ance (ANCOVA) [34] with age as a covariate because of its medical implication [10]. A repeated measures ANCOVA was also performed to analyze changes of MMSE-J scores from the baseline up to 12 months after starting the inter-vention [35]. In this analysis, age was also considered a covariate. The results of the ANCOVA and repeated mea-sures ANCOVA were expressed as least square mean (LSM) ± standard error (SE), while the difference be-tween the two groups was expressed as LSM difference with 95 % confidence interval (95 % CI) [36]. LOCF was also performed for the analysis of MMSE-J scores.
Statistical significance was set toP< 0.05, and all statis-tical analyses were performed using SAS version 9.4 for Windows (SAS Institute Inc., Cary, NC, USA).
Ethics statement
The study protocol was approved by the ethics committee of the University of Shizuoka (No. 25–10; approved on June 25, 2013) and was conducted in accordance with the Declaration of Helsinki. The study was registered at the University hospital Medical Information Network (UMIN) as #UMIN000011668.
Results
Study population
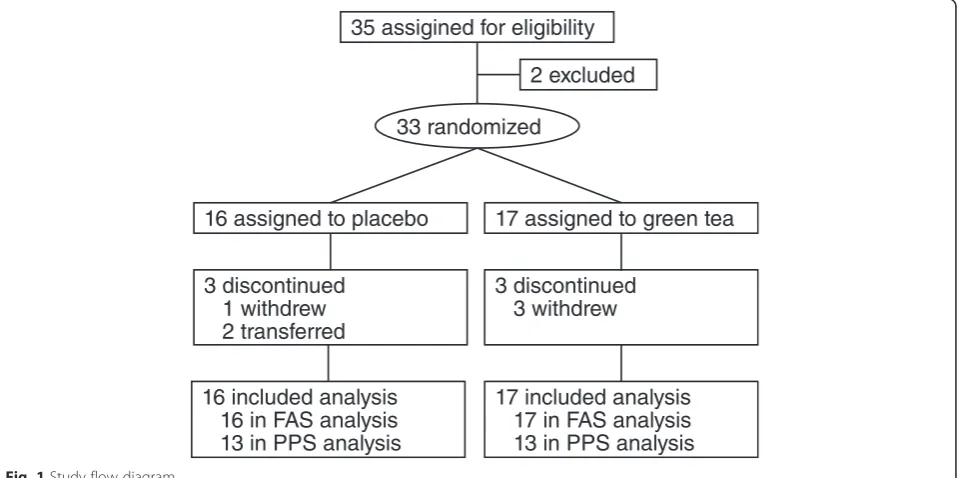
The flow diagram for this study is shown in Fig. 1. Thirty-five nursing home residents or their legal repre-sentatives gave written informed consent. Upon assess-ment of eligibility, two residents were excluded based on the exclusion criteria. Thirty-three nursing home resi-dents with cognitive dysfunction were enrolled (4 men, 29 women; mean age ± SD, 84.8 ± 9.3 years), and allo-cated randomly to a group: 17 participants to the green tea group, and 16 to the placebo group. Twenty-seven participants completed the study, as 6 participants dis-continued: 4 withdrew by themselves (1 from the pla-cebo group and 3 from the green tea group) and 2 were transferred to a hospital (both from the placebo group). According to the criteria described in the Methods sec-tion, 33 participants were included in the FAS, and 26 in the PPS. In the PPS, 1 participant was excluded because of his/her low adherence rate (<90 %) in addition to the 6 participants who discontinued.
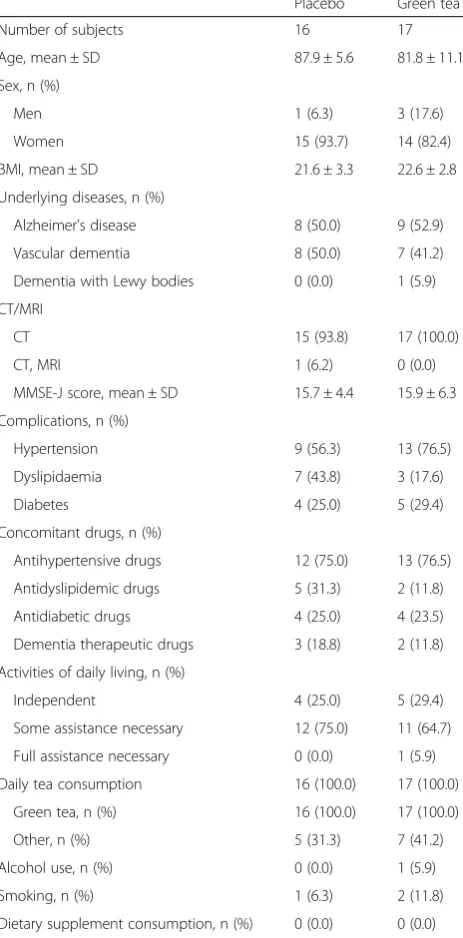
Baseline characteristics
Participants’baseline characteristics are shown in Table 1. The mean age of participants was 84.8 ± 9.3 years (placebo group, 87.9 ± 5.6 years; green tea group, 81.8 ± 11.1 years). Seventeen participants had Alzheimer’s disease (8 in the placebo group, 9 in the green tea group), 15 had vascular dementia (8 in the placebo group, 7 in the green tea group), and 1 in the green tea group had dementia with Lewy bodies. Among 33 participants, 5 were being treated with medications for dementia (3 in the placebo group, and 2 in the green tea group), and the doses of medica-tions were not changed during the intervention period. All 33 participants habitually drank tea (≥1 cup/day), and none of the participants had a habit of consuming any type of dietary supplements. Total adherence rate for green tea and placebo consumption was 89.6 ± 23.4 % in the FAS (placebo group, 90.7 ± 22.4 %; green tea group, 88.7 ± 25.0 %), and 99.0 ± 1.9 % in the PPS (placebo group, 99.5 ± 0.8 %; green tea group, 98.5 ± 2.6 %).
Mini-mental state examination
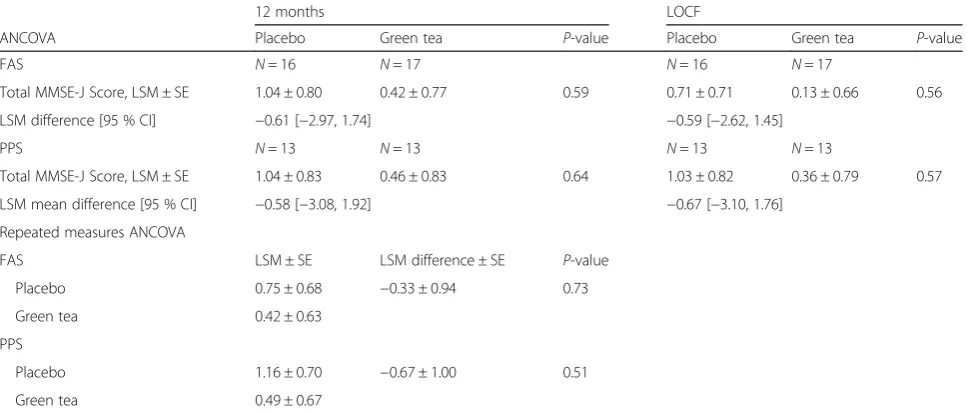
Changes in MMSE-J scores during the study period are shown in Table 2. The score difference after 1 year of green tea consumption were not significantly different compared with the placebo group (FAS: −0.61 [−2.97, 1.74], LSM difference [95 % CI];P= 0.59. PPS:−0.58 [−3.08, 1.92], P= 0.64) (Table 3). The results of the analysis with LOCF (FAS:−0.59 [−2.62, 1.45], LSM difference [95 % CI]; P= 0.56. PPS: −0.67 [−3.10, 1.76], P= 0.57) and the re-peated measures ANCOVA (FAS:−0.33 ± 0.94, LSM differ-ence ± SE; P= 0.73. PPS: −0.67 ± 1.00, P= 0.51) did not show a significant difference either (Table 3).
Neuropsychiatric inventory questionnaire and laboratory test
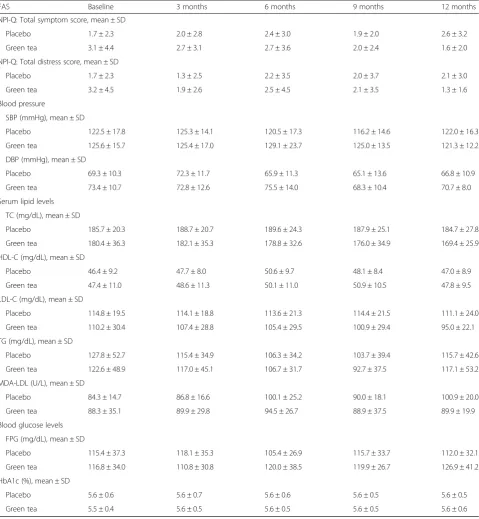
NPI-Q scores and laboratory test results are shown in Tables 4 and 5, Additional file 2: Tables S1 and Additional file 3: Table S2. The baseline symptoms and distress scores of the NPI-Q were low in both groups and scores after 12 months of intervention were not significantly
differ-ent between the two groups (FAS: Symptom, −0.34
[−2.52, 1.85], LSM difference [95 % CI]; distress,−0.25
Table 1Clinical characteristics of participants
Placebo Green tea
Number of subjects 16 17
Age, mean ± SD 87.9 ± 5.6 81.8 ± 11.1
Sex, n (%)
Men 1 (6.3) 3 (17.6)
Women 15 (93.7) 14 (82.4)
BMI, mean ± SD 21.6 ± 3.3 22.6 ± 2.8
Underlying diseases, n (%)
Alzheimer’s disease 8 (50.0) 9 (52.9)
Vascular dementia 8 (50.0) 7 (41.2)
Dementia with Lewy bodies 0 (0.0) 1 (5.9)
CT/MRI
CT 15 (93.8) 17 (100.0)
CT, MRI 1 (6.2) 0 (0.0)
MMSE-J score, mean ± SD 15.7 ± 4.4 15.9 ± 6.3
Complications, n (%)
Hypertension 9 (56.3) 13 (76.5)
Dyslipidaemia 7 (43.8) 3 (17.6)
Diabetes 4 (25.0) 5 (29.4)
Concomitant drugs, n (%)
Antihypertensive drugs 12 (75.0) 13 (76.5)
Antidyslipidemic drugs 5 (31.3) 2 (11.8)
Antidiabetic drugs 4 (25.0) 4 (23.5)
Dementia therapeutic drugs 3 (18.8) 2 (11.8)
Activities of daily living, n (%)
Independent 4 (25.0) 5 (29.4)
Some assistance necessary 12 (75.0) 11 (64.7)
Full assistance necessary 0 (0.0) 1 (5.9)
Daily tea consumption 16 (100.0) 17 (100.0)
Green tea, n (%) 16 (100.0) 17 (100.0)
Other, n (%) 5 (31.3) 7 (41.2)
Alcohol use, n (%) 0 (0.0) 1 (5.9)
Smoking, n (%) 1 (6.3) 2 (11.8)
Dietary supplement consumption, n (%) 0 (0.0) 0 (0.0)
BMIbody mass index,CTcomputed tomography,MRIMagnetic resonance imaging,MMSE-JMini Mental State Examination Japanese version,
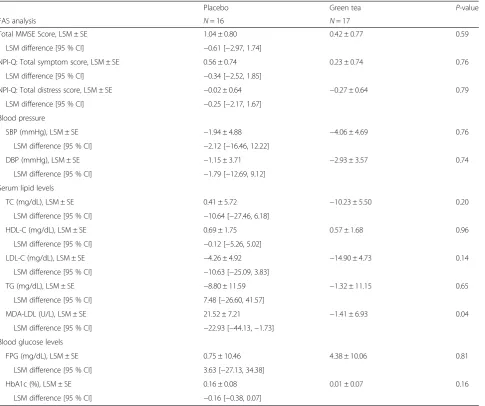
[−2.17, 1.67]; P= 0.79. PPS: Symptom, −0.46 [−2.84, 1.92]; distress, −0.43 [−2.49, 1.64]). Among laboratory test values, MDA-LDL level, which is a marker of oxidative stress, was significantly maintained lower in the green tea group (FAS: −22.93 [−44.13,−1.73], LSM difference [95 % CI]; P= 0.04. PPS: −24.50 [−46.84,
−2.16];P= 0.03). Blood pressure (FAS,P= 0.76 for systolic blood pressure (SBP), P= 0.74 for diastolic blood pres-sure (DBP); PPS, P= 0.72 for SBP, P= 0.71 for DBP), other serum lipid status TC (FAS,P= 0.20; PPS,P= 0.38), HDL-C (FAS, P= 0.96; PPS, P= 0.89), LDL-C (FAS, P= 0.14; PPS,P= 0.28) and TG (FAS,P= 0.65; PPS,P= 0.26), as well as blood glucose levels (FAS,P= 0.81 for FPG,P= 0.16 for HbA1c; PPS,P= 0.99 for FPG,P= 0.27 for HbA1c) were not significantly different between the green tea and placebo groups.
No serious adverse events associated with the inter-vention were observed during the study period.
Discussion
This randomized study was conducted to evaluate the effects of 12-month green tea consumption on cognitive dysfunction and related risk factors in the elderly. Twelve-month green tea consumption significantly maintained lower levels of oxidative stress marker MDA-LDL, but the MMSE-J score was not improved significantly.
MMSE-J scores were stable in each group during the study period, and this is a main limitation of this study. Green tea is not a medication, and our study used a dose that can be taken in daily-life situations. A 2 g/day intake of green tea powder (containing 220.2 mg of catechins) is equivalent to 2 to 4 cups/day of bottled or home-brewed green tea consumption [37–39]. Therefore, to know the effects of green tea consumption on cognitive dysfunction, long-term interventions that can follow cognitive decline in the placebo population may be needed. Our previous study used a before-after trial design [26], and a randomized
Table 2MMSE-J score changes
FAS Baseline 3 months 6 months 9 months 12 months LOCF
Total MMSE-J, mean ± SD
Placebo 15.7 ± 4.4 16.1 ± 5.5 16.8 ± 5.2 18.8 ± 4.8 17.7 ± 5.2 16.4 ± 5.3
Green tea 15.9 ± 6.3 15.9 ± 6.4 17.4 ± 6.3 16.0 ± 6.5 16.5 ± 7.2 16.1 ± 6.4
PPS
Total MMSE-J, mean ± SD Baseline 3 months 6 months 9 months 12 months LOCF
Placebo 16.7 ± 4.2 17.1 ± 5.2 17.5 ± 4.6 19.7 ± 3.9 17.7 ± 5.2 17.7 ± 5.2
Green tea 15.2 ± 6.4 15.2 ± 6.3 17.2 ± 6.4 15.2 ± 6.3 15.7 ± 7.0 15.5 ± 6.7
FASfull analysis set,SDstandard deviation,LOCFlast observation carried forward,MMSE-JMini Mental State Examination, Japanese version,PPSper protocol set
Table 3ANCOVA and repeated measures ANCOVA analysis
12 months LOCF
ANCOVA Placebo Green tea P-value Placebo Green tea P-value
FAS N= 16 N= 17 N= 16 N= 17
Total MMSE-J Score, LSM ± SE 1.04 ± 0.80 0.42 ± 0.77 0.59 0.71 ± 0.71 0.13 ± 0.66 0.56
LSM difference [95 % CI] −0.61 [−2.97, 1.74] −0.59 [−2.62, 1.45]
PPS N= 13 N= 13 N= 13 N= 13
Total MMSE-J Score, LSM ± SE 1.04 ± 0.83 0.46 ± 0.83 0.64 1.03 ± 0.82 0.36 ± 0.79 0.57
LSM mean difference [95 % CI] −0.58 [−3.08, 1.92] −0.67 [−3.10, 1.76]
Repeated measures ANCOVA
FAS LSM ± SE LSM difference ± SE P-value
Placebo 0.75 ± 0.68 −0.33 ± 0.94 0.73
Green tea 0.42 ± 0.63
PPS
Placebo 1.16 ± 0.70 −0.67 ± 1.00 0.51
Green tea 0.49 ± 0.67
study by other researchers used green tea-based supple-ments [28]. This may have led to the discrepant results. In addition, all of the participants of this study were regular tea drinker, and tea consumption during the study period was not restricted because of ethical rea-sons. Therefore, baseline tea consumption might affect
the changes and the differences of MMSE-J scores in both groups. In this study, the MMSE-J was administered every 3 months. Tombaugh [40] reported test-retest reli-ability of the MMSE with 3-month test intervals. In this study, the MMSE was administered to individuals aged 65 to 89 at 3-month intervals; the mean score changes
Table 4Values of laboratory tests during study period
FAS Baseline 3 months 6 months 9 months 12 months
NPI-Q: Total symptom score, mean ± SD
Placebo 1.7 ± 2.3 2.0 ± 2.8 2.4 ± 3.0 1.9 ± 2.0 2.6 ± 3.2
Green tea 3.1 ± 4.4 2.7 ± 3.1 2.7 ± 3.6 2.0 ± 2.4 1.6 ± 2.0
NPI-Q: Total distress score, mean ± SD
Placebo 1.7 ± 2.3 1.3 ± 2.5 2.2 ± 3.5 2.0 ± 3.7 2.1 ± 3.0
Green tea 3.2 ± 4.5 1.9 ± 2.6 2.5 ± 4.5 2.1 ± 3.5 1.3 ± 1.6
Blood pressure
SBP (mmHg), mean ± SD
Placebo 122.5 ± 17.8 125.3 ± 14.1 120.5 ± 17.3 116.2 ± 14.6 122.0 ± 16.3
Green tea 125.6 ± 15.7 125.4 ± 17.0 129.1 ± 23.7 125.0 ± 13.5 121.3 ± 12.2
DBP (mmHg), mean ± SD
Placebo 69.3 ± 10.3 72.3 ± 11.7 65.9 ± 11.3 65.1 ± 13.6 66.8 ± 10.9
Green tea 73.4 ± 10.7 72.8 ± 12.6 75.5 ± 14.0 68.3 ± 10.4 70.7 ± 8.0
Serum lipid levels
TC (mg/dL), mean ± SD
Placebo 185.7 ± 20.3 188.7 ± 20.7 189.6 ± 24.3 187.9 ± 25.1 184.7 ± 27.8
Green tea 180.4 ± 36.3 182.1 ± 35.3 178.8 ± 32.6 176.0 ± 34.9 169.4 ± 25.9
HDL-C (mg/dL), mean ± SD
Placebo 46.4 ± 9.2 47.7 ± 8.0 50.6 ± 9.7 48.1 ± 8.4 47.0 ± 8.9
Green tea 47.4 ± 11.0 48.6 ± 11.3 50.1 ± 11.0 50.9 ± 10.5 47.8 ± 9.5
LDL-C (mg/dL), mean ± SD
Placebo 114.8 ± 19.5 114.1 ± 18.8 113.6 ± 21.3 114.4 ± 21.5 111.1 ± 24.0
Green tea 110.2 ± 30.4 107.4 ± 28.8 105.4 ± 29.5 100.9 ± 29.4 95.0 ± 22.1
TG (mg/dL), mean ± SD
Placebo 127.8 ± 52.7 115.4 ± 34.9 106.3 ± 34.2 103.7 ± 39.4 115.7 ± 42.6
Green tea 122.6 ± 48.9 117.0 ± 45.1 106.7 ± 31.7 92.7 ± 37.5 117.1 ± 53.2
MDA-LDL (U/L), mean ± SD
Placebo 84.3 ± 14.7 86.8 ± 16.6 100.1 ± 25.2 90.0 ± 18.1 100.9 ± 20.0
Green tea 88.3 ± 35.1 89.9 ± 29.8 94.5 ± 26.7 88.9 ± 37.5 89.9 ± 19.9
Blood glucose levels
FPG (mg/dL), mean ± SD
Placebo 115.4 ± 37.3 118.1 ± 35.3 105.4 ± 26.9 115.7 ± 33.7 112.0 ± 32.1
Green tea 116.8 ± 34.0 110.8 ± 30.8 120.0 ± 38.5 119.9 ± 26.7 126.9 ± 41.2
HbA1c (%), mean ± SD
Placebo 5.6 ± 0.6 5.6 ± 0.7 5.6 ± 0.6 5.6 ± 0.5 5.6 ± 0.5
Green tea 5.5 ± 0.4 5.6 ± 0.5 5.6 ± 0.5 5.6 ± 0.5 5.6 ± 0.6
DBPdiastolic blood pressure,FASfull analysis set,FPGfasting plasma glucose,HbA1chemoglobin A1c,HDL-Chigh-density lipoprotein cholesterol,LDL-Clow-density lipoprotein cholesterol,LSMleast square mean,MDM-LDLmalondialdehyde-modified low-density lipoprotein,NPI-QNeuropsychiatric Inventory Questionnaire,
for the first and second 3-month periods were 0.69 and 0.35 points, respectively. Thus, changes in MMSE scores caused by practice effects are unlikely to affect results over 3-month intervals, and therefore the test interval used in this study is appropriate for the identification of cognitive changes related to the intervention.
Unexpectedly, our study did not reveal effects of green tea consumption on cognitive function, in spite of our attempt to improve upon our previous before-after study design by performing a randomized placebo-controlled study. Our results showed that MMSE-J scores were not significantly different between the groups. In addition to the non-restricted baseline tea consumption during the study period, the sex of the study subjects and the different types of dementia present in these patients are factors that
may have interfered with the results, despite the even dis-tribution of sexes and dementia patients between the ex-perimental groups.
However, MDA-LDL, which is an oxidative stress marker in peripheral blood, was significantly maintained lower in the green tea group. Oxidative stress is considered to be in-volved in late-onset neurodegenerative disorders [41–43]. It is caused by reactive oxygen species, which induce cellu-lar dysfunction and degeneration interacting with biomole-cules [44]. Cellular dysfunction and degeneration in the brain leads to progressive neurodegenerative disorders in-cluding dementia. Additionally, an increase of antibodies against MDA-LDL has been reported in the cerebrospinal fluid in people with Alzheimer’s disease, and may be related to the pathophysiology of dementia [45]. Antioxidative
Table 5ANCOVA and repeated measures ANCOVA analysis for secondary outcomes
Placebo Green tea P-value
FAS analysis N= 16 N= 17
Total MMSE Score, LSM ± SE 1.04 ± 0.80 0.42 ± 0.77 0.59
LSM difference [95 % CI] −0.61 [−2.97, 1.74]
NPI-Q: Total symptom score, LSM ± SE 0.56 ± 0.74 0.23 ± 0.74 0.76
LSM difference [95 % CI] −0.34 [−2.52, 1.85]
NPI-Q: Total distress score, LSM ± SE −0.02 ± 0.64 −0.27 ± 0.64 0.79
LSM difference [95 % CI] −0.25 [−2.17, 1.67]
Blood pressure
SBP (mmHg), LSM ± SE −1.94 ± 4.88 −4.06 ± 4.69 0.76
LSM difference [95 % CI] −2.12 [−16.46, 12.22]
DBP (mmHg), LSM ± SE −1.15 ± 3.71 −2.93 ± 3.57 0.74
LSM difference [95 % CI] −1.79 [−12.69, 9.12]
Serum lipid levels
TC (mg/dL), LSM ± SE 0.41 ± 5.72 −10.23 ± 5.50 0.20
LSM difference [95 % CI] −10.64 [−27.46, 6.18]
HDL-C (mg/dL), LSM ± SE 0.69 ± 1.75 0.57 ± 1.68 0.96
LSM difference [95 % CI] −0.12 [−5.26, 5.02]
LDL-C (mg/dL), LSM ± SE −4.26 ± 4.92 −14.90 ± 4.73 0.14
LSM difference [95 % CI] −10.63 [−25.09, 3.83]
TG (mg/dL), LSM ± SE −8.80 ± 11.59 −1.32 ± 11.15 0.65
LSM difference [95 % CI] 7.48 [−26.60, 41.57]
MDA-LDL (U/L), LSM ± SE 21.52 ± 7.21 −1.41 ± 6.93 0.04
LSM difference [95 % CI] −22.93 [−44.13,−1.73]
Blood glucose levels
FPG (mg/dL), LSM ± SE 0.75 ± 10.46 4.38 ± 10.06 0.81
LSM difference [95 % CI] 3.63 [−27.13, 34.38]
HbA1c (%), LSM ± SE 0.16 ± 0.08 0.01 ± 0.07 0.16
LSM difference [95 % CI] −0.16 [−0.38, 0.07]
ANCOVAanalysis of covariance,CIconfidence interval,DBPdiastolic blood pressure,FASfull analysis set,FPGfasting plasma glucose,HbA1chemoglobin A1c,
stress properties of green tea and its ingredients have been reported in experimental and clinical studies [13, 15, 46].
A study involving men of age range 24–46 found MDA-LDL reduction by green tea consumption [46], but to our knowledge, our study is the first one to report this effect in the elderly. It is possible that tea catechins are involved in the process and that 12 months of green tea consumption can indeed prevent an increase in MDA-LDL in elderly individuals with cognitive dysfunc-tion. This result suggests that green tea has the potential to prevent or treat dementia through combination therapy with pharmaceutical and/or non-pharmaceutical interven-tions. Neither the medical histories of the participants nor their levels of medical care changed during the study period. Therefore, the significant reduction in oxidative stress status in the green tea group was likely caused solely by green tea consumption. This difference was observed between groups of participants who habitually drank tea; therefore, this effect may also be observed in regular green tea drinkers. All of the participants of this study consumed at least one cup of green tea, equivalent to approximately 50 to 100 mg of catechins [37–39], per day. Although this baseline level of catechin ingestion may not significantly affect oxidative stress status, it may be related to the minimal changes in MMSE-J scores observed in both groups.
NPI-Q and other laboratory tests were also performed in the study, but we did not find any significant difference between groups. In terms of NPI-Q scores, almost all of participants did not have BPSD or had only mild symp-toms, and NPI-Q scores were low when starting interven-tion. Blood pressure, serum lipid levels, and blood glucose levels were also assessed. These clinical characteristics were not considered in the inclusion criteria but were measured from the starting point of the study. In future investigations, we will attempt to mitigate these con-founding factors as much as possible. To this end, additional inclusion criteria, such as participants with dyslipidemia or other diseases, may be necessary in order to reveal the effects of green tea consumption on cognitive dysfunction and related risk factors. Con-sidering these facts, long-term intervention and obser-vation over a year may be needed to clarify the effects of normal daily green tea consumption on cognitive dysfunction in the elderly.
Conclusions
Our results suggest that 12-month green tea consump-tion may not significantly affect cognitive funcconsump-tion assessed by the MMSE-J. However, it may prevent oxi-dative stress increase in the elderly. Additional long-term controlled studies are needed to clarify the nature of this effect.
Additional files
Additional file 1:CONSORT 2010 checklist of information to include when reporting a randomised trial. (DOC 217 kb)
Additional file 2: Table S1.Values of laboratory tests during study period in PPS. (DOCX 14 kb)
Additional file 3: Table S2.ANCOVA and repeated measures ANCOVA analysis in PPS. (DOCX 14 kb)
Abbreviations
ANCOVA:analysis of covariance; BPSD: behavioral and psychological symptoms of dementia; DBP: diastolic blood pressure; FAS: full analysis set; FPG: fasting plasma glucose; HbA1C: hemoglobin A1c; HDL-C: high-density lipoprotein cholesterol; LDL-C: low-density lipoprotein cholesterol; LOCF: last observation carried forward; LSM: least square mean; MDA-LDL: malondialdehyde-modified low-density lipoprotein; MMSE-J: Mini-Mental State Examination Japanese version; NPI-Q: Neuropsychiatric Inventory Questionnaire; PPS: per-protocol set; SBP: systolic blood pressure; TC: total cholesterol; TG: triglycerides.
Competing interests
Hiroshi Yamada was funded by a grant from ITO EN Ltd. (No. 13–322). Junpei Nakase, Yuuichi Ukawa, Yuko M. Sagesaka are employees of ITO EN Ltd.; the company that provided the green tea and placebo powder used in this study. Kazuki Ide was funded by a grant from the Japan Society for the Promotion of Science (JSPS), through the Grant-in-Aid for JSPS Fellows (No. 15 J10190). ITO EN Ltd. and JSPS had no role in the study design, collection, analysis, or interpretation of the data, writing of the manuscript, or the decision to submit the paper for publication. Other authors declare no competing interests.
Authors’contributions
KI and YK had full access to all of the data in the study and take responsibility for the integrity of the data and the accuracy of the data analysis. Study concept and design: KI, HY. Acquisition of data: KI, SH, HY, NT, YU, YSM. Statistical analysis and interpretation of data: YK, KI, SH. Drafting of the manuscript: KI. All authors read and approved the final manuscript.
Acknowledgement
The authors gratefully acknowledge the individuals who participated in the study and the clinical research coordinators. We thank the medical staff at White Cross Nursing Home (Ms. Sadako Fujii, Ms. Atsuko Nakahara, and Mr. Tsuyoshi Suzuki) for their dedicated cooperation. We also thank Ms. Haruka Morohoshi for her technical assistance, and Mr. Philip Hawke of the University of Shizuoka Scientific English Program for his comments on the English in the manuscript.
Author details
1Department of Drug Evaluation & Informatics, Graduate school of
Pharmaceutical Sciences, University of Shizuoka, 52-1 Yada, Suruga-ku, Shizuoka 422-8526, Japan.2White Cross Nursing Home, 2-26-1 Suwa-cho,
Higashimurayama, Tokyo 189-0021, Japan.3Central Research Institute, ITO EN, Ltd., 21 Mekami, Makinohara, Shizuoka 421-0516, Japan.
Received: 24 December 2015 Accepted: 25 April 2016
References
1. Sorbi S, Hort J, Erkinjuntti T, Fladby T, Gainotti G, Gurvit H, et al. EFNS-ENS Guidelines on the diagnosis and management of disorders associated with dementia. Eur J Neurol. 2012;19(9):1159–79.
2. Prince M, Bryce R, Albanese E, Wimo A, Ribeiro W, Ferri CP. The global prevalence of dementia: a systematic review and metaanalysis. Alzheimers Dement. 2013;9(1):63–75.
4. Ngo J, Holroyd-Leduc JM. Systematic review of recent dementia practice guidelines. Age Ageing. 2015;44(1):25–33.
5. Schneider LS, Mangialasche F, Andreasen N, Feldman H, Giacobini E, Jones R, et al. Clinical trials and late-stage drug development for Alzheimer’s disease: an appraisal from 1984 to 2014. J Intern Med. 2014;275(3):251–83.
6. Kalmijn S, Launer LJ, Ott A, Witteman JC, Hofman A, Breteler MM. Dietary fat intake and the risk of incident dementia in the Rotterdam Study. Ann Neurol. 1997;42(5):776–82.
7. Barberger-Gateau P, Raffaitin C, Letenneur L, Berr C, Tzourio C, Dartigues JF, et al. Dietary patterns and risk of dementia: the Three-City cohort study. Neurology. 2007;69(20):1921–30.
8. Devore EE, Grodstein F, van Rooij FJ, Hofman A, Stampfer MJ, Witteman JC, et al. Dietary antioxidants and long-term risk of dementia. Arch Neurol. 2010;67(7):819–25.
9. von Arnim CAF, Gola U, Biesalski HK. More than the sum of its parts? Nutrition in Alzheimer’s disease. Nutrition. 2010;26(7–8):694–700. 10. Association A’s. 2014 Alzheimer’s disease facts and figures. Alzheimers
Dement. 2014;10(2):e47–92.
11. Melo A, Monteiro L, Lima RM, Oliveira DM, Cerqueira MD, El-Bacha RS. Oxidative stress in neurodegenerative diseases: mechanisms and therapeutic perspectives. Oxid Med Cell Longev. 2011;2011:467180. 12. Ide K, Yamada H. Clinical benefits of green tea consumption for cognitive
dysfunction. PharmaNutrition. 2015;3(4):136–45.
13. Biasibetti R, Tramontina AC, Costa AP, Dutra MF, Quincozes-Santos A, Nardin P, et al. Green tea (−)epigallocatechin-3-gallate reverses oxidative stress and reduces acetylcholinesterase activity in a streptozotocin-induced model of dementia. Behav Brain Res. 2013;236(1):186–93.
14. Srividhya R, Gayathri R, Kalaiselvi P. Impact of epigallo catechin-3-gallate on acetylcholine-acetylcholine esterase cycle in aged rat brain. Neurochem Int. 2012;60(5):517–22.
15. Coimbra S, Castro E, Rocha-Pereira P, Rebelo I, Rocha S, Santos-Silva A. The effect of green tea in oxidative stress. Clin Nutr. 2006;25(5):790–6. 16. Erba D, Riso P, Bordoni A, Foti P, Biagi PL, Testolin G. Effectiveness of
moderate green tea consumption on antioxidative status and plasma lipid profile in humans. J Nutr Biochem. 2005;16(3):144–9.
17. Kuriyama S, Hozawa A, Ohmori K, Shimazu T, Matsui T, Ebihara S, et al. Green tea consumption and cognitive function: a cross-sectional study from the Tsurugaya Project 1. Am J Clin Nutr. 2006;83(2):355–61.
18. Ng TP, Feng L, Niti M, Kua EH, Yap KB. Tea consumption and cognitive impairment and decline in older Chinese adults. Am J Clin Nutr. 2008;88(1): 224–31.
19. Feng L, Gwee X, Kua EH, Ng TP. Cognitive function and tea consumption in community dwelling older Chinese in Singapore. J Nutr Health Aging. 2010; 14(6):433–8.
20. Feng L, Li J, Ng TP, Lee TS, Kua EH, Zeng Y. Tea drinking and cognitive function in oldest-old Chinese. J Nutr Health Aging. 2012;16(9):754–8. 21. Noguchi-Shinohara M, Yuki S, Dohmoto C, Ikeda Y, Samuraki M, Iwasa K, et
al. Consumption of Green Tea, but Not Black Tea or Coffee, Is Associated with Reduced Risk of Cognitive Decline. PLoS One. 2014;9(5):e96013. 22. Huang CQ, Dong BR, Zhang YL, Wu HM, Liu QX. Association of cognitive
impairment with smoking, alcohol consumption, tea consumption, and exercise among Chinese nonagenarians/centenarians. Cogn Behav Neurol. 2009;22(3):190–6.
23. Eskelinen MH, Ngandu T, Tuomilehto J, Soininen H, Kivipelto M. Midlife coffee and tea drinking and the risk of late-life dementia: a population-based CAIDE study. J Alzheimers Dis. 2009;16(1):85–91.
24. Arab L, Biggs ML, O’Meara ES, Longstreth WT, Crane PK, Fitzpatrick AL. Gender differences in tea, coffee, and cognitive decline in the elderly: the Cardiovascular Health Study. J Alzheimers Dis. 2011;27(3):553–66. 25. Shen W, Xiao Y, Ying X, Li S, Zhai Y, Shang X, et al. Tea consumption and
cognitive impairment: a cross-sectional study among Chinese elderly. PLoS One. 2015;10(9):e0137781.
26. Ide K, Yamada H, Takuma N, Park M, Wakamiya N, Nakase J, et al. Green tea consumption affects cognitive dysfunction in the elderly: a pilot study. Nutrients. 2014;6(10):4032–42.
27. Kataoka Y, Utsunomiya K, Kimbara A, Fukushima K, Mori T, Shiba J, et al. Preventive effect of green tea containing theanine at a high concentration on dementia in aged volunteers. J Jpn Mibyou System Assoc. 2009;15:17–23 [Japanese].
28. Park SK, Jung IC, Lee WK, Lee YS, Park HK, Go HJ, et al. A Combination of Green Tea Extract and L-Theanine Improves Memory and Attention in
Subjects with Mild Cognitive Impairment: a Double-Blind Placebo-Controlled Study. J Med Food. 2011;14(4):334–43.
29. Reisberg B, Jamil IA, Khan S, Monteiro I, Torossian C, Ferris S, et al. Staging dementia. In: Abou-Saleh MT, Katona C, Kumar A, editors. Principles and practice of geriatric Psychiatry. 3rd ed. Oxford: Wiley; 2011. p. 162–9. 30. Kaufer DI, Cummings JL, Ketchel P, Smith V, MacMillan A, Shelley T, et al.
Validation of the NPI-Q, a brief clinical form of the Neuropsychiatric Inventory. J Neuropsychiatry Clin Neurosci. 2000;12(2):233–9.
31. Rogers SL, Farlow MR, Doody RS, Mohs R, Friedhoff LT. A 24-week, double-blind, placebo-controlled trial of donepezil in patients with Alzheimer’s disease. Donepezil Study Group. Neurology. 1998;50(1):136–45. 32. Black S, Roman GC, Geldmacher DS, Salloway S, Hecker J, Burns A, et al.
Efficacy and tolerability of donepezil in vascular dementia: positive results of a 24-week, multicenter, international, randomized, placebo-controlled clinical trial. Stroke. 2003;34(10):2323–30.
33. Ringman JM, Frautschy SA, Teng E, Begum AN, Bardens J, Beigi M, et al. Oral curcumin for Alzheimer’s disease: tolerability and efficacy in a 24-week randomized, double blind, placebo-controlled study. Alzheimers Res Ther. 2012;4(5):43.
34. Fisher RA. Statistical methods for research workers. Edinburgh: Oliver & Boyd; 1934.
35. Huck SW, McLean RA. Using a repeated measures ANOVA to analyze the data from a pretest-posttest design: A potentially confusing task. Psychol Bull. 1975;82(4):511.
36. SAS/STAT(R) 14.1 User’s Guide: LSMEANS Statement. http://support.sas.com/ documentation/cdl/en/statug/68162/HTML/default/viewer.htm#statug_ logistic_syntax20.htm. Accessed 27 Apr 2016.
37. Lin JK, Lin CL, Liang YC, Lin-Shiau SY, Juan IM. Survey of catechins, gallic acid, and methylxanthines in green, oolong, pu-erh, and black teas. J Agric Food Chem. 1998;46(9):3635–42.
38. Nakagawa S, Hoshi T, Kubo A, Yamato S. Determination of Tea polyphenols in bottled Japanese Tea drinks and differences in polyphenol content in Tea leaves from different variety. Bunseki Kagaku. 2013;62(1):51–5.
39. Park M, Yamada H, Matsushita K, Kaji S, Goto T, Okada Y, et al. Green Tea consumption is inversely associated with the incidence of influenza infection among schoolchildren in a Tea plantation area of Japan. J Nutr. 2011;141(10):1862–70.
40. Tombaugh TN. Test-retest reliable coefficients and 5-year change scores for the MMSE and 3MS. Arch Clin Neuropsychol. 2005;20(4):485–503. 41. Bennett S, Grant MM, Aldred S. Oxidative stress in vascular dementia and
Alzheimer’s disease: a common pathology. J Alzheimers Dis. 2009;17(2):245–57. 42. Federico A, Cardaioli E, Da Pozzo P, Formichi P, Gallus GN, Radi E.
Mitochondria, oxidative stress and neurodegeneration. J Neurol Sci. 2012; 322(1–2):254–62.
43. Gandhi S, Abramov AY. Mechanism of oxidative stress in neurodegeneration. Oxid Med Cell Longev. 2012;2012:428010.
44. Dasuri K, Zhang L, Keller JN. Oxidative stress, neurodegeneration, and the balance of protein degradation and protein synthesis. Free Radic Biol Med. 2013;62:170–85.
45. Kankaanpaa J, Turunen SP, Moilanen V, Horkko S, Remes AM. Cerebrospinal fluid antibodies to oxidized LDL are increased in Alzheimer’s disease. Neurobiol Dis. 2009;33(3):467–72.
46. Nagao T, Komine Y, Soga S, Meguro S, Hase T, Tanaka Y, et al. Ingestion of a tea rich in catechins leads to a reduction in body fat and malondialdehyde-modified LDL in men. Am J Clin Nutr. 2005;81(1):122–9.
• We accept pre-submission inquiries
• Our selector tool helps you to find the most relevant journal • We provide round the clock customer support
• Convenient online submission • Thorough peer review
• Inclusion in PubMed and all major indexing services • Maximum visibility for your research
Submit your manuscript at www.biomedcentral.com/submit