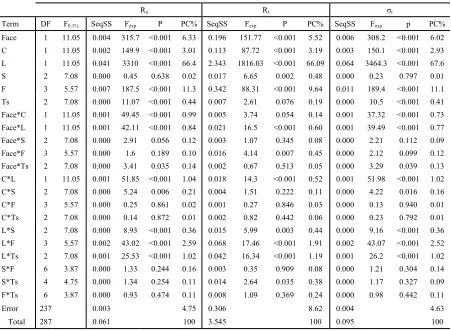
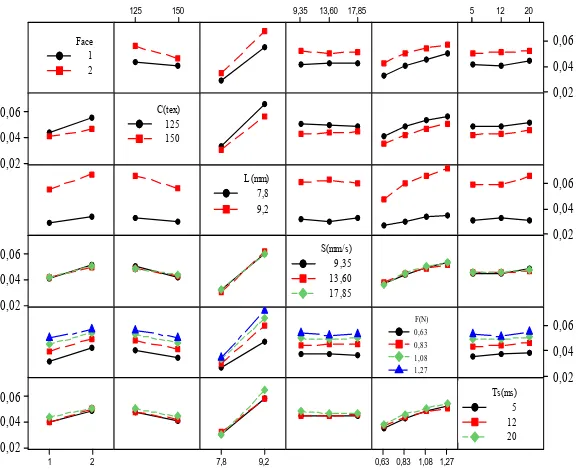
Statistical Analysis of Surface Roughness Parameters for Weft Knitted Fabrics Measured by the Textile Surface Tester (TST)
Full text
Figure
Related documents
Using text mining of first-opinion electronic medical records from seven veterinary practices around the UK, Kaplan-Meier and Cox proportional hazard modelling, we were able to
The small premature infant who has undergone a sur gical procedure and would have to be fed by gavage is much more easily and safely fed through a gastrostomy tube (Fig. 2)..
This research concluded that peripheral neuropathy is one of the complications of liver cirrhosis irrespective of its etiology and is more prevalent in male
Based on the idea, we have put forward novel routing strategies for Barrat- Barthelemy- Vespignani (BBV) weighted network. By defining the weight of edges as
National Conference on Technical Vocational Education, Training and Skills Development: A Roadmap for Empowerment (Dec. 2008): Ministry of Human Resource Development, Department
infected HeLa cells , fused in a minimal reaction resulting in binucleated or trinucleated syncytia. Nor- mal heteroploid cells adsorbed with para-infiuenza
Field experiments were conducted at Ebonyi State University Research Farm during 2009 and 2010 farming seasons to evaluate the effect of intercropping maize with
bronchiseptica in terms of cell bound and cell free hemolysin on human, poultry and sheep RBCs at variable pH, temperature and cell age using Stainer
