© Global Society of Scientific Research and Researchers
http://ijcjournal.org/
Predicting Students' Degree Completion Using Decision
Trees
Josan Dionisio Tamayo
a*, Nilo V Francisco
b, Mary Eujene P Malonzo
c, Abigail
P Bugay
da,b,c,d
Centro Escolar University, Km. 44 Longos, Malolos Bulacan 3000, Philippines
aEmail: [email protected]
bEmail: [email protected]
cEmail: [email protected]
dEmail: [email protected]
Abstract
Educational Data Mining (EDM) helped institutions to improve students' performance by predicting student's
future learning behavior. To benefit from this, the researchers conducted this study to predict the successful
degree completion and provide early intervention as necessary. Decision Tree algorithm provided by WEKA is
used to build the model using students' data such as Entrance Exam Results, gender, school type where they
graduated high school and final grades from English 1, Algebra and major subjects. Students who entered the
University from school years 2012-2013, 2013-2014, 2014-2015 and 2015-2016 were selected. RandomForest
suited best for the model and desktop application was designed and evaluated as Outstanding in terms of
Efficiency, Accuracy and User Friendliness.
Keywords: Decision Trees; Education Data Mining; Predictive Analytics; Data Mining Algorithm; Data Mining.
1.Introduction
Data mining is the science of extracting useful knowledge from huge data repositories. It has been a buzzword
in the business world nowadays, specially by companies with strong focus on customers. It helps in drilling
down transactional data and predicting pricing, customer preferences, sales impact and customer satisfaction as
well as company profits. Because of the useful predictions produced by data mining educational institutions find
opportunities to use large amounts of data generated in educational settings.
---
With the advent of educational technology and growing interest in understanding student needs and methods to
improve the learner’s experience and performance, Educational Data Mining (EDM) came into existence. It is a
multidisciplinary field that covers the area of analyzing educational data using data mining techniques [2]. To
date, many educational institutions take advantage of data enriched decision making. They used EDM to gain
deep and thorough knowledge to enhance its assessment, evaluation, planning, and decision-making in its
educational programs. EDM will help academic programs identify and discovered hidden patterns in the data
[3].
One applications of EDM is early prediction of student results. This is necessary in higher education for
identifying the “weak” students so that some form of remediation may be organized for them [1]. On the other
hand, [4] identified the goals of EDM which are to (1) predict students' future learning behavior (2) discover or
improve domain models (3) study the effects of educational support that can be achieved through learning
systems and (4) advance scientific knowledge about learning and learners by building and incorporating student
models.
Remarkable studies viz., [5,7,8,9,10,12,13,14,15,16] were conducted and published to investigate on how they
used available data in their institution and make use of these data to improve their teaching – learning
experiences. This researches serve as basis on future researchers who want to investigate on same endeavors.
After all, data is meaningless until we processed these data to become useful to our organization.
As one of the leading universities in the Philippines, Centro Escolar University (CEU) maintains a huge
collection of educational database from the three campuses namely, CEU Manila, CEU Makati and CEU
Malolos. From the year of its establishment in 1907 up to present, the University stores students record for easy
access, retrieval and interpretation. At present, one of the University’s goal is to make use of the available data
and create meaningful business decisions out of these data. An attempt to address this goal is this research that
aims to utilize available data of the students and from these data create a model that will predict students’ degree
completion using decision trees.
Decision Tree is one of the data mining algorithms which include classification, regression, clustering, factor
analysis, neural networks, association rule mining and sequential pattern mining. Decision tree is used in solving
classification and prediction problems. Because of its simple recursive structure for expressing a sequential
classification process, researchers from various disciplines such as statistics, machine learning, pattern
recognition, and data mining have dealt with the issue of growing a decision tree from available data [11].
Software in data mining algorithms help researches and data scientists to interpret data faster and reliable, hence
various software (licensed and open source) are made available. One of the open source software available in
the market is Waikato Environment for Knowledge Learning (WEKA). WEKA is a widely used and accepted
machine learning workbench for applied machine learning, developed at the University of Waikato, New
Zealand. It contains tools for data pre-processing, classification, regression, clustering, association rules, and
Decision tree algorithms implemented in WEKA are considered in this research and differentiated as follow:
Table 1: Decision Tree Algorithms in WEKA
Algorithm Definition
REPTree Fast decision tree learner. Builds a decision/regression tree using information gain/variance
and prunes it using reduced-error pruning (with backfitting). Only sorts values for numeric
attributes once [17].
RandomTree Class for constructing a tree that considers K randomly chosen attributes at each node.
Performs no pruning. Also has an option to allow estimation of class probabilities (or target
mean in the regression case) based on a hold-out set (backfitting) [17].
RandomForest A combination of tree predictors where each tree depends on the values of a random vector
sampled independently and with the same distribution for all trees in the forest. In standard
trees, each node is split using the best split among all variables. In a random forest, each node
is split using the best among a subset of predictors randomly chosen at that node [17].
J48 This algorithm is Weka's implementation of the C4.5 decision tree that uses a
divide-and-conquer approach to growing decision trees [17].
Using the decision tree algorithms available in the WEKA environment, this study aims to:
1. Identify the strongest predictor(s) of students’ degree completion.
2. Build a model to predict students’ degree completion based from:
- Entrance test scores in English, Mathematics, Logic Reasoning and Science
- School Type where student graduated high school
- Gender and
- Final Grades in English 1, Mathematics 1 and Major Subject
3. Develop a desktop application to predict students’ degree completion for students with entry year 2014
and 2015.
4. Evaluate the desktop application in terms of its:
- Accuracy
- Efficiency and
- User-friendliness
2.Data Collection
There are two main sources of data in the study. The entrance test results, school type where the students
Malolos. On the other hand, final grades were extracted from the Enrolment, Admission and Registration
System version 2 (EARS 2) the existing computerized enrolment system of CEU Malolos. Data are composed of
four school years such as 2012-2013, 2013-2014, 2014-2015 and 2015-2016. To eliminate data that are not
needed in the study the following criteria are taken into consideration for data cleansing:
- Students from the College of Management & Technology (CMT).
- Student’s degree is his/her first college degree.
- Student took the University’s Entrance Test.
- Student continued four-year degree after completing the two year ladderized program (AAT to BSBA
Management Accounting and AIT to BSIT)
- Student must have final grades in English 1, Mathematics 1 and Major Subject.
- Major subject based from the curriculum of Associate in Accounting Technology (AAT) is Accounting
1 or PCACC101, Associate in Information Technology is Computer Programming 1 or PRCS111 and
Management courses is Management 101 or MGT101.
- Students with Officially Dropped (OD), No Final Exam (NFE) or No Final Report (NFR) from the 3
subjects were removed from the data while Unofficially Dropped is recoded as 5.00.
There are a total of 669 students qualified in the criteria, broken down as follow:
Table 2: Respondents Profile per Entrance Year and Course
Course
Number of Enrolled per Entry Year
2012 2013 2014 2015
Associate in Accounting Technology (AAT) 54 63 39 41
Associate in Information Technology (AIT) 80 51 39 51
Management (MG) 54 84 67 46
Total 669
Data are readily available from the GCS in MS Excel format as well as grades extracted from EARS 2. The two
files are consolidated in one Excel file and then transferred to SPSS for recoding. There are 9 input variables as
shown in Table 3, and recoded to convert it to Nominal values. Because of the multiple values derived from the
test scores in the entrance test, recoding minimized the possible values. Recoding still based from the score
group of the Entrance Test Score provided by the GCS which are originally interpreted as Very Low, Low,
Below Average, Average, High and Very High. University’s grading system follows 1.00 as the highest and
5.00 as the lowest, recoding the grade in numerical order will eliminate confusion on the interpretation. Final
grade was taken from the University grading system and verbal interpretation are Unsatisfactory, Minimally
within four years (coded as 1) or not (coded as 0).
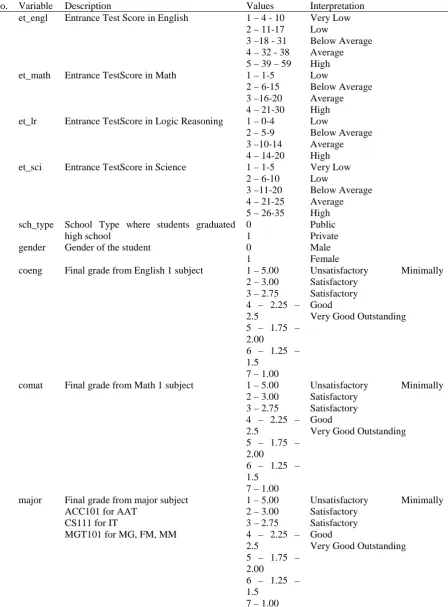
Table 3: Input Variables
No. Variable Description Values Interpretation
1 et_engl Entrance Test Score in English 1 – 4 - 10
2 – 11-17 3 –18 - 31 4 – 32 - 38 5 – 39 – 59
Very Low Low
Below Average Average High
2 et_math Entrance TestScore in Math 1 – 1-5
2 – 6-15 3 –16-20 4 – 21-30
Low
Below Average Average High
3 et_lr Entrance TestScore in Logic Reasoning 1 – 0-4
2 – 5-9 3 –10-14 4 – 14-20
Low
Below Average Average High
4 et_sci Entrance TestScore in Science 1 – 1-5
2 – 6-10 3 –11-20 4 – 21-25 5 – 26-35
Very Low Low
Below Average Average High
5 sch_type School Type where students graduated
high school
0 1
Public Private
6 gender Gender of the student 0
1
Male Female
7 coeng Final grade from English 1 subject 1 – 5.00
2 – 3.00 3 – 2.75 4 – 2.25 – 2.5
5 – 1.75 – 2.00
6 – 1.25 – 1.5
7 – 1.00
Unsatisfactory Minimally Satisfactory
Satisfactory Good
Very Good Outstanding
8 comat Final grade from Math 1 subject 1 – 5.00
2 – 3.00 3 – 2.75 4 – 2.25 – 2.5
5 – 1.75 – 2.00
6 – 1.25 – 1.5
7 – 1.00
Unsatisfactory Minimally Satisfactory
Satisfactory Good
Very Good Outstanding
9 major Final grade from major subject
ACC101 for AAT CS111 for IT
MGT101 for MG, FM, MM
1 – 5.00 2 – 3.00 3 – 2.75 4 – 2.25 – 2.5
5 – 1.75 – 2.00
6 – 1.25 – 1.5
7 – 1.00
Unsatisfactory Minimally Satisfactory
Satisfactory Good
To evaluate the desktop application, researchers selected software quality based from the model indicated in
ISO/IEC 9126 standard. The standard enumerated six software quality hence, there were only three which are
applicable to the developed application and these were Efficiency, Accuracy and User-Friendliness. Table 4
shows the rating and its equivalent verbal interpretation.
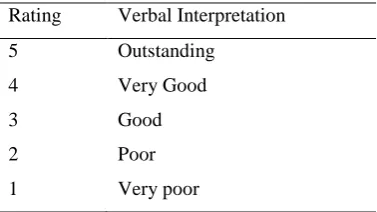
Table 4: Desktop Application Evaluation Tool
Rating Verbal Interpretation
5 Outstanding
4 Very Good
3 Good
2 Poor
1 Very poor
3.Identifying the strongest predictor(s)
After recoding the input variables, attribute selection is the next step to find which subset of attributes works
best for prediction. According to Hall and Holmes techniques of attribute selection are Information Gain and
Relief, while Ganchev and his colleagues considers that they are Information Gain and Gain Ratio. This study
considered the 3 techniques and results are shown in Table 5.
Table 5: Analysis of Input Variables' Significance
Attribute Gain Ratio Information Gain Relief Average
coeng 0.091126 0.21948 0.152196 0.154267333
comat 0.07184 0.184699 0.149354 0.135297667
major 0.06744 0.160286 0.103618 0.110448
et_math 0.052336 0.070357 0.017571 0.046754667
et_sci 0.034764 0.05747 0.035142 0.042458667
gender 0.052318 0.05216 0.01292 0.039132667
et_engl 0.032295 0.047025 0.027132 0.035484
et_lr 0.004526 0.005704 0.000517 0.003582333
sch_type 0.000618 0.000286 0.006718 0.002540667
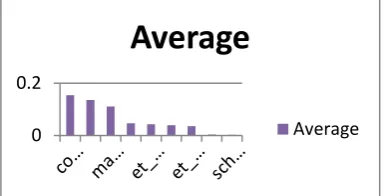
The techniques resulted to different ranking in the input variables so the average of the 3 techniques is
calculated resulting to English 1 has the highest significance and influence in predicting students’ degree
completion, followed by Mathematics 1, Major subject, Entrance Test Score in Math, Science, Gender and
College of Management and Technology. Since English is the medium of communication in almost every
subject in the curriculum, failing grade in English will minimize the chances of elevating in higher level of the
course. Mathematics 1 and Major subject 1 are pre requisite subjects and failing them will preempt completion
of the students’ degree. It can be noticed that Entrance Test Score in Logic Reasoning and School Type both
alone have almost no influence in predicting students’ degree completion, this means student who came from
Public or Private school, or with high or low logic reasoning is not a guarantee of degree completion on time.
Figure 1: Graphical Representation of Analysis of Input Variables' Significance
4.Model Building
Data of students who entered the University from school years 2012 – 2013 and 2013 – 2014 were entered as
train data because they already have the actual data whether they graduated on time or not. While data of
students from school years 2014 – 2015 and 2015 – 2016 were entered as test data and predicted values will be
applied. As for the objective of building a model to predict students degree completion based from:
- Entrance test scores of English, Mathematics, Logic Reasoning and Science
- School Type where student graduated high school
- Gender and
- Final Grade of English 1, Mathematics 1 and Major Subject
The foregoing table summarizes the test results of WEKA Explorer. It shows that RandomTree and
RandomForest give the highest correctly classified instances and lowest incorrectly classified instances. This
proves that the best model to predict students’degree completion is the model provided by RandomTree and
RandomForest algorithms.
Table 6: Decision Tree Test Results
Decision Tree
Algorithm
Number of
Leaves
Size of the
tree
Correctly Classified
Instances
Incorrectly Classified
Instances
REPTree 8 275 71.2435 % 111 28.7565 %
RandomTree 522 379 98.1865 % 7 1.8135 %
RandomForest 379 98.1865 % 7 1.8135 %
J48 32 41 307 79.5337 % 79 20.4663 %
0 0.2
Average
Table 7 shows the Confusion Matrix for RandomForest which explains the difference between actual and
predicted class.
Actual class that graduated on time is 195 while predicted class is 190. Actual class who did not graduate on
time is 191 while predicted class is 195. Table 8 on the other hand shows Actual class that graduated on time is
191 while predicted class is 190 and actual class on did not graduate on time is 195 and 196 for predicted class.
Therefore, RandomTree algorithm as compared to RandomForest has only 1 difference in the actual and
predicted values in the class graduated on time and did not graduate on time.
Table 7: Confusion Matrix for Random Forest
Predicted Class
class graduated on time did not graduate on time
Actual Class class graduated on time 192 3
did not graduate on time 4 187
Table 8: Confusion Matrix for Random Tree
Predicted Class
class graduated on time did not graduate on time
Actual Class class graduated on time 190 1
did not graduate on time 6 189
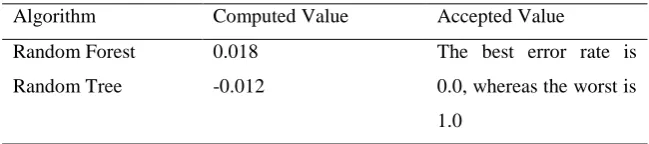
The result of the Confusion Matrix is validated using Error Rate and Accuracy Rate as shown in the foregoing
tables. Error rate (ERR) is calculated as the number of all incorrect predictions divided by the total number of
the dataset. The best error rate is 0.0, whereas the worst is 1.0.
Accuracy (ACC) is calculated as the number of all correct predictions divided by the total number of the dataset.
The best accuracy is 1.0, whereas the worst is 0.0. It can be noted that computed values are acceptable for the
two algorithms, Accuracy rates are equal while Error rates have negligible difference. Therefore, either of the
two algorithm is the best model for this study.
Table 9: Error Rate (ERR)
Algorithm Computed Value Accepted Value
Random Forest 0.018 The best error rate is
0.0, whereas the worst is
1.0
Table 10: Accuracy Rate (ACC)
Algorithm Computed Value Accepted Value
Random Forest 0.98 The best accuracy is 1.0,
whereas the worst is 0.0.
Random Tree 0.98
Figure 2: Decision Tree for Students Degree Completion
The tree created by the model is large but important rules can be noted as:
Figure 3: Extracted tree for predicting students’ degree completion on coeng and gender
The tree predicts if coeng = 2.25 – 2.5, gender = Male then grad = 1. A final grade in English 1 of 2.25 to 2.5 for
Male students predicts a degree completion on time. A total of 65 completed on time in the actual cases and 20
did not completed on time.
The tree predicts if coeng = 1.75 – 2, sch_type = Private then grad = 1. A final grade in English 1 of 1.75 to 2
for students graduated from Private high schools predicts a degree completion on time. A total of 76 completed
on time in the actual cases and 18 did not completed on time.
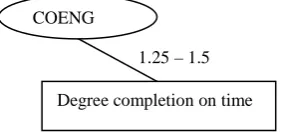
Figure 5: Extracted tree for predicting students’ degree completion on coeng
The tree predicts if coeng = 1.25 – 1.5. A final grade in English 1 of 1.25 to 1.5 predicts a degree completion on
time. A total of 42 completed on time in the actual cases and 8 did not completed on time.
Figure 6: Extracted tree for predicting students’ degree completion on coeng, gender, st_sci and et_engl
The tree predicts if coeng = 2.25 – 2.5, gender = Female, st_sci = Above Average, et_engl =Average then grad
= 1. A final grade in English 1 of 2.25 to 2.5 for Female students whose entrance test scores in Science
interpreted as Average and English as Average predicts a degree completion on time. A total of 22 completed on
time in the actual cases and 7 did not completed on time.
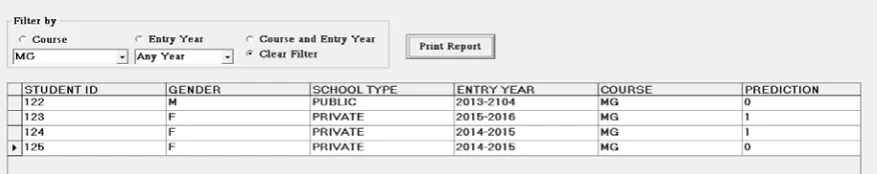
5.Predicting students’ degree completion on the test dataset
As mentioned in the data modeling, data of students entered in the years 2014 and 2015 were entered as test data
and predicted values will be applied. The last objective of this study is to create predictions for the next two
years in the data. This is done by using the built model in RandomTree. Table 11 shows the predicted output
values for entry year 2014 and 2015, AAT with total enrolled of 41 has predicted value of 27, AIT and MG with
total enrolled of 51 and 52 respectively. The predicted values are 33 for AIT and 22 for MG. Meanwhile entry
Female 2.25 – 2.5
COENG
gender
Degree completion on time st_sci
AboveAverage
st_engl
Average 1.25 – 1.5
COENG
year of 2015 which has total enrolled of 39 for AAT, 39 for AIT and 60 for MG has predicted values of 24, 10
and 20 respectively. It can be noticed the lowest percentage from the AIT students which is validated in the
Closing Program for Associate Programs where only 12 students or 23% of the total enrolled finished the 2 year
program on time.
Table 11: Predicted Value for Entry Years 2014 and 2015
Course
Entry Year - 2014 Entry Year - 2015
Total
Enrolled
Predicted
Value Total
Enrolled
Predicted
Value
N % N %
Associate in Accounting Technology
(AAT) 41 27 66% 39 24 62%
Associate in Information Technology
(AIT) 51 33 65% 39 10 26%
Management (MG) 52 22 42% 60 20 33%
6.Development of the Desktop Application
The designed tree is used as a model to build the desktop application. Keeping in mind simplicity and user
friendliness of the system, repository of data is created using MS Access while front end is designed using
Visual Basic 6. To secure integrity of the data a username and password are provided for the possible user of the
system.
Figure 7: Login Screen
Reports are available, which include printing for individual student, per school year and per course.
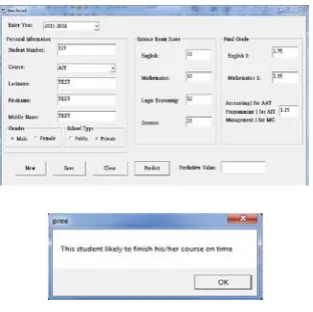
Adding new record is another feature of the application. This feature also allows prediction whether the student
will graduate on time based from the data entered by the user. Data entered when saved will store permanent
record in the application unless deleted by the administrative user.
Figure 9: Adding New Record
Application is designed to be functional to meet the areas of Efficiency which means it features provision on
storing correct information as well as prediction. Also, it provides easy retrieval of information when needed.
Report generation is easy and efficient. Added feature is provided that the user can even filter or narrow the
selection by entry year or course. Accuracy in the area can be measured whether the system can produce
updated result and the data can be updated. The application is designed following the system clock of the
computer scheme and database to be updateable if changes have been taken place. User- Friendliness is very
vital for a system, to have a user-friendly Graphical User Interface (GUI). Application is designed with Tool Tip
Text that will serve as hint for the user in case of misinterpreted commands or misplacement of mouse pointer.
Instructions were written in English language but authors used simple terms that even non techies will
understand.
7.Evaluation of the developed system
The application was presented to selected Non-teaching staff, faculty members and administration of CEU
Malolos and have them evaluate the application.
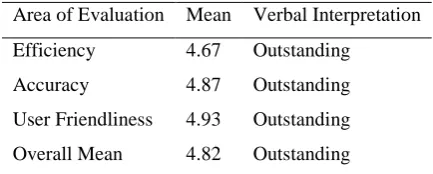
Table 12 shows the result of the evaluation of the system in terms of Efficiency. The desktop application in
terms of efficiency was perceived by the respondents as efficient with the mean of 4.67. The questions that
determined the efficiency of the system includes the retrieval of information, capacity to produce the desired
information, organization of the information and report generation.
The evaluation in the area of accuracy for the desktop application acquired a mean of 4.87. The system adheres
with the criteria of accuracy which means presence of updatable information, production of satisfactory
The user-friendliness of the application earned a mean of 4.93. Developed application contains clear
instructions. It is effective, logical and easy to understand. It also recognizes invalid commands, provides single
point of entry for all data input to avoid confusion and makes use of consistent user interface.
Table 12: Evaluation of the Desktop Application
Area of Evaluation Mean Verbal Interpretation
Efficiency 4.67 Outstanding
Accuracy 4.87 Outstanding
User Friendliness 4.93 Outstanding
Overall Mean 4.82 Outstanding
8.Conclusion
Based from the findings of the study the following conclusions were derived:
Strongest predictor(s) of students’ degree completion.
1. Final grade in English 1 (Communication and Writing Skills) is the strongest predictor of students’
degree completion for the students of College of Management and Technology. This is followed by
Mathematics 1 (Algebra) and the first Major subject (Accounting 1, Programming 1 and Management
1). It can be concluded that non completion of degree on time attributes to failing one of the 3 subjects
in the first semester. The existing policy of the University on prerequisite validates that when a student
failed one of these 3 subjects during the first semester, the student cannot enroll prequisite subjects.
Previous knowledge in Mathematics, Science and English are almost equally important in the successful
completion of the degree. Students with high scores in these areas attributes to successful degree
completion. Gender is also predictor of successful degree completion; specifically, female students
have higher chances of completing their degree on time as compared to male students.
2. Model to predict students’ degree completion.
The best model for the students’ degree completion is the RandomTree generated by the WEKA software.
RandomTree and RandomForest have equal correctly and incorrectly classified instances values of
98.1865% and 1.8135% respectively. But the actual class versus predicted on class graduated is closer
in RandomForest as compared to RandomTree. Therefore, the model generated by RandomForest is
considered as the best fit for this study.
3. Development and Evaluation of the Desktop Application.
Application is created using MS Access and Visual Basic 6.0. the application was evaluated and found to be
the College of Management and Technology in predicting the students’ degree completion.
4. Prediction on students’ degree completion for entry level 2014 and 2015.
It can be concluded in the predicted value derived using the RandomForest model that there is an alarming
drop in the percentage of students who will graduate on time for AIT. From 65% for entry year 2014
only 26% for entry year 2015 will graduate on time. Majority of these students failed from one of the 3
subjects (English 1, Math 1 and Major).
9.Recommendations
The following recommendations are drawn based on the conclusion of the study:
1. Since English is the strongest predictor in the degree completion of the students in the College of
Management and Technology. It is therefore recommended to intensify English in all courses in the
curriculum. The University has existing implementation of Test of English for International
Communication (TOEIC) for first year students. Results of TOEIC can be utilized to improve the
English proficiency of the students.
2. The developed model in this study predicts degree completion of students in the College of
Management & Technology. It can be utilized to monitor performance of students upon finishing the
first semester, therefore timely intervention can be made as early as possible to assist students, when
needed.
3. The University’s Learning Assistance Program (LAP) is designed for students with learning difficulties
in any of the enrolled core curriculum subjects.
References
[1] Acharya, A and Sinha, D. (2014). Early Prediction of Students Performance using Machine Learning
Techniques. International Journal of Computer Applications 107(1):37-43, December 2014.
[2] Al-Razgan, A., Al-Khalifa S., and Al-Khalifa H. S.,(2013). Educational data mining: A systematic
review of the published literature 2006-2013 in Proc. the 1st International Conference on Advanced
Data and Information Engineering, 2013, pp. 711-719.
[3] Al-Barrak A. and Al-Razgan, M. (2016). Predicting Students Final GPA Using Decision Trees: A Case
Study Mashael
[4] Baker, R.S. and Yacef, K (2009), The state of educational data mining in 2009: A review and future
visions
[5] Becker, J. Student Success and College Readiness: Translating Predictive Analytics Into Action,
[6] Bydžovská, H. and Brandejs, M. (2014). Knowledge Discovery and Information Retrieval
[7] Devasia, T., Vinushree, T. P. and Hegde, V. (2016. Prediction of students performance using
Educational Data Mining, 2016 International Conference on Data Mining and Advanced Computing
(SAPIENCE), Ernakulam, 2016, pp. 91-95.
[8] Kovacic, Z (2010). Early prediction of student success: mining students’ enrolment data, in Information
Science and IT Education (InSITE) Conference Proceedings, ed. I Science Institute, Informing Science
Institute, Santa Rosa, pp.647-665
[8] Levinger, B., Sims, A. and Whittington , A. (2013). Towards Student Success Prediction
[9] Roccini, L. M. (2011). The impact of learning communities on first year students’ growth and
development in college. Research in Higher Education, 52, 178-193.
[10] Rokach and Maimon, Data Mining and Knowledge Discovery Handbook.
[10] Sperry, R. A. Predicting First-Year Student Success in Learning Communities: The Power of
Pre-College Variables. Learning Communities Research and Practice, 3(1), Article 2.
[11] Tekin, A. (2014). Early prediction of students’ grade point averages at graduation: A data mining
approach. Eurasian Journal of Educational Research 54, 207-226.
[12] Predictive Analytics for Student Success: Developing Data-Driven Predictive Models of Student
Success Final Report University of Maryland University College January 6, 2015
[13] Prediction of Student Success Rate Using Naive Bayes (2017)
Online References
[14] Maryland universities to use data to predict student success — or failure, Retrieved January 5, 2017
from
http://www.baltimoresun.com/news/maryland/education/bs-md-college-analytics-20160611-story.html
[15] A Complete Tutorial on Tree Based Modeling from Scratch (in R & Python), Retrieved December 17,
2016
from
https://www.analyticsvidhya.com/blog/2016/04/complete-tutorial-tree-based-modeling-scratch-in-python/
[16] Machine Learning Group at the University of Waikato, Retrieved December 15, 2016 from