Machine Learning Technique For Enhancing
Classification Performance In Data
Summarization Using Rough Set And Genetic
Algorithm
Merlinda Wibowo, Fiftin Noviyanto, Sarina Sulaiman, Siti Mariyam Shamsuddin
Abstract: The number of data will grow rapidly and showed a significant increase every day. This data comes from different resources and services that produce a big volume of data that need to manage and reuse or some analytical aspects of the data. These heterogeneous sources of information are able to lead to important challenges for calibration of the model, as the data is often possible to be imprecise, uncertain, ambiguous, and incomplete. Therefore, it needs big storages and this volume of makes operations such as analytical operations, process operations, retrieval operations real difficult and hugely time-consuming. One of the solutions to overcome these difficult problems is to have data summarized to make less storage and extremely shorter time to get processed and retrieved. Data summarization techniques aim than to produce the best quality of summaries. In this study, Rough Set (RS) is proposed to obtain the accuracy, effectiveness and appropriate summary result. However, RS can extract decision rules effectively from given datasets, two processes data discretization and finding reducts are required in order to generate decision rules based on the values. Both processes are known to be Non-Polynomials (NP) problem and are also related to the dimensionality reduction problem. To solve two problems, Genetic Algorithm (GA) is applied to search both the cut points for discretization and the reducts in order to discover the optimal rules. Moreover, the reduction and transformation of the data may shorten the running time, while also allowing the system to obtain more generalized results and improve the predictive accuracy. Therefore, this study proposes the hybrid approach of RS and GA to improve lack of the rough set to ensure of better result. Hybridization of the proposed method hybrid RS-GA is going to overcome the short come of data summarization method. In order to find the efficiency of the proposed work, the classification accuracy obtained using these methods are compared with the accuracy of the proposed hybrid approach. The ML methods were analyzed by comparing the prediction accuracy: Rough Set (RS), Naïve Bayes (NB), J48, Random Tree (RT) and Projective Adaptive Resonance Theory (PART). The finding shows that RS-GA approach achieved the highest prediction accuracy with 99.95% and produce the lowest error based on API values from Malaysia and Singapore respectively compared to the other ML methods. For that, it was proved that RS-GA is the best performance and the most significant method compared to other methods.
Index Terms: Machine Learning, Prediction, Data Summarization, Rough Set, Genetic Algorithm, Hybrid Technique.
—————————— ——————————
1.
INTRODUCTION
The large-scale data is the large amount of data collection which cannot efficiently be managed by a state-of-the-art data processing technology that increasing day by day [1][2]. The difficulties in data processing are influenced by the number of data as well [3]. Therefore, it needs big storages and this volume of makes operations such as analytical operations, process operations, retrieval operations real difficult and hugely time-consuming. One of the solutions to overcome these difficult problems is to have data summarized to make less storage and extremely shorter time to get processed and retrieved [4][5][6][7].
Data summarization method aim than to produce a good quality of summaries. Therefore, the statistical and mathematical calculation methods may lead to support the data summarization technique to maximize the result of the summary without losing the original data, more efficient without wasting time and connecting all the data related to the domain [7][3]. By combining data from different sources, it generates the accurate information supply as a decision-making process, efficiency of operation and the creation of the
desired solution [6]. These heterogeneous sources of information are able to lead to important challenges for calibration of the model, as the data is often possible to be imprecise, uncertain, ambiguous, and/or incomplete [8]. There are several techniques that can be used in prediction modeling. The methods will be used to answer the question of what and something that is transparent. Hence, it will perform hypothesis validation, querying and reporting, multidimensional analysis, online analytic processing, and statistical analysis. The methods that suitable for prediction such as RS, NB, J48, RT, DT and PART [9][10][11][12][13]. In this research, RS is chosen to obtain the accuracy and effectiveness prediction of data summarization. RS can present the data selection based on reducing attributes to gain significant data from the main database [14][15]. To guide the best accuracy of prediction, the features selected are able to portray the decision; likewise, the original whole features set. The extraction of decision rules by these algorithms is concise and valuable, which is able to be benefited in data mining by enlightening some invisible knowledge from the data [16][17]. However, RS is able to extract decision rules effectively from distributed datasets, two processes data discretization and finding reducts are required in order to generate decision rules from the values. The both processes are known to be an NP-hard problem [18][19][20] and are also related to the dimensionality reduction problem [21][18][22][23]. Non-Polynomial (NP) problems require to be approached with algorithms of approximation that discover competent solutions [24][18]. Intuitively, if one particular NP problem is quickly solved, then any problem whose solution quickly solves and easy to understand, using the solution to that one special ————————————————
Merlinda Wibowo, School of Computing, Faculty of Engineering, Universiti Teknologi Malaysia.
Fiftin Noviyanto, Informatics Engineering, Faculty of Industrial Technology, Universitas Ahmad Dahlan. Email: [email protected] (Corresponding Author)
Sarina Sulaiman, School of Computing, Faculty of Engineering, Universiti Teknologi Malaysia.
1109 problem as a subroutine [25][24]. In order to solve these
problems, GA is applied to look for both the cut points for discretization and the reducts to find the optimal rules [18][21][26][23]. This paper provides the background of study trough definition of data summarization and ML method for
prediction. Next part will give the explanation about the methodology, experiment and results of this research followed the discussion for the result of this research. Finally, the conclusion is presented in the last section.
2 RELATED
WORK
Data summarization is considered as a descriptive task in data mining to provide a synopsis representation of data [27]. It makes many tasks including pre-processing, analysis and management of data. It reduces the size of data that may lead to obtaining approximate results in comparison with the exact results achieved from the original data that most of them satisfy the user requirements considering saving time, cost and space [27][5]. A major feature of summarization is that reduced data is still informative and the approximate or sometimes the same interference can be obtained from reduced data over the original data [5]. Therefore, with growing data at a phenomenal rate, large-scale data summarization has attracted many attentions to obtain compact data considering its accuracy and performance. In this research, the focus on data summarization technique sampling technique based on the research domain. According to Smits et al. [5], the summary should also offer exploration
functionalities to find interesting properties that are owned by
different data subsets and let the expert interactively track the
dataset from its summary. Moreover, to ease and speed up the dataset analysis are needed to define other data exploration functionalities based on the aim of summarization is to provide a more concise view of the provided dataset. Based on Scotti et al. [6] and Kedzie et al [28], there is a growing interest in methods for combining the results from multiple data in data summarization. Data integration dealing with the heterogeneity of data different sources has been a hot research topic for decades. By combining data from different sources generating the supply of accurate information as a decision-making process, operational efficiency, and the creation of the desired solution. Moreover, these heterogeneous sources of information can lead to significant challenges for model calibration, as the data may often be imprecise, uncertain, ambiguous, and incomplete. Then, the statistical and mathematical calculation methods may lead to support the summarization approach to maximize the result of the summary without losing the original data, more efficient without wasting time and connecting all the data related to the domain.
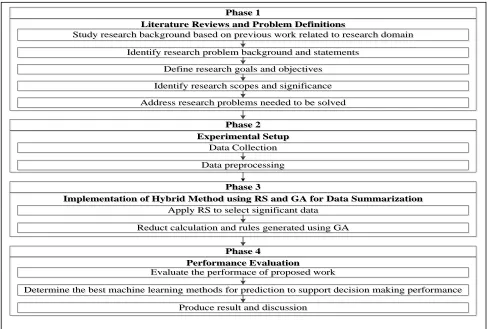
Literature Reviews and Problem Definitions
Literature Reviews and Problem Definitions
Phase 1
Phase 1
Study research background based on previous work related to research domain Study research background based on previous work related to research domain
Identify research problem background and statements Identify research problem background and statements
Define research goals and objectives Define research goals and objectives
Identify research scopes and significance Identify research scopes and significance
Address research problems needed to be solved Address research problems needed to be solved
Experimental Setup
Experimental Setup
Phase 2
Phase 2
Data Collection Data Collection
Implementation of Hybrid Method using RS and GA for Data Summarization
Implementation of Hybrid Method using RS and GA for Data Summarization
Phase 3
Phase 3 Data preprocessing Data preprocessing
Apply RS to select significant data Apply RS to select significant data
Performance Evaluation
Performance Evaluation
Phase 4
Phase 4
Evaluate the performace of proposed work Evaluate the performace of proposed work
Produce result and discussion Produce result and discussion
Reduct calculation and rules generated using GA Reduct calculation and rules generated using GA
Determine the best machine learning methods for prediction to support decision making performance Determine the best machine learning methods for prediction to support decision making performance
Based on previous frameworks, the framework that has been proposed by Dasiran [29] is one of the frameworks that contributed to the proposed framework in this research. Dasiran [29] proposed the framework to perform mobile database summarization using RS and produce a new framework which is modified from the existing framework by Chan and Roddick. However, this study may need to explore reduct in RS analysis process when simultaneously find the best points for data discretization to discovering the optimal accuracy with the optimal rules. According to Kim et al [18], Yang et al [26], Hvidsten [24] and Azar et al [21], the process is known to be an NP-hard problem and are also related to the dimensionality reduction problem. NP problems (NP stands for non-polynomial) need to be approached with approximation algorithms that find good solutions. In this research, to find the right combination of several parameters to generate the rules based on the highest number of support value, less length, and accuracy. Based on previous work [30][18][21], GA is a powerful and effective method for finding problem solutions of particular combinatorial optimization in many applications and applicable for solving the multi-parameter optimization problem. GA is employed due to its effectiveness in finding near-optimal solutions in short computational time for combinatorial optimization problems. Therefore, this study proposes the hybrid approach of Rough Set and GA to improve lack of the RS to ensure of a better result. Hybridization of the proposed method hybrid RS-GA is going to overcome the short come of data summarization method.
3 METHODOLOGY
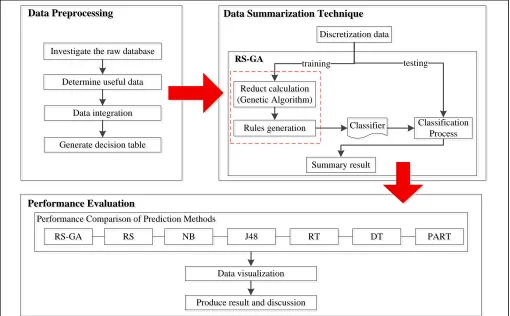
The operational framework provides a guideline to conduct and organized the research properly. The operational framework can see the workflow that divided into several phases of the research that describes the action plan step-by-step as a guide to complete this study. Each phase will require the output to ensure that the research objectives can be achieved successfully. Figure 1 illustrates the operational research framework in detail. The operational framework provides guidelines to conduct and organized the research properly. The operational framework can see the workflow that divided into several phases of the research that describes the action plan step-by-step as a guide to complete this study. Each phase will require the output to ensure that the research objectives can be achieved successfully. Figure 1 illustrates the operational research framework in detail. The experimental setup is the process of preparing all the required configuration to conduct the experiment. It includes the process of definition and designing of the proposed framework, data collection, data integration, and data preprocessing. Designing of the proposed framework is a guideline in conducting proper experimental work by modified the existing research framework. This proposed framework is developed to ensure that the experiment is properly executed and avoid any unexpected errors during the experiment which leads to inconsistent data and improper execution. Figure 2 shows the details of the experimental framework.
Data Preprocessing Data Preprocessing
Data integration Data integration
Generate decision table Generate decision table Investigate the raw database Investigate the raw database
Determine useful data Determine useful data
Performance Evaluation Performance Evaluation
Performance Comparison of Prediction Methods Performance Comparison of Prediction Methods
NB
NB J48J48 RTRT DTDT PARTPART
Data visualization Data visualization
Data Summarization Technique Data Summarization Technique
Produce result and discussion Produce result and discussion
Discretization data Discretization data
Reduct calculation (Genetic Algorithm)
Reduct calculation (Genetic Algorithm)
Rules generation
Rules generation Classification
Process Classification
Process
Summary result Summary result
training testing
Classifier Classifier
RS RS RS-GA
RS-GA
RS-GA RS-GA
1111 3.1 Data Collection
The collection of data is required to run experiments and to describe the type of data to be used in the experiment. It is important to get the expected results for the research. Verification or authentication data that is critical to ensure the scientific community has no qualms to accept the results and conclusions that will be made of the experimental results. The data that is used for this research is the Air Pollutant Index
(API) in Malaysia and Singapore from 2014 until 2015. The sample of datasets from the Malaysian Government Open Data about Air Pollution Index (API) in Malaysia in 2014 until 2015 and the Singapore Government Pollutant Standard Index (PSI) from 2014 until 2015. In the API dataset, each row of the datasets collected 6 fields that contain the number of datasets, the date, time, state, region, and the number of Air Pollution Index (API) with number of the data is 269,512 items.
3.2 Data Preprocessing
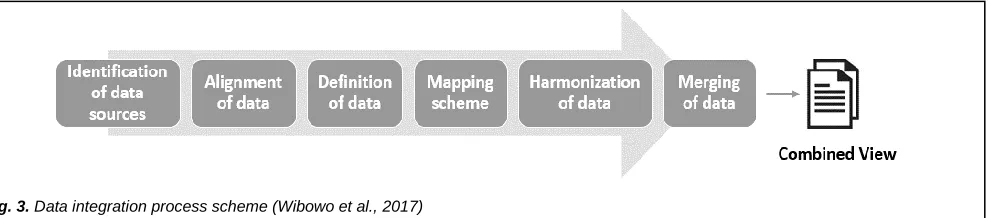
All collected data need to be preprocessed before summarization process starting. The data which is in the real value format will be investigated and identified the meaningful from the attributes of data. Therefore, the useful data inclusion criteria will be determined. In this study, the preprocessing step which consisted of 3 phases such as data cleaning, integration, and transformation was implemented. Data cleaning includes removing duplication of data, checking inconsistent data, and fixing errors of the data. The following kinds of records are unnecessary or irrelevant should be removed by using Microsoft Excel, WEKA and Rosetta tool. Furthermore, data integration dealing with the heterogeneity of the data from a different source. Figure 3 depicts the data integration process. Data integration consist of identification of data sources, alignment of data, data definition, mapping scheme, harmonization and merging of data. By combining data from different sources generating the supply of accurate information as a decision-making process, operational efficiency, and the creation of the desired solution [31][6]. In this research, method for knowledge representation is one of the important elements in processing of data. This representation is generated of the data become a decision table are also called an information system. This decision table is an offer by domain experts and a typical attribute that divide the objects into decision classes or separation of information source [24]. The decision table is generated in this part to support the next processing data. The generation is based on the scope described before. To make the case more specific, the decision table is created based on the standard of API value according to USEPA [32] that is labeled as good, moderate, unhealthy, very unhealthy and hazardous.
3.3 Data Summarization Technique
In this phase, the summarization engine uses RS and GA. This research reconstructs the existing modified database summarization framework by Dasiran [29]. The existing framework produces a new database summarization framework by modifying the proposed framework by Chan and Roddick by embedding rough set to the framework. Therefore, this hybrid method going to enhance the summarization method for better accuracy, effectiveness and appropriate
summary result. This phase consists of discretization data, reducts calculation, rules generation, classification and summary result that implemented by using Rosetta tool [33] Abbas and Burney, 2016). The next phase will explain in detail the experimental result and analysis proses of this research.
4 EXPERIMENTAL
RESULT
AND
ANALYSIS
This phase discusses and illustrates the experiment results and analysis of this research. In this part, pre-processing data as explained well as analysis ML method and the results of the experiment. This study reconstructs the existing modified database summarization framework by using RS and GA. In order to evaluate the performance of the ML method, it is important to measure its performance. Therefore, some common performance measures were used to evaluate the performance of particular ML method including RS, NB, J48, RT, DT, and PART.
4.1 Data Summarization Technique
Data mining was used for analyzing and extract knowledge automatically with one or many methods for air pollutant data to provide useful, effective, and relevant information. Therefore, it can show the areas that have a good condition or not. Besides, this information can also use for predicting future air quality condition in all areas. The methods that were implemented as a summarization engine in this study are RS and GA approach. This hybrid approach going to enhance the summarization method for better accuracy, effectiveness and an appropriate summary result of API data. This implementation was based on Rosetta which contained several RS of learning algorithms as well as a covered hybrid method [32][31][34]. It is recommended that this research run a simple analysis that induced a rule model on one part of the data training in order to set the parameter for Rosetta. Moreover, when using Rosetta, the file format used such as Excel or Access files.
4.1.1. Discretization
process and the inducer results. By decreasing the number of managing values, the mining method becomes more efficient. The datasets from preprocessing phases need to be discretized before classification process started. Generally, the data is characterized by high dimensionality and continuous data parameter (in this case is API values) that need an efficient discretization technique. This step involves searching for cutting the determined intervals that mapped in the same value, in effect converting numerical attributes into symbolic [21][24]. This research was chosen Boolean Reasoning to applied in this process [24]. Boolean Reasoning is a discernibility function that discerns between perceived objects for constructing many entities like reducts, decision rules or decision algorithm. Boolean reasoning is based on finding the solution for a problem P that can be decoded from prime implicants of the Boolean function. Discretization based on Boolean reasoning searches for the set of cuts that correspond to Boolean variables and they is prime implicant for the Boolean function. The combination of these two methodologies (discernibility and Boolean Reasoning) contribute in solving many NP problems like reducts extracting, decision rules, association rules, discretization of real value attributes, pattern extraction from data [21][18][26]. In practice, it is common to divide the available labeled observations randomly into a training and a test set based on k-fold cross-validation (k=10). The training set is used to induce a classifier and the test set is used for estimating the classification performance [16][24][29].
4.1.2. Reduct Calculation and Rules Generation using RS-GA
The reducts are the subset of attributes in the information system which are more important to the knowledge represented in the equivalence class structure than another attribute. With a minimal subset of attributes can generate the rules. For that, this phase is important concept in RS and data reduction [21]. It is the main application for RS in pattern recognition and data mining. Indecision tables, there often exist redundant attributes that do not provide any additional information about the instances. Finding reduct is the process of finding the set of relevant features that preserve the discernibility relation. Searching reduct set is time and space consuming particularly when the decision table is the high dimension. Finding the minimal reduct of a decision table is an NP problem. Computing reducts from a decision table help in
specifying and selecting the significant data from main database [29][21][18]. Future selection process reduces the dimensionality of feature space and computational cost which decreases the storage resource and running time in order to increase the speed of training and improve the predictive accuracy [24][21][18][26]. In this research, GA is used as the reducer. This algorithm can help to search a proper combination of multiple parameters to achieve the greatest level of air pollutant, either minimum or maximum, depending on the requirement of the problem. Therefore, the rules are generated by using GA. Some rules are generated more frequently than the others among the total rule sets. The rules are determined based on the highest number of support value, less length, and accuracy. If no rule is found, the most frequent outcome in the training dataset is chosen. The rules generated will be used for classifier on the classification process. However, more important is the fact that the number of features translates directly in the number of classifier parameter (the number of perceptron or weight in machine learning methods). Therefore, the basic pseudo-code of GA is as follow [35][18].
1. Generate an initial random population of individuals 2. generations = 0
3. Evaluate the fitness of the individuals 4. while the termination condition is not met do 5. Select two individuals (two parents) for reproduction 6. Generate new individuals (the offspring) using
crossover and mutation operators 7. Evaluate the fitness of new individuals
8. Replace the worsts individuals of the population by the best individuals
9. generations = generations + 1 10.end while
11.return the optimal population
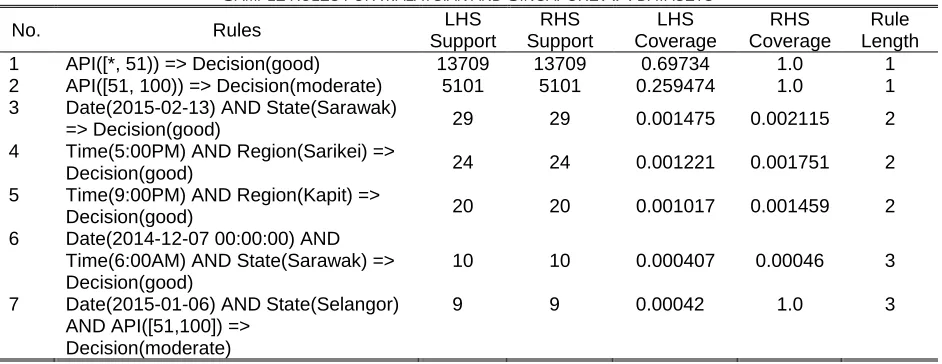
Table 1 presents several rules from the generated rules. The rules classified API into meaningful information for safety and health of population. The sample explanations for rule that given in Table 1 as follows:
Rule 7: Date(2015-01-06) AND State(Selangor) AND API([*,51]) => Decision(moderate).
1113 The description of the rule statistics are as follows:
1) The rule support is 13709, represents 13709 objects in the training data set that are matched with the rule condition. 2) The rule accuracy is 1, represents the number of
Right-Hand Support (RHS) divided by the number of Left Right-Hand Support (LHS):13709/13709= 1.
3) The conditional coverage is 0.69734; it represents the fraction of the records that satisfied the IF condition of the rule. It is obtained by dividing the support of the rule by the total number of records in the training data set.
4) The decision coverage is 1.0, and it is the fraction of the
training records that satisfied the THEN conditions. It is obtained by dividing the support of the rule by the number of records in the training data set that satisfied the THEN condition.
5) The rule length is defined as the number of conditional elements in the IF part. In Rule 1 there is one attribute being used as conditional elements; API.
Based on the generated rules, data that has been summarized after reduct process is 6,509 data from 269,512 data. The generate rules from Malaysia and Singapore dataset can help to determine which areas have appropriate air condition based on the level standard of API. Moreover, it can help the government to makes predictions for time and date when disasters will happen and the right decision for the safety and health of the population in the future.
4.1.3. Classification
Towards a good estimate of the true classification performance, it is important to use a test set that is representative of the observations that the classifier is likely to encounter in the future. A classifier is best evaluated by applying it to a set of unseen observations [24]. For estimating classification performance, the test set is used. Moreover, to get good estimates of the classifier performance, it is important that information contained in the test set is not used in the training. In this phase, the classification result is showing the confusion matrix of the classification performance and show the recognition rate from the dataset. The confusion matrix shows the overall accuracy, as well as the sensitivity and accuracy of each class. The rules generated of each iteration from reduct calculation are also used as a parameter to
classify the object in the test set for the classification process [33][24]. Therefore, the prediction performance is recorded for each test set and variance is computed. Figure 4 shown the sample of confusion matrix from this classification process. The dataset was classified by three levels standard of API are Good, Moderate, and Unhealthy. Based on these levels, the air pollutant in Malaysia and Singapore at the range level Good until Unhealthy and did not reach the Hazardous level that very dangerous for human health. In this range, the Government of Malaysia and Singapore must keep paying attention and improve the system to make the API level is
going down to a good level.
4.1.4. Visualization of Data
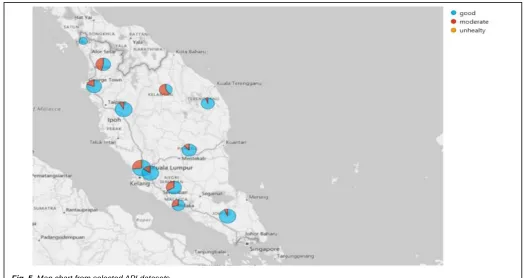
The analysis results of the combination of Malaysia and Singapore API dataset using RS-GA approach can select the significant data from the main database based on the generated rules. The selected dataset is displayed to the charts. Therefore, this is intended to make it easier to present the result of the analysis based on the MAAGs and NEA that have been adapted to the recommendations of the WHO. The dataset classified by three levels standard of API is Good, Moderate, and Unhealthy. Figure 5 depicted APIs in each state in Malaysia and Singapore with their API conditions with the map chart. From this chart showing the highest or lowest API from each state in Malaysia and Singapore. These results also can be an alert to the state where the air quality that is measured to be dangerous for the public because could damage the epidermis, affects the immune reaction, and by mixing pollen, can increase the possibility of allergic diseases such as asthma, allergic rhinitis, and allergic conjunctivitis. It is also possible to give a warning in dangerous areas that has the highest API and the government can also to be aware of TABLE1
SAMPLE RULES FOR MALAYSIAN AND SINGAPORE API DATASETS
No. Rules LHS
Support
RHS Support
LHS Coverage
RHS Coverage
Rule Length 1 API([*, 51)) => Decision(good) 13709 13709 0.69734 1.0 1 2 API([51, 100)) => Decision(moderate) 5101 5101 0.259474 1.0 1 3 Date(2015-02-13) AND State(Sarawak)
=> Decision(good) 29 29 0.001475 0.002115 2
4 Time(5:00PM) AND Region(Sarikei) =>
Decision(good) 24 24 0.001221 0.001751 2
5 Time(9:00PM) AND Region(Kapit) =>
Decision(good) 20 20 0.001017 0.001459 2
6 Date(2014-12-07 00:00:00) AND Time(6:00AM) AND State(Sarawak) => Decision(good)
10 10 0.000407 0.00046 3
7 Date(2015-01-06) AND State(Selangor) AND API([51,100]) =>
Decision(moderate)
9 9 0.00042 1.0 3
this condition.
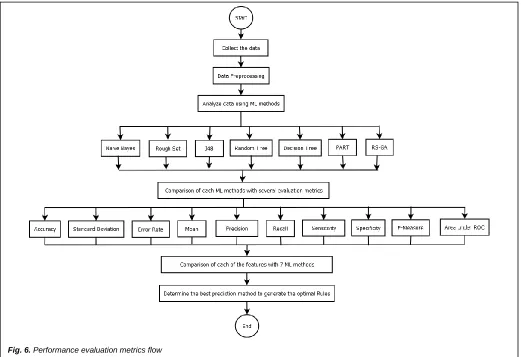
4.2 Performance Evaluation
In this study, the performance and the comparison of the methods that suitable for prediction which is used including RS-GA, RS, NB, J48, RT, DT, and PART. In order to find the efficiency of the proposed work, the classification accuracy obtained using these methods are compared with the accuracy of the proposed RS-GA. Therefore, it will help to determine the best prediction method to investigate and predict the air pollution data for Malaysia and Singapore which is implemented in proposed work based on the level standard of API by MAAGs and NEA that have been adapted to the recommendations of the WHO [36][32]. Based on previous research, this performance metrics from these ML methods that be benchmarked including the accuracy, standard deviation, precision, recall, error rate, sensitivity, specificity, and F-measure were used in this research to evaluate the performance of ML methods [24][16][34][37]. It is important to measure its performance in order to evaluate the performance of ML methods. In this research, the statistical validation to verify the performance of the proposed method were used mean of accuracy and SD. Figure 6 depicts the flow of performance metrics result. Besides, the comparison performance based on mean and SD for RS, NB, J48, RT, DT, and PART used WEKA, then RS-GA by using Rosetta that has been declared in detail in Table 2. Based on Table 2, RS provided high accuracy compared to NB, J48, RT, DT, and
PART with an average accuracy is 96.27% for API datasets. However, hybrid RS-GA was better than RS single-alone because GA is overcome the limitation of RS in NP problem to finding the minimal reduct of the decision table. Moreover, the finding reduct is the process of finding the set of relevant features that preserve the discernibility relation in order to increase the speed of training and improve the predictive accuracy with low error [24][21][26]. Hence, GA is used as the reducer to generate the rules. This RS-GA gave a good result compared to the other methods especially RS single-alone based on trend prediction system used API datasets with a mean of accuracy 99.95%. Besides the mean of accuracy, based on Table 2, RS-GA had the averagely lowest STD, which means low error because the value was nearer to zero. Figure 7 depicts the graph plot that offers the mean of accuracy for API datasets from ML methods. Based on the graph in Figure 7, RS-GA showed the highest percentage of accuracy of prediction and can determine that this method is the best method among others. This method analyzed perfectly the datasets and the process also were not complex. This finding is also supported by other researchers in different fields or domain that proposed RS-GA in their research work [21][18][35][30]. Based on this result, RS-GA was proven to be the best prediction of ML methods in this research field because gave the best accuracy compared with other methods.
1115 The accuracy of ML methods is used for evaluating the
methods as mentioned before. The several previous researchers work with precision, recall, sensitivity, specificity, error rate and f-measure [16][34][24] to support the accuracy prediction alone which is insufficient to measure the performance of datasets. On the other hand, the confusion occurred only in the case of finding True Positive (TP), False Negative (FN), False Positive (FP) and True Negative (TN) [37]. Therefore, the other performance metrics evaluation was also used in this study to evaluate the performance of ML methods. Precision can be thought of as a model’s ability to
discern whether a data is relevant from a returned population while recall can be thought of as a model’s ability to select the data from the population at large [16]. Sensitivity is a probability that a test result will be positive when the disease is present while specificity is a probability that a test result will be negative when disease is not present [16]. Moreover, F-Measure is a measure that combines precision and recall is the harmonic mean of precision and recall. The higher of F-score shows the better is the performance [16]. Table 3 shown the performance metric results from the ML methods for API datasets.
The comparisons showed that RS-GA mostly achieved the highest result value with the lowest error rate. Based on the results output in Table 3, it is concluded that the most significant and best performance metric measurements averagely used RS-GA compared among other ML methods. Table 3 shown the performance metric result by using graph. It also proved that the hybrid of GA was better than RS-single alone. This approach also has the lowest error with the value is closed by zero. Therefore, RS-GA was selected as a proposed method to be used in data summarization to select
the significant data and generate the rules with better prediction accuracy compared to among others.
The result of T-test in Table 4 shows the accuracy of the test set for API datasets. Positive means for dissimilarities in accuracy revealed that the proposed RS-GA for data summarization is significantly better than other ML methods. As evident in the same table, the accuracy criterion for proposed RS-GA for data summarization was significantly better than all other ML methods with p-value < 0.05. It proved RS-GA is better than other ML.
The result of T-test in Table 4 shows the accuracy of the test set for API datasets. Positive means for dissimilarities inaccuracy revealed that the proposed RS-GA for data summarization is significantly better than other ML methods.
As evident in the same table, the accuracy criterion for proposed RS-GA for data summarization was significantly better than all other ML methods with p-value < 0.05. It proved RS-GA is better than other ML methods.
TABLE2
MEAN AND STD THE ACCURACY OF API DATASETS USING SEVEN DIFFERENT ALGORITHMS
Fold
Accuracy (%)
RS NB J48 RT DT PART RS-GA
1 97.31 94.29 97.48 96.73 96.19 97.12 99.93
2 100.00 99.99 100.00 99.67 99.99 99.98 99.96
3 96.16 91.22 96.23 93.39 95.30 95.78 99.85
4 96.05 91.65 95.61 93.59 94.77 95.23 99.89
5 94.59 90.18 94.21 98.41 92.59 93.41 99.89
6 94.72 89.35 94.69 92.45 93.49 100.00 100.00
7 94.43 91.65 94.45 93.32 93.51 93.45 100.00
8 96.16 90.82 95.61 94.08 99.99 95.02 100.00
9 96.72 95.15 96.11 98.91 96.11 96.40 100.00
10 96.59 95.99 96.18 94.40 96.18 96.22 100.00
Mean 96.27 93.03 96.06 95.49 95.81 96.26 99.95
Standard
Deviation 1.55 3.11 1.61 2.54 2.40 2.18 0.06
TABLE3
THE PERFORMANCE METRICS RESULTS OF API DATASETS BY USING ML METHODS FOR PREDICTION
Parameter RS NB J48 RT DT PART RS-GA
Precision (%) 96.28 93.38 96.11 95.81 95.86 96.36 100.00
Recall (%) 96.27 93.02 96.06 95.84 95.82 96.25 99.97
Sensitivity 0.92 0.91 0.92 0.91 0.9 0.91 0.99
Specificity 0.97 0.89 0.97 0.97 0.97 0.98 1.00
F-Measure (%) 96.26 93.09 96.14 95.85 95.78 96.22 99.98
Error Rate 0.03 0.05 0.04 0.04 0.08 0.04 0.0001
1117
5 DISCUSSION
This research analyzed different ML methods used to predict the air pollution data based on the level standard of API by MAAGs and NEA that have been adapted to the recommendations of the WHO. There are several types of ML methods that commonly used for prediction such as RS, NB, J48, RT, DT, and PART. The methods are normally used to enhance the prediction performance, the efficiency, and accuracy of decisions drawn by intelligent computer programmers. Furthermore, the most effective ML methods are required to be implemented in the summarization engine to generate the rules of the data by selecting the significant data from the main database. The result reveals that RS was more precise with better accuracy compared with other methods. RS has become a popular research and has been applied to many domains that are concerned with the classificatory analysis of vague, uncertain or incomplete information or knowledge expressed in terms of data acquired
from experience. Although RS still has a limitation in NP problem to find minimal reduct of a decision table. Finding reduct is the process of finding the set of relevant features that preserve the discernibility relation. In order to improve the predictive accuracy and increase the speed of training, GA is used as a reducer that can help to search a proper combination of multiple parameters to achieve the greatest level of air pollutant, either minimum or maximum, depending on the requirement of the problem. Based on previous research, proven that GA able to conquer problem for solving the computationally intractable problem and dealing with the running time, while also allowing the system to obtain more generalized results and improve the predictive accuracy. Therefore, RS-GA gave a better accuracy than RS-single alone with mean of accuracy is 99.95%. It is also supported by other performance metrics evaluation such as precision, recall, sensitivity, specificity, error rate, and f-measure which provided good results of the evaluation. Based on experimental results of this research field, it has proved that RS-GA is the most effective method as a summarization engine that capable to generate rules by selected significant data from the main database. Hence, the limitation of the existing framework can be enhanced. Besides the RS-GA provided the lowest error which value was nearer to zero compared other methods. RS-GA provided rules for API datasets correspondingly. The rules are significant to determine the condition of air pollution in each state of Malaysia and Singapore. These results also can be an alert to the state where the air quality that is measured to be dangerous for the public because could damage the epidermis, affects the immune reaction, and by mixing pollen, can increase the possibility of allergic diseases such as
asthma, allergic rhinitis, and allergic conjunctivitis. It is also possible to give a warning in dangerous areas that has the highest API and the government can also to be aware of this condition. For that, these rules can also to predict the future of air pollution in each state to reduce the impact of bad haze that might happen again which has been described as the case in 2015; Malaysia has terrible haze from forest fires in Indonesia to provide an overview of the process of decision-making, operational efficiency, and creating the solution for government.
6 CONCLUSION
This study has tried to tackle the critical problems in data summarization by applying rough set and genetic algorithm. For that, this study proposed modification framework based on the previous framework that has been studied and mention it in the previous chapter. The main contribution of this research is adopting the ideas of combining two soft computing methods into
database summarization. In recent studies, there is not any work that introduced this approach into summarization method. It can be said that this research is the first work that has introduced two soft methods in database summarization methods. This study achieved the objectives based on the actual prediction accuracy proved that the hybrid of RS-GA was capable to be used in order to predict the significant data from the main database in database summarization. From the discussion of result analysis, it can be seen that the hybrid approach can improve the database summarization performance better than database summarization with RS-single alone. This is proven that RS-GA is able to conquer the problem for solving the computationally intractable problem and dealing with the performance time that also authorizes the system to improve predictive accuracy and gain generalized results. Besides, it is can help to find the right combination of several parameters to achieve the best predictive accuracy depend on the problem needs. Hence, this study finding has been successful in tackling the problems in the existing framework on database summarization. However, this research still can implement and test into different domain or fields, such as medical domain.
ACKNOWLEDGMENT
This research supported by Universiti Teknologi Malaysia (UTM) and Universitas Ahmad Dahlan (UAD) Yogyakarta Indonesia.
REFERENCES
[1] Zhang, J., & Chen, X. (2012). Research on Intrusion Detection of Database based on Rough Set. Physics Procedia, 25, 1637–1641.
TABLE4
PAIRED SAMPLE T-TEST FOR ACCURACY OF API DATASETS
Paired Sample t-value df p-value
RS-GA - RS 2.37566 9 0.020761
RS-GA - NB 2.22377 9 0.026618
RS-GA - J48 2.42107 9 0.019272
RS-GA - DT 1.72353 9 0.059443
RS-GA - PART 1.69472 9 0.062185
[2] Zhang, X., Mei, C., Chen, D., & Li, J. (2016). Feature selection in mixed data: A method using a novel fuzzy rough set-based information entropy. Pattern Recognition, 56, 1–15.
[3] Jeong, H., Ko, Y., & Seo, J. (2016). How to Improve Text Summarization and Classification by Mutual Cooperation on an Integrated Framework. Expert Systems With Applications, 60, 222–233.
[4] Hesabi, Z.R., Tari, Z., Goscinki, A., Fahad, A., Khalil, I. & Queiroz, C. (2015). Data Summarization Techniques for Big Data – A Survey. Handbook on Data Centers, 1109-1152.
[5] Smits, G., Pivert, O., Yager, R. R., & Nerzic, P. (2018). A soft computing approach to big data summarization. Fuzzy Sets and Systems, 348, 4–20.
[6] Scotti, L., Rea, F., & Corrao, G. (2018). One-stage and two-stage meta-analysis of individual participant data led to consistent summarized evidence: lessons learned from combining multiple databases. Journal of Clinical Epidemiology, 95, 19–27.
[7] Rajkovic, P., Vuc, D., Jankovic, D., Milenkovic, A., & Aleksic, D. (2017). Data summarization method for chronic disease tracking kovic, 69, 188–202.
[8] Vanderhorn, E., & Mahadevan, S. (2018). Bayesian model updating with summarized statistical and reliability data. Reliability Engineering and System Safety, 172(April 2017), 12–24.
[9] Coussement, K., Lessmann, S., & Verstraeten, G. (2017). A comparative analysis of data preparation algorithms for customer churn prediction: A case study in the telecommunication industry. Decision Support Systems, 95, 27–36.
[10]Odelu, V., Das, A. K., Kumari, S., Huang, X. & Wazid, M. (2017). Provably secure authenticated key agreement scheme for distributed mobile cloud computing services. Future Generation Computer Systems, 68, 74–88.
[11]Li, C., Yanpei, L. & Youlong, L. (2016). Efficient service selection approach for mobile devices in mobile cloud. Journal of Supercomputing, 72(6), 2197– 2220.
[12]Vafeiadis, T., Diamantaras, K. I., Sarigiannidis, G., & Chatzisavvas, K. C. (2015). Simulation Modelling Practice and Theory A comparison of machine learning techniques for customer churn prediction. Simulation Modelling Practice and Theory, 55, 1–9.
[13]Nieto, P. J. G., García-Gonzalo, E., & Antón, J. C. Á. (2018). Journal of Computational and Applied A comparison of several machine learning techniques for the centerline segregation prediction in continuous cast steel slabs and evaluation of its performance. Journal of Computational and Applied Mathematics, 330, 877–895. [14]Raza, M. S., & Qamar, U. (2016). An incremental
dependency calculation technique for feature selection using rough sets. Information Sciences, 343–344, 41–65. [15]Wibowo, M., Sulaiman, S., Mariyam, S., & Hashim, H.
(2017). Mobile Analytics Database Summarization Using Rough Set. International Journal of Innovative Computing, 7(2), 6–12.
[16]Kumar, S.S. & Inbarani, H.H. (2015). Optimistic Multi-Granulation Rough Set based Classification for Medical Diagnosis. Procedia Computer Science, 47, 374-382. [17]Srivastava, D., Batra, S., & Bhalothia, S. (2015). Efficient
Rule Set Generation using K-Map & Rough Set Theory (RST), 2(3), 6–10.
[18]Kim, Y., Ahn, W., Joo, K., & Enke, D. (2017). An intelligent hybrid trading system for discovering trading rules for the futures market using rough sets and genetic algorithms. Applied Soft Computing Journal, 55, 127–140.
[19]Pawlak, Z. (1997). Rough Set Approach to Knowledge-Based Decision Support. European Journal Operational Research, 99 (1), 48–57.
[20]Moshkov, M.J., Piliszczuk, M. & Zielosko, B. (2008). Partial Covers, Reducts and Decision Rules in Rough Sets Theory and Applications. Computational Intelligent. Springer, 145.
[21]Azar, A. T., Elshazly, H. I., & Mohamed, A. (2013). Hybrid System based on Rough Sets and Genetic Algorithms for Medical Data Classifications, 1–25.
[22]Janusz, A. & Slezak, D. (2012). Utilization of attribute clustering methods for scalable computation of reducts from high-dimensional data. Proceeding Federated Conference Computer Science Information System, 295– 302.
[23]Kim, K.J. & Ahn, H. (2012). Simultaneous optimization of artificial neural networks for financial forecasting. Application Intelligent, 36 887–898.
[24]Hvidsten, T. (2013). A tutorial-based guide to the ROSETTA system: A Rough Set Toolkit for Analysis of Data. Trhvidsten.Com, (October).
[25]Erickson, Jeff. (2014). NP-Hard Problems. Lecturer Notes in Combinatorial Algorithms. Creative Commons License. [26]Yang, L., Cai, X., Zhang, Y., & Shi, P. (2014). Enhancing
sentence-level clustering with ranking-based clustering framework for theme-based summarization. Information
Sciences, 260, 37–50.
https://doi.org/10.1016/j.ins.2013.11.026
[27]Hesabi, Z.R., Tari, Z., Goscinki, A., Fahad, A., Khalil, I. & Queiroz, C. (2015). Data Summarization Techniques for Big Data – A Survey. Handbook on Data Centers, 1109-1152.
[28]Kedzie, C., Mckeown, K., & Diaz, F. (2015). Predicting Salient Updates for Disaster Summarization, 1608–1617. [29]Dasiran, S. N. M. (2005). Mobile Database Summarization
using Rough Set. Master’s degree Thesis, Universiti Teknologi Malaysia.
[30]Ray, S. S., & Misra, S. (2019). Genetic algorithm for assigning weights to gene expressions using functional annotations. Computers in Biology and Medicine, 104(July 2018), 149–162.
[31]Wibowo, M., Sulaiman, S., Mariyam, S. (2017). Machine Learning in Data Lake for Combining Data Silos. International Conference on Data Mining and Big Data, 10387, 294–306.
[32]Environmental Protection Agency (2014) School Siting Guidelines. Retrieved September 2019, from http://www.epa.gov/schools/guidelinestools/siting/index.ht ml
[33]Abbas, Z., & Burney, A. (2016). A Survey of Software Packages Used for Rough Set Analysis, (July), 10–18. [34]Wibowo, M., Sulaiman, S., Mariyam, S. (2018).
Comparison of Prediction Methods for Air Pollution Data in Malaysia and Singapore. International Journal of Innovative Computing, 8(3), 65–71.
1119 [36]WHO. (2017). Evaluation of WHO air Quality Guidelines:
Past, Present, and Future.