2555
Intelligent Robotic Inspection System Using Image
Processing Technique
Santosh Kumar Sahoo, B.B.Choudhury
Abstract- The objective of the present research work is to develop an intelligent robotic system to identify and classify the defective objects in a bottle manufacturing unit. At this point Artificial Intelligence procedure followed by the different classifier are used in order to classify the defective bottle. The response of the proposed model highlighted that the Least Square Support Vector machine (LSSVM), Linear Kernel and radial basis function has maximum overall performance in terms of Classification rate comparison to others. Thus, the proposed model is a best suitable for classification in a manufacturing unit. The addition of robotic unit also enhances the performance rate as well as more productivity. Here four various machine learning classifiers like KTH NN, ANN, SVM and LSSVM for grouping of defective bottle images. Hence it is perceived that the proposed LSSVM with RBF and kernel are confirmed the higher rate of 96.35 % matched to other classifiers used during the analysis.
Index Terms: Artificial Intelligence. Least Square Support Vector machine (LSSVM), Robotic system, Image Acquisition, Classification rate
————————————————————
1.
I
NTRODUCTIONIt is necessary to scrutinize the bottle perfectly in a manufacturing unit in order to increase the quality of the product. Hence the detection and classification of damaged bottle at the manufacturing end is a complicated task. So, the proposed method will be much soothing and is suitable for classification of damaged one if trained well, and subsequently the corrective action will be continuing at a primary phase of the manufacturing process as a result the quality of the product can be maintained in a smooth manner.
Deepa et. al [1] described an automated vision-based defect inspection and sorting system for a plastic injection mold known as a retractor retaining bush by using various types of sensors and actuators. Xiaoguang et.al.[2] adopt the concepts of multi-instance classifiers for the recognition of mines on the sea- bed from multiple side scan sonar views. Jinglong et al. [3] reviews the developments of wavelet transform (WT) and the applications in rotating machinery fault diagnosis (RMFD). Renjini et al. [4] described the basic concepts of wavelet transforms and brief idea of recent published works dealing with applications of wavelet theories. Yubin et al. [5] introduced a construction of dual wavelet for Image Edge Detection where they used Sobel and Canny filter for comparison purpose. Bruylants et.al. [6] investigated regarding optimally compression of volumetric medical Images with JP3D and the volumetric wavelets and the entropy-coding improves the Compression performance. Nie et al. [7] explained the image segmentation by histogram thresholding and Class Variance Criterion. Bo Cai1et al. [8] described the image segmentation by using gradient guided active contours. Nitin Sharma et al. [9] described the scheming of complex wavelet transform with directional properties and its application. Tsung-Ching et al. [10] described the variety of arrhythmia Electro Cardio graphic signal utilized for optimizing scheme of quantization with wavelet techniques for ECG data using Genetic Algorithm (GA). Alarcon et al.
[11] explained the results of some compression of wavelet transforms and thresholding methods. The Support Vector Machine (SVM) technique is an intelligent machine learning algorithm having significant performance and more benefits over other approaches for solving recent signal and image processing tasks. Similarly, an ANN specimen is widely used in various fields related to non -linear utility estimation and classification because of its pliability and practicality. At this stage, our proposed research work aims to develop a system to classify damaged bottle by means of AI- centered classifier which will direct several structures of images and categorize them into a specific group of bottles like damaged bottle or defect free bottles. In the meantime, the identified defective bottle can be segregate by Robot attached with this system. The detailed functional diagram of an anticipated model is presented in Fig.-1. Here several pattern recognition techniques are applied using various features pull out from 95 bottle images. Here four various machine learning classifiers like KTH NN, ANN, SVM and LSSVM for grouping of defective bottle images. Hence it is perceived that the proposed LSSVM with RBF and kernel are confirmed the higher rate of 96.35 % matched to other classifiers used during the analysis.
Fig-1 Schematic functional block diagram of an intelligent inspection system
————————————————
Dr. Santosh Kumar Sahoo is currently working as Associate Professor in the department of EIE, CVR College of Engineering, Hyderabad. India, E-mail: [email protected]
Dr. B. B. Choudhury is currently working as Associate Professor and Head of Production Engineering at IGIT, Sarang, Odisha, India. Email: [email protected]
Vision System Reference
Image sensor NI-1722
Image processor
Controller
Object to be inspected
2556
2 M
ETHODOLOGYThe methodology of the proposed model is sequenced as follows.
2.1 Image Acquisition
This section describes the acquisition of image by an image sensor like Smart Camera with a 1280x1024 resolution of a bottle from the manufacturing unit. In order to develop a datasets different types of bottle images are captured. Block diagram for an intelligent classifier model explained in Fig .2. After capturing all the images for different types of bottle, they are filtered using a band pass filter which removes unwanted noise if present.
Fig.2 Block diagram for an intelligent classifier model
After acquiring the bottle image, it is necessary to segment it from the image background by an application of image segmentation techniques. This image segmentation is accomplished by means of gradient and morphological procedures. This Segmented bottle mostly varies as of the related images by image disparity. An image Gradient can distinguish the discrepancy shown in fig.4 which is again modified to a certain level to acquire segmented images. The segmented image for defective is displayed in Fig.3.
Fig.3 segmented image Fig.4The mask Gradient value
2.2. Feature Extraction: Different statistical parameters are calculated using wavelet transform. Initially, four level decomposition is done, and some features are extracted. The coefficients for them are calculated and using those coefficients, the features (a) Mean, (b) RMS, (c)Standard deviation, (d) Skew-ness, (e) Entropy and (f)power are obtained.
(a) Mean ( ) : It is usually used to describe numerical data that is normally distributed. Mean is average of all values. It is referred to a central value of discrete sets of values. If the values are considered to be numbers
like X1, X2….Xn, then [11] 1 1
M n
X x
M
(1)
(b) Standard Deviation (x ): It is a measure of the spread of a set of values from the average value. Or in other word it represents spread of data around mean. If there is large standard deviation, then the data is farther from mean. So small standard deviation means the data is closer to mean. If ―X‖ is a variable with meanx, the standard deviation is given as [11]
N
n n x
X Z
N x
1 1
(2)
(c) Skewness: It represents lack of symmetry. It is a third moment of distribution of data
(d) Entropy: It is a measure of randomness of a signal. It is a statistical feature which can be used in representation of an image. Higher the entropy, higher disorder and vice versa. It can be represented as [11]
:e n x
1
) 2 log(
(3)
(e) Power: Estimation of power is one of the most frequently used methods of image analysis which provides information about the basic rhythms present in the image signal and can be easily calculated by means of Fast Fourier transform i.e., FFT. It can be
calculated as[11] : Power=
) (
2
X L
X
(4)
(f) RMS Value: Which is known as quadratic mean. This is a statistical measure of the magnitude of a varying quantity which is useful when variants are positive and negative. In case of a set of values, x1,x2,x3…..xn then the RMS value is given
by[11]: 2 ... 2)
3 2 2 2 1 ( 1
n X X
X X n RMS
X .
(5)
1
2
1
0
0
0
1
2
1
Smoothing by Low Pass filter,
Gaussian
Chief Histogram, Tamura, wavelet
Transforms
Classifying the Object
KNN, ANN, SVM, LSSVM Image
Acquisition Noise Removal Extraction Feature
2557 It can be calculated for discrete values.
Apart from this the various features from an image can collect and reducing the dimensionality. Here the different features are extracted from both defective and non-defective bottle pictures. The Tamura texture features extraction technique is applied to excerpt different features like crudeness, distinction and directionality of 95bottle images. As Wavelet cantered texture features used normally for the fetidness. So here, the 3 level 2D wavelet decomposition methods are used to evaluation of different coefficients of an image in Vertical, Horizontal and Diagonal way are presented in pyramidal structure in fig.5.
Approximate Value Image-3 Horizontal detailed value of
image-3 Horizontal detailed value of image-2 Horizontal detailed value of image-1 Vertical detailed value of image-3 Diagonal Detailed value of image-3 Vertical detailed value
of image-2
Diagonal Detailed
value of image -2 Diagonal Detailed value of image-1 Vertical detailed value of image-1
Fig.5 Pyramidal structure of a wavelet decomposition
Again, by considering the above features a training and a testing data sets are developed in which 95 features of a bottle image is reduced to 25 by means of principal component analysis (PCA). These training and testing data are taken as input to the classifier. The proposed structure reflected 55% circumstances as training of the compressed data and others as testing. The individual classifier enactment is presented in terms of classification rate (CR) can be conveyed as:
Classification rate (CR) =
) ( ) ( FN FP TN TP TN TP (6)
Where TP- True positive no., TN= True negative no., FP= False positive no., FN= False negative no. Now, Wavelet constants are found in a pixel is stated as [12]:
Y) (X, y) φ F(x, mxn 1 N) M, , (J w 1 m 0 x 1 n 0 y N JM, φ
(7) d} v, {h, I , Y) (X, y) F(x, mxn 1 N) M, (J, w 1 m 0 x 1 n 0 y N M, J, I I ψ (8)
Where
n m , J, I
(x,y)=2 2 (PJx m, PJy n)
J
andJ m,n(x,y)=
) , ( 2 2 n y P m x
PJ J
J
are the scrambled and
converted base functions. Where the value of P=2. Now an energy is intended laterally in all the ways like, Vertical, Horizontal and Diagonal (Figure.4). As 3 level of decomposition is used so the energy for each wave let
coefficient is stated as: l 0 I l 0 J 2 ) J I, l, c, (w lxl 1 cl e (9)
Where,
w
C,l,I,J is the coefficient of wave let at [I, J]location. As 9 features are attained for a single wavelet coefficient thus for 3 level disintegration of a solo image by using wavelet transform, total 81 features are extracted. The proposed technique is continual for all images, i.e. defective and defect free object class and by gathering all the information related to an image then a data set is formed in order to providing the input variable and the output. A binary value ‗0‘ is assigned to represent the output for a non-defective object and ‗1‘ for a defective object. And by using PCA the dimensions of feature datasheet are reduced.
3. R
ESULTS AND DISCUSSIONS:
K-NN used as classifier for two classes viz., defective and defect free. From total database some values are selected for classification and accuracy is obtained
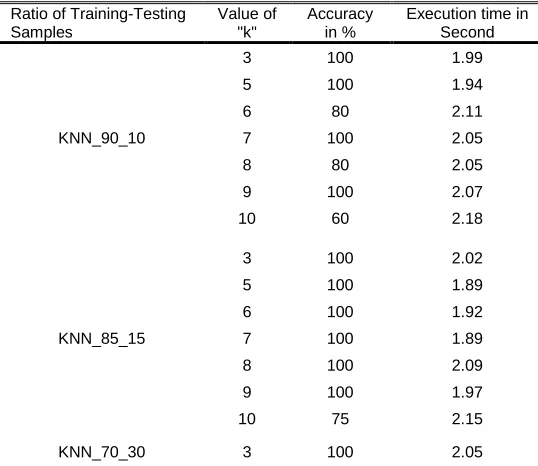
Accuracy: = (10)
From the table I, it is observed that for different values of ―k‟ different accuracies are obtained. As shown in above table, for four different combinations i.e. when the training samples are 90% and testing samples are 10%. Similarly, other training and testing samples are chosen such as 85_15, 70_30, 65_35. Accuracy is calculated by selecting values of ―k‖ for 3, 5, 6,7,8,9 and 10. Maximum accuracy is obtained for the minimum value of ―k‖ i.e. k=3, 5 while for k=7 also gives maximum accuracy with less execution time. Accuracy has been obtained using formula (10) mentioned above.
TABLE 1
ACCURACY AND EXECUTION TIME FOR DIFFERENT VALUES
Ratio of Training-Testing Samples
Value of "k"
Accuracy in %
Execution time in Second
KNN_90_10
3 100 1.99
5 100 1.94
6 80 2.11
7 100 2.05
8 80 2.05
9 100 2.07
10 60 2.18
KNN_85_15
3 100 2.02
5 100 1.89
6 100 1.92
7 100 1.89
8 100 2.09
9 100 1.97
10 75 2.15
KNN_70_30 3 100 2.05
2558
5 100 1.98
6 87.8 1.96
7 76 1.94
8 76 2.01
9 87.6 1.9
10 50.2 2.03
KNN_65_35
3 100 1.98
5 100 1.95
6 77.9 1.98
7 66.8 1.91
8 77.9 1.97
9 88.8 1.89
10 77.9 2.05
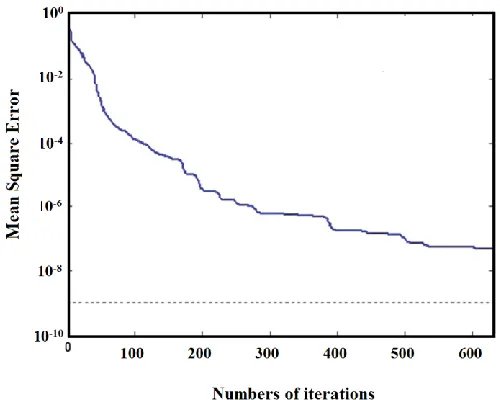
Also, above results show that optimized value for ―k‖ is obtained to be 3, 5 and 7 where k-NN gives maximum accuracy. Further the accuracy for KNN_90_10 combination of training and testing samples is compared with standard results and it is observed to be giving correct accuracy here also. In Fig.6 the deviation of Mean Squared Error (MSE) w.r.t the number of iterations relatively specifies that the MSE regularly declined while the number of iterations enlarged more than thousand times. The CR is perceived here as 91.78% shown in Table-2. By considering the classification degree of the analyzed data, results of support vector machine classifier are estimated. A proposed SVM model competent with linear and Kernel RBF functions in-order to acquire improved trial information Again the trial information can test by SVM linear and radial basis kernel classifier which adjusted and trained earlier. Now the valuation of trial information is articulated through confusion matrix (CR), conveyed in Table-2. Hence Table 2 signifies the presentation of LSSVM classifier in terms of classification rate (CR). Moreover Table 2 also proves that the LSSVM by kernel radial basis function and linear kernel has maximum precision of 96.35% during object classification.
Fig.6. Deviations of error w.r.t total iterations in Multi feed neural network classifier
Hence it is decided that LSSVM with RBF kernel classifier is the best classifier among all used in the present analysis for the classification of defective object and defect free object.
4. C
ONCLUSIONS:
From the results of k-NN classification, it is observed that for k=3, 5 maximum accuracies are obtained. Further for the k=7, maximum accuracy as well as appropriate computational time is obtained. For four different configurations of training and testing samples accuracy is calculated. The performance of k-NN classifier is observed which provides computationally good classification. It is based on distance function therefore for different values of ―k‖ different accuracies are obtained. So, this method to classify the emotions with the help of k-NN classifier is efficient enough. By using the morphological way of image analysis, which forecast the defective bottles in the manufacturing process in a precise manner. Current research utilizing the pattern recognition is effectively realized to categorize the defective and defect free bottle from refined principal images. The actual contests are involved for documentation of structures. These structures are effectively categorized as defective and defect free bottle by several artificial intelligence classifiers like KTH nearest neighbour, Artificial Neural Network, Support Vector Machine, Least Square Support Vector machine. The proposed LSSVM functional blocks effectively demonstrated as a best analytical tool with advanced classification rate of 96.35% for analysis.
5.
R
EFERENCES:[1] Deepa R, Usha S, P V Shashi Kumar, Advanced Materials Manufacturing & Characterization Vol- 4 Issue 1, pages:26-31, 2014
[2] Xiaoguang Wang1, Xuan Liu1 , Nathalie Japkowicz2 , Stan Matwin3,Journal of Artificial Intelligence and Soft Computing Research. Volume 4, Issue 2, Pages 133–148, 2015. TABLE 2
THE CLASSIFIERS PERFORMANCE TABLE
Classifiers TP FP TN FN Classification rate (CR) Multi feed Neural
network 28 1 11 3 91.78%
Linear kernel SVM 31 10 2 0 86.84% RBF kernel SVM 28 0 12 3 94.06% LSSVM with linear
Kernel 29 0 12 2 96.35%
LSSVM with Radial
2559 [3] Jinglong Chena, Zipping Lia, Jun Pana, Gaige
Chena, Yanyang Zia, , , Jing Yuanb, Binqiang Chenc, Zhengjia Hea , Volumes 70–71,Pages 1– 35,Elsevier,2015
[4] Renjini L, Jyothi R L, International Journal of Computer Trends and Technology (IJCTT), V-21(3), Pages: 134-140, 2015.
[5] Yubin Li, IJSP, Image Processing and Pattern Recognition Vol.8, No.7, Pages.151-160, 2015. [6] Tim Bruylantsa,,Adrian Munteanua,, Elsevier,
Volume 31, Pages.112–133 ,2015.
[7] Fangyan Nie and Pingfeng Zhang IJSP, Image Processing and Pattern Recognition Vol.8, No.7, pages.79-88, 2015.
[8] Bo Cai12, Zhigui Liu2, Junbo Wang2, and Yuyu Zhu2, International Journal of Signal Processing, Vol.8, No.7, pages.51-62, 2015. [9] Nitin Sharma, Anupam Agarwal and Pawan
Kumar Khyalia, Signal & Image Processing: An International Journal (SIPIJ) Vol.5, No.3, 2014. [10]Tsung-Ching Wu, King-Chu Hung, Je-Hung Liu,
Tung-Kuan Liu: , Scientific
Research,Pages.746-753,2013.
[11]V. Alarcon-Aquino1, J. M. Ramirez-Cortes2, P. Gomez-Gil2, The Open Cybernetics & systemic Journal, Vol.-7, pages.32-38, 2013.
[12]Dr. Ashish Panat, Prof. Mrs Anita Patil and Miss. Gayatri Deshmukh, IRAJ conference, 2014.
[13]Wen-Jiao Zai , International Conference on
Wavelet Analysis and Pattern
Recognition,2007.