i ~
INTERACTION OF SULPHUR WITH PHOSPHORUS AND POTASSIUM IN
GROUNDNUT NUTRITION IN CALCAREOUS SOIL
A.L SINGH AND VIDYA CHAUDHARI
National Research Centre for Groundnut, P.B. No.5, Evenagar Road, Junagadh - 362 001, Received on 29 December, 1994. Revised on 6 November, 1995
SUMMARY
Pot experiments conducted in calcareous soil have shown that application of S, along with K and P in the soil, increased the nodulation, podding and pod and haulm yields of groundnut and also the concentration and uptake of these nutrients by groundnut. Sulphur had synergistic effect both with K and P on the yield and nutrients concentration and uptake. The P and K doses caused significant increase in all the parameters upto 150 kg/ha of P (as P20 S) ' and 100 kg/ha of K (as ~O). However, S was beneficial to groundnut upto 50 kg/ha. The increase in the concentrations and uptake of K and P by groundnut due to the application of K and P, were more pronounced with S than without S. On the other hand the effect of S on the concentrations and uptakes of K, P and S was more pronounced at higher levels of K and P than at their lower levels.
INTRODUCTION with S when applied in combination. The present pot experiments, therefore, were conducted to study the Groundnut being a major oilseed crop is cultivated
effects of S, with and without P and K in calcareous soil, world-wide on almost all soil types. But due to its
on the growth, yield and nutrient contents and uptake by underground pod bearing habit it is preferred on light
groundnut. textured soils generally deficient in S and P and to some
extent K also (Bell, 1985: Kanwar et ai., 1983: Singh et MATERIALS AND METHODS
ai., 1991: Tandon, 1991). The problem of nutrient Pot experiments were conducted, during the dry and deficiencies are more pronounced in calcareous soils of wet seasons at the National Research Centre for Saurashtra, a dominant groundnut belt (Dwivedi, 1988: Groundnut, Junagadh. The soil was medium black Singh et ai., 1991). The Sulphur deficiency in groundnut calcareous (18.5% CaC0
3), clayey (58 % clay and 12 % occur in young upper leaves as chlorosis, causing yield sand) which contained 0.9 % organic carbon, 0.056% reduction upto 40% (Supakamnerd et ai., 1990: Singh et total N, 5.2 mg/kg available P (Olsen P), 10 mg/kg ai., 1990). The P and K deficiencies, however, occur very available S (heat soluble), 0.4 meq/ 1 OOg soil exchangeable late on the lower leaves causing poor pod bearing and K and pH 7.7. Two separate experiements were conducted kernel filling. These deficiencies are generally neglected for two seasons. Ten kg of soil was filled in Polythene for the want ofclear -cut symptoms. More over by the time lined earthen pots. Two experiments were conducted these deficiencies are diagnosed in the field, it is too late with bunch ground nut cv. GG2
to rectify it, in the standing crop, to prevent the yield
Experiment I
losses. The prevention of these deficiencies with soil
22 A.L. SINGH AND VIDYA CHAUDHARI
(per 10 kg soil) in two sets. In one set of pots, elemental sulphur (containing 80% S) at 0.31 glpot (50 kg Slha) was added while the other set was not provided with sulphur. In all there were ten treatments, with three replications. Urea at 500 mg
N/pot
and potassium chloride at 500 mg Kfpot were added uniformly in these pots.Experiments II
Experiment was conducted in factorial CRD to test the effectiveness of K and S and their interactions. The potassium doses were 0,50, and 100 kg ~Olha, (0, 0.42, and 0.84 g KCIIpot or per 10 kg soil). The sulphur doses were: 0, 25 and 50 kg SIha (0, 0.16 and 0.31 glpot of elemental S). In all there were nine treatments with three replications. Urea at 500mg
N/pot
and sodium dihydrogen phosphate at 500 mgP/pot
were added uniformly in these pots.In both the experiments sowing were done at the rate of four seeds per pot. Pots were irrigated to saturation capacity on the first day ofsowing and later with adequate water on alternate day. The dry and wet seasons groundnut crops were sown in the first week of February and July, respectively and harvested in the first week of June and the third week of October. At pegging (45 DAE) leaf samples were collected to determine the concentration of nutrients. After maturity the plants from each pots were harvested, separated into nodules, pod and haulms (leaves and stems), dried in the sun for about a week and weighed. The plant height (length of largest branch) and pod number in each pot were detennined.
The plant samples taken at 45 DAE and at harvest were washed and dried in oven at 50°C for about a week and weighed. The oven dried plant samples were ground to a fine powder and analyzed for P by colorimetry, S by turbidimetry (Chaudhary and Cornfield, 1966) and K by
flame
photometry. The uptake of these macronutrientswas calculated by multiplying the nutrient concentrations with their respective dry matter. The data were analyzed statistically.
RESUL TS AND DISCUSSION
Growth, yield and yield attributes
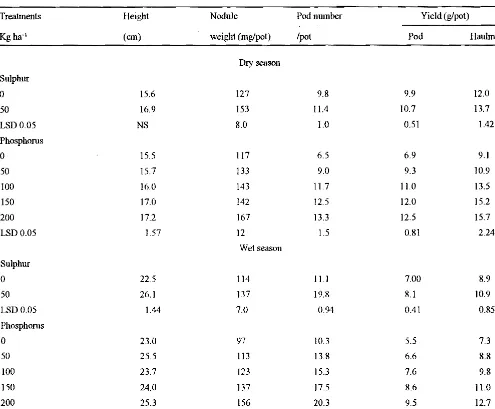
The application of S and P increased nodulation, podding and pod and haulm yields of groundnut during both the seasons (Table I). However, increase in plant height due to S was observed during wet season only and due to P only during dry season. Phosphorus application
increased plant height over control, but their various doses did not show significant variations. Increasing the P doses increased pod number and haulm yield up to 100 kgIha, pod yield upto 150 kgIha and nodule weight upto 200 kg/ha during dry season, but during wet season all these parameters increased significantly upto 200 kgIha. Kulkarni et al. (1986) in a field study reported the increase in nodule number and mass upto 50 kg/ha ofP. The recommended field dose of P is 30.,60 kgIha PP5 depending upon the season (lCAR, 1987) however, in calcareous soil ofSaurashtra, being deficient in P, response to P even at high levels was observed as reported earlier (Singh et aI., 1991). The increase in nodule weight and pod yield due to sulphur application has also been reported earlier, (Singh et al., 1995) and this study further confirms this in the presence of P.
The interaction effects of P and S were not observed on the plant height, pod number, and nodule weight during both the season, but it was noticed on the pod and haulm yield during wet season only (Table 11). The pod and haulm yields increase with increasing P doses at both the levels of S, but the significant increase due to S was observed at 150 kg Plha and above. This clearly indicated that at lower levels of P, the S and P did not show much interaction, but at higher levels of P the synergistic effect of S on pod and haulm yields was noticed.
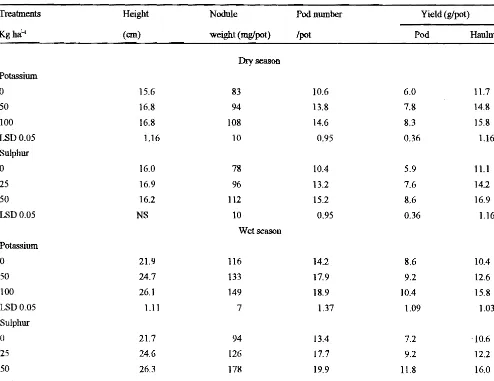
In second experiment, application of K and S caused significant increased in nodulation, pod number, and pod and haulm yields of groundnut during both the seasons (Table III). Sulpur was beneficial to groundnut upto 50 kg/ha. Potassium increased the pod yield and nodule weight during both the seasons and haulm yield during wet season upto 100 kg Klha. However, the number of pods during both the seasons and haulm yield and plant height during dry season increased only upto 50 kg
KIha.
The increase in plant height due to K application was observed during both the seasons and due to S during wet season only. There was no interaction effect ofSand K .on
the plant height, nodulation and yields.
•
Nutrient concentrations and uptake
Table. I: Influence of sulphur and phosphorus on plant height, nodulation, pod number and yield of groundnut.
Treatments Height Nodule Pod number Yield (glpot)
Kgha-1
(em) weight (mglpot) lpot Pod Haulm
Dry season
..
Sulphur0 15.6 127 9.8 9.9 12.0
50 16.9 153 11.4 10.7 13.7
LSD 0.05 NS 8.0 1.0 0.51 1.42
Phosphorus
0 15.5 117 6.5 6.9 9.1
50 15.7 133 9.0 9.3 10.9
100 16.0 143 11.7 11.0 13.5
150 17.0 142 12.5 12.0 15.2
200 17.2 167 13.3 12.5 15.7
LSD 0.05 1.57 12 1.5 0.81 2.24
Wet season Sulphur
0 22.5 114 11.1 7.00 8.9
50 26.1 137 19.8 8.1 10.9
LSD 0.05 1.44 7.0 0.94 0.41 0.85
Phosphorus
0 23.0 97 10.3 5.5 7.3
50 25.5 113 13.8 6.6 8.8
100 23.7 123 15.3 7.6 9.8
150 24.0 137 17.5 8.6 11.0
200 25.3 156 20.3 9.5 12.7
LSD 0.05 NS 11.0 1.45 0.66 1.33
Table II: Interaction effects of sulphur and phosphorus on pod and haulm yield and P and S uptake by groundnut at harvest during wet season.
Phosphorus Yields (glpot) Nutrient uptake (mglpot)
doses Pod Haulm S P
Kgha-I
So SolO So SolO So SolO So SolO
0 5.3 5.8 7.0 7.7 16.4 20.3 20.1 22.6
50 6.5 6.7 8.7 9.0 20.7 24.0 26.3 27.9
i 100 7.1 8.0 9.3 10.3 22.0 29.8 29.6 34.2
150 7.7 9.5 9.3 12.7 23.9 35.8 33.0 44.0
200 8.4 10.6 10.3 15.0 26.8 43.3 39.3 53.8
24 AL. SINGH AND VIDYA CHAUDHARI
Table. III:
In:t1uence of sulphur and pbosphorus on plant height, nodulation, pod number and yield of groundnut.Trea1ment8 Height Nodule Pod number Yield (glpot)
Kgha'-I (em) weight (mgIpot) /pot Pod Haulm
Dry season Powsium
o
15.6 83 10.6 6.0 11.750 16.8 94 13.8 7.8 14.8
100 16.8 108 14.6 8.3 15.8
LSD 0.05 1.16 10 0.95 0.36 1.16
Sulphur
o
16.0 78 10.4 5.9 11.125 16.9 96 13.2 7.6 14.2
50 16.2 112 15.2 8.6 16.9
L.."lDO.05 NS 10 0.95 0.36 1.16
Wet season Potassium
o
21.9 116 14.2 8.6 10.450 24.7 133 17.9 9.2 12.6
100 26.1 149 18.9 10.4 15.8
LSD 0.05 1.11 7 1.37 1.09 1.03
Sulphur
() 21.7 94 13.4 7.2 '10.6
25 24.6 126 17.7 9.2 12.2
50 26.3 178 19.9 11.8 16.0
LSD 0.05 1.11 7 1.37 1.09 1.03
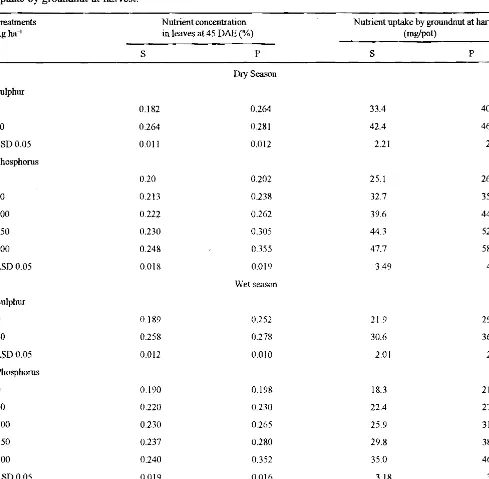
dry season and upto 50 kg PIha only during wet season. The concentration of P, however, increased at all the levels ofP during both the seasons. The uptake of both S and P due to S and P applications increased mainly because of increased concentrations of these nutrients in plant tissues and pod and haulm yields at higher levels of P and S.
The adequate P concentration of leaf tissues at flowering is 0.25-0.35% (Foster, 1980 and Dwivedi, 1988) and this was achieved only at 100 kg/ha P and onwards. However, the adequate S concentration in leaves is reported to be 0.2-0.3% (Supakamnerd et al., 1990) and this was achieved at 50 kg/ha of S. This clearly indicate that S and P fertilization is essential to maintain the adequate S and P concentrations in groundnut tissues in calcareous soil in order to increase yield
There was no interaction effect of P and S on the concentrations of P and S in leaves during any of the season, but such effect on their uptake during wet season was noticed (Table ll). The effect of P on the uptake of both P and S was more pronounced with S than without S. Likewise the uptake ofS due to S application increased significantly upto 100 kg PIha and uptake of P due to S increased upto 150 kg Plha. Thus the effect of S on the
uptake of S and P was more pronounced at higher levels <Ii
of P than at lower levels.
Table IV: Influence of sulphur and phosphorus on concentrations ofP and S in leaves at pegging (45 DAE) and their
uptake by groundnut at harvest.
Trea1ments Nutrient concentration Nutrient uptake by groundnut at harvest
.'
Kg ha-I in leaves at 45 DAE (%) (mglpot)S P S P
Dry Season
Sulphur
0 0.182 0.264 33.4 40.9
50 0.264 0.281 42.4 46.2
LSD 0.05 0.011 0.012 2.21 2.79
Phosphorus
0 0.20 0.202 25.1 26.4
50 0.213 0.238 32.7 35.9
100 0.222 0.262 39.6 44.5
150 0.230 0.305 44.3 52.5
200 0.248 0.355 47.7 58.5
LSD 0.05 0.018 0.019 3.49 4.41
..
Wet season
Sulphur
"
0 0.189 0.252 21.9 29.750 0.258 0.278 30.6 36.5
LSD 0.05 0.012 0.010 2.01 2.31
Phosphorus
0 0.190 0.198 18.3 21.4
50 0.220 0.230 22.4 27.1
100 0.230 0.265 25.9 31.9
150 0.237 0.280 29.8 38.5
200 0.240 0.352 35.0 46.5
LSD 0.05 0.019 0.016 3.18 3.65
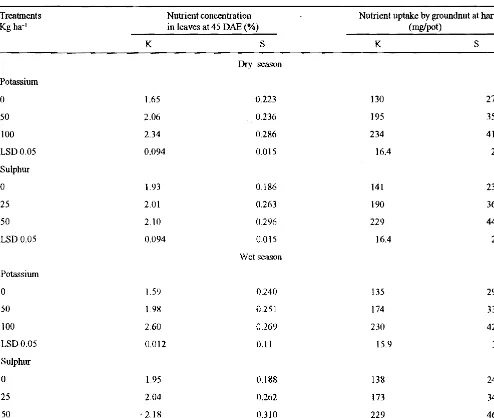
to increase in yield and nutrient concentrations. The only (Table VI). Increase in S levels at 0 and 50 kg K/ha nonnal K concentration of groundnut leaves is between did not increase K concentration of leaves, but at 100 kg L6-3.0%(Dwivedi, 1988: Jonesetal., 1991) and in this K/ha both the doses ofS increased K concentration in study the adequate K concentration was obtained at 50 kg! leaves. The S concentration of leaves on the other hand
ha ofK and above indicating that K and S fertilization is increased both due to increase in Sand K levels. The essential for growing groundnut in calcareous soil. uptake of K and S, however, increased both due to
26 A.L. SINGH AND VIDYA CHAUDHARI
Table
V: Influence of sulphur and potassium on concentrations of Sand K in leaves at pegging (45 DAB) and their uptake by groundnut at harvest.Treatments Nutrient concentration Nutrient uptake by groundnut at harvest
Kgha-1 in leaves at 45 DAE (%) (rng/pot)
K S K S
Dry season
Potassium
0 1.65 0.223 130 27.0
50 2.06 0.236 195 35.3
100 2.34 0286 234 41.8
LSD 0.05 0.094 0.015 16.4 2.05
Sulphur
0 1.93 0.186 141 23.5
25 2.01 0.263 190 36.2
50 2.10 0.296 229 44.4
LSD 0.05 0.094 O.oI5 16.4 2.05
Wet season
Potassium I
0 1.59 0.240 135 29.3
50 1.98 0.251 174 33.5
100 2.60 0.269 230 42.7
LSD 0.05 0.012 0.11 15.9 3.55
Sulphur
0 1.95 0.188 138 24.6
25 2.04 0.262 173 34.5
50 '2.18 0.310 229 46.4
LSD 0.05 0.12 O.oIl J5.9 3.55
Table
VI: Interaction effects of sulphur and potassium on the concentration ofK and S in the leaves at pegging (45 D AE) and their uptake by groundnut at harvest during dry season.Treatments Nutrient concentration Nutrient uptake by groundnut at harvest
Kgha-' (%) in leaves at 45 DAE (mglpot)
K S K S
So S25 Sso So S15 S~o So Su Sso So Su Sso
Ko 1.63 1.60 1.70 0.16 0.23 0.28 107 123 160 18.0 26.9 36.0
K~o 2.07 2.00 2.10 0.19 0.25 0.27 154 197 235 25.5 36.7 43.6
K100 2.10 2.43 2.50 0.21 0.31 0.34 162 248 291 26.9 45.0 53.6
ACKNOWLEDGEMENTS
We gratefully acknowledge Dr. P. S. Reddy, Director,
..
National Research Centre for Groundnut (NRCG),Junagadh, and Mr. Y.C. Joshi, Head, Plant Physiology, NRCG for providing facilities during the course of investigation.
REFERENCES
Bell, M.l (1985). Phosphorus nutrition ofpeanut (Arachis hypogaea L) on cockatoo sandy of the ord river irrigation area. Aust. J. Expt. Agric., 25: 649-653.
Chaudhary, T.A. and Cornfield, AH. (1966). The detennination of total sulphur in soil and plant material. Analyst, 91: 528-531. Dwivedi, RS. (1988). Mineral Nutrition ofGroundnut. Metropolitan
Book: Co. New Delhi, India, 135 pp.
Foster,H.L. (1980). The influence ofsoil fertility on cropperfonnance in Uganda D. Groundnut. Trop. Agric., 57: 29-42.
ICAR. (1987). Fertilizer use in groundnut. Technologies for Better Crops 30: ICAR, New Delhi/II P.
Jones, (Jr) I.B., Wolf, B. and Mills, H. A (1991) . Plant Analysis Handbook:. Micro-Macro Publishing Inc. Georgia, U.S.A., 213 pp.
Kanwar, IS., Nighawan, H.L. and Raheja, S.K. (1983). Groundnut Nutrition and FertiliZ<;,r Response in India. Publ. ICAR, New Delhi India, 185 pp.
Kulkarni, J.H., Joshi, P.K. and Sojitra, V.K. (1986). Influence of phosphorus and potassium application on nodulation, nitrogen accumulation and pod yield ofgroundnut. Legume Res., 9: 34 38.
Singh, AL., Chaudhari, Vidya and Koradia, v.G. (1991). Foliar nutrition of nitrogen and phosphorus in groundnut. In.D. N. Tyagi et al., (eds) Physiological Strategies for Crop ImprovementProc. Inti. Con! PlantPhysiol. B.H.U. Varanasi, pp. 129-133.
Singh, AL., Chaudhari, Vidya, Kordadi, V.G. and lala, P.V. (1995) Effect ofexcess irrigation a1ld iron and sulphur fertilizers on the chlorosis, dry matter production, yield and nutrient uptake by groundnut in calcarious soil. Agrochimica, 39: 184-189. Singh, AL., Joshi, Y.C., Chaudhari, Vidya and Zala, P.v. (1990).
Effect ofdifferent sources of iron and sulpur on leafchlorosis, nutrient uptake and yield of groundnut. Fert. Res., 24: 85-96. Supakamnerd, N., Dell, H. and Bell, R.W. (1990). Diagnosis of
sulphur deficiency in peanut (Arachis hypogaea) by plant analysis. In Plant Nutrition Pbysiology and Application Beusi chern M.L. ed. Proceedings of the XI International Plant Nutrition Colloquium 30 July-4 August 1989, Wageningen, Netherland, Kulwer Academic Publishers. Dordrecht pp. 791 795.