Shock Wave Turbulent Boundary Layer
Interaction in a 2-D Compression Corner
ASMELASH HAFTU AMAHA
Department of Mechanical Engineering (Gas Turbine Technology), Defence Institute of Advanced Technology Girinagar, Pune-411025, Maharashtra, India
AMARJIT SINGH
Department of Aerospace Engineering, Defence Institute of Advanced Technology Girinagar, Pune-411025, Maharashtra, India
ROSCHELLE R. MARTIS
Department of Aerospace Engineering, Defence Institute of Advanced Technology Girinagar, Pune-411025, Maharashtra, India
Abstract:
A computational study has been carried out to analyze the supersonic shock wave turbulent boundary layer interaction in a 2-D compression corner for a free stream Mach number of 2.94. The study has been done for a unit Reynolds number of 36.4x 10⁶ per meter and 200 corner angle. The model has been analyzed using 2-D numerical simulations based on a commercially available Computational Fluid Dynamics (CFD) Code that employs k-ω Shear Stress Transport (SST) turbulence model. The substantiation of the CFD code and the turbulence model used is obtained by comparing with the experimental results available in literature. Comparison of the surface pressure distribution with experiment exhibited good engineering agreement. Numerical results indicate that the extent of the separated zone has increased and thus show increased separation and reattachment points when compared to experiment.
Keywords:Compression corner, Shock wave, Shock wave/Boundary layer Interaction, Supersonic flow
1. Introduction
The phenomena of shock-wave / turbulent boundary layer interactions (SWTBLIs) is frequently encountered on the surfaces of aeronautical/aerospace devices like air intake compression ramps of an air breathing propulsion system, jet nozzles, control surfaces and various parts of high speed vehicle. The knowledge of the boundary layer which develops on the walls of these components is essential to optimise the use of these vehicles or equipments. The separation of this boundary layer or its disturbance by a shock wave are two phenomena, which can involve increase of losses of total pressure, high peak heat transfer rates, hence drag and can sometimes even be catastrophic if the shock is strong enough to cause separation [1, 2, 3]. SWTBLIs are a fact of life in the practical world of supersonic flows and that is why valuable attention is given here.
A significant amount of work has been under taken to study turbulent shock-separated compression corner flows. Some of the authors who have extensively studied the flow field in a compression corner include: (Delery (1985) [1]), (Daniel Arnal and J.M. Delery (2004) [2]), (A.B. Oliver et al (2007) [3]), and (Settles et al (1994) [4]).
This research work focuses on a significantly separated 200 2-D compression corner flow-field of Mach number 2.94 to find out the extent of the separation bubble which causes increase in losses and thereby adversely affects the performance. It is hoped that a more physical representation of the SWTBLI in the corner region will improve the capability to predict the surface pressure and wall shear stress for these interactions.
2. Theory
interaction. Compression corner interaction, which corresponds to a control surface or an air-intake compression ramp, is one of the above mentioned types of interactions considered in this paper.
Compression Corner/Ramp Flow:
The compression corner interaction comes when supersonic flow along a flat plate is compressed by a wedge or ramp of angle α. When the ramp angle α is small, the overall flow structure is not much affected by the interaction taking place at the ramp origin. The main difference is a spreading of the wall pressure distribution, the step of the inviscid solution being replaced by a progressive rise between the upstream pressure level p0 and the final value p1 corresponding to the oblique shock equations.
When the ramp angle α is increased (hence the shock strength), the upstream influence distance (L0 defined as the distance between the interaction onset and the ramp origin) increases accordingly and a situation can be reached where the pressure rise is high enough to induce separation of the boundary layer (Figure 1). In this situation:
1. The ramp upstream influence, hence upstream influence length Lo, has considerably increased. 2. A first shock associated with separation forms well upstream of the ramp.
3. A second shock originates from the reattachment region on the ramp which intersects the separation shock at a short distance from the wall [3, 5-7].
Fig.1. The structure of a ramp flow with boundary layer separation [2]
3. Solution Methods
Grid generation and boundary conditions:
Two-dimensional, high-speed, turbulent flow simulations (with air as the fluid) are performed for a flow over a ramp at free-stream Mach numbers (M0= 2.94). The simulations are performed using commercial CFD software. The flow conditions and simulation setups used are given in this section.
Fig .2. Grid system (computational domain)
To study the flow-field of the interaction, the basic compression corner geometry used in [3, 4] has been adopted for the present study, primarily due to the availability of experimental data. Fig 2 shows the basic mesh details of the ramp. It has a ramp of angle α=200, capture height of 356mm, flat plate length equal to 711mm and corner length of 57mm. Computations were made with three different grids [Grid 1 (43000 cells), Grid 2 (63000 cells) and Grid 3 (103500 cells) ] in two blocks with a wall spacing of 1.25.10-6m. A typical grid distribution adopted near the corner region is shown in figure 2. Density based implicit solver with upwind second order
L
α p0
discretisation scheme for flow and transport equations was adopted. The second-order upwind scheme provides stability and higher order accuracy for supersonic flows and capture shocks better at cell faces through a Taylor series expansion of the cell-cantered solution about the cell centroid. Convergence criteria were considered when residuals have fallen by four orders and measurement of shear stress at different locations converged to four significant digits. The software is commercially available software that solves steady state and time accurate CFD problems on structured/unstructured grids. The commercial software has several solvers for both incompressible and compressible flows in both an implicit and explicit numerical framework.
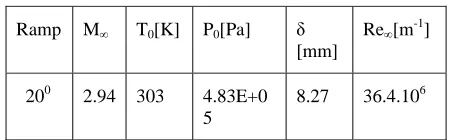
Values of total pressure, P0, total temperature, T0, has been defined at the inflow boundary, and Mach number and static pressure, P∞ has been defined on the boundary opposite the viscous wall (isothermal). The out flow was assigned extrapolation. A convergence criterion for the residuals of all equations has been set to 10-6. Turbulent Intensity and viscosity ratio of 1 has been used. Boundary layer thickness (δ0) computed from simulation was 8.5mm.
Table1. Free stream and inflow boundary layer data
Table 2. Reference values used in data reduction
4. Results and Discussions
Results from the test case computed by the CFD Code are presented in this section along with discussion. Where possible, each case uses the same non-dimensionalizing reference values used in the literature describing the dataset and are given in table2. Converged solution has been obtained with modified k-ω (SST) turbulence model and small differences exist between turbulence model and experimental data in the separation region. Plots of surface pressure distribution, wall shear stress, x-velocity distribution and density contour etc are presented. Simulation result of the ramp flow (α=200) generally show that the computed pressure peaks tend to show an overly steep rise in pressure near the separation point. Model results are presented below.
Fig. 3. Plot of density contours near the corner region
Looking at the contour plot in figure 3, we observe the separation and reattachment shock waves. The density contour shows more clearly the separation and reattachment shocks emanating from the separation and reattachment regions respectively, and their intersection indicates a slight bend from which a stronger shock appears due to merging of the two left running shocks. For this type of shock-shock interaction, the reflected wave and slip line are indicated in figure 1. This is by no means one of the possible wave interactions in a
Ramp M∞ T0[K] P0[Pa] δ [mm]
Re∞[m-1]
200 2.94 303 4.83E+0 5
8.27 36.4.106
Ramp δRef[m] MRef VRef[m/s] PRef[Pa]
supersonic flow. However, this represents one of the most common situations encountered frequently in practice.
Fig. 4. X velocity versus x coordinate
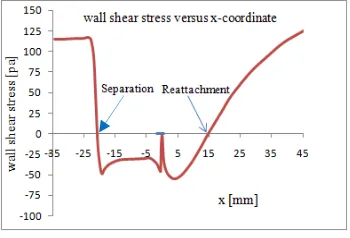
Plot of x-velocity versus x-coordinate is shown in figure 4. This figure shows the velocity on the wall, ramp, and default interior region. The locations of separation point (x=-19.5mm) and reattachment point (x=15.1mm) are obtained from the plot. These points are obtained in the same way from wall shear stress (figure 5)
Fig. 5. Plot of wall shear stress distribution
Figure 5 shows the x-wall shear stress distribution on the 200 ramp. For this case the wall shear stress from the upstream boundary layer is very high, and the SST model shows separation too early. The negative wall shear stress shows the region of reversed flow.
Fig. 6. Plot of wall pressure distribution (SST Model)
recovering boundary layer. The reversal in which SST model better predicted the surface pressure and wall shear stress seems to indicate that these differences are within the experimental uncertainty.
5. Conclusions
Flow has been simulated for a 200 compression ramp at M0 of 2.94. Using the density contours, a fully separated situation has been observed explicitly showing the separation and reattachment shocks. The surface pressure distribution predicted by the CFD Code for the 2-D compression ramp based on SST Model has shown greater tendency to separate, possibly an effect of the lower Reynolds number. The apparent shift in the experimental and simulation wall pressure distributions on the 200
ramp is in a good comparison with the available experimental results and thus SST model has predicted the separation region earlier.
Acknowledgment
The authors are sincerely thankful to Defence Institute of Advanced Technology, Girinagar, Pune-411025, Maharashtra, India, for supporting this work.
References
[1] J.M. Delery: “Shock Wave Turbulent Boundary Layer Interaction and its Control,” Aerospace Sci. Vol. 22, pp. 209-280, 1985. [2] Daniel Arnal and Jean Delery: Shock Wave Boundary Layer Interaction, NATO, May 2004.
[3] A. B. Oliver et al: “Assessment of Turbulent Shock-Boundary Layer Interaction Computations Using the OVERFLOW Code,” School of Aeronautics and Astronautics Purdue University, January 2007.
[4] Gary S. Settles and Lori j. Dodson: “Hypersonic Shock/Boundary Layer Interaction Database: New and Corrected Data,” NASA Contractor Report 177638, April 1994.
[5] K.Sinha, K. Mahesh et al: “Modelling the effects of shock unsteadiness in Shock turbulent Boundary Layer Interactions,” AIAA Journal Vol. 43, No. 3, March 2005.
[6] J. S. Shang, W. L. Hankey Jr. “Numerical Simulation of Shock Wave-Turbulent Boundary Layer Interaction,” AIAA Journal Vol. 14, No.10, October 1976
![Fig.1. The structure of a ramp flow with boundary layer separation [2]](https://thumb-us.123doks.com/thumbv2/123dok_us/9642068.1492168/2.612.215.399.541.636/fig-structure-ramp-flow-boundary-layer-separation.webp)