Optimization of the Process Parameters of
Semi-solid Forging of A356 Aluminum
Alloy
Randhir Kumar
Department of Forge Technology,
National Institute of Foundry and Forge Technology (NIFFT) Ranchi, India-834003
Niranjan Kumar Singh
Department of Forge Technology,
National Institute of Foundry and Forge Technology (NIFFT) Ranchi, India-834003 Rajkumar Ohdar*
Department of Forge Technology,
National Institute of Foundry and Forge Technology (NIFFT) Ranchi, India-834003 *corresponding author: Tel: +916512292081 (O); Fax: +916512290860; e-mail: rkohdar@ yahoo.com Abstract:
Light weight structural materials especially Al-alloys play an important role in achieving vehicle weight reduction and improving fuel economy in the automotive industry. Semi-solid forging (SSF) is a recent advancement in forging technology. This process involves the heating of billet to the semi-solid state in a coexisting liquid and solid phase and subsequently forging. The primary objective of this paper is to analyze the influence of the process parameters on hardness and wear characteristics in the Semi-Solid Forging of A356 aluminum-alloy using Taguchi method. In Taguchi method, a three level orthogonal array has been used to determine the S/N ratio. Analysis of variance and the forging test values are used to determine the most significant process parameters affecting the mechanical properties of A354 Al-alloy. The results indicate that Forging temperature and Die preheating temperature are the influential parameters to create appreciable improvement in the mechanical properties of the Semi-Solid Forged components.
Keywords: Semi-solid Forging, Taguchi Method, Process Parameters, ANOVA.
1. Introduction
Light weight structural materials especially Al-alloys play an important role in achieving vehicle weight reduction and improving fuel economy in the automotive industry. A rise in consumption of Al alloys in car and lightweight truck market has been observed in last two decades. Semi-solid processing is one of the methods of producing spheroidal morphology of the phases and a good materials processing method to traditional casting and forging [Sirong et al. (2006)]. The advantages of semi-solid processing of alloys have longer die life, minimization of hot tearing tendency and modification of dendritic structure into globular structure, improvement in mechanical properties etc [Fan (2002) and Kirkwood (1994)]. Semi-solid metal processing may be used to make the components of complex shape with higher in quality than die castings and lower in cost than forgings. Semi-solid forging is a mushy state metal forming process that produces near net-shape parts in a single step. It reduces production costs, increase productivity and competitiveness and enhances fluidity of the materials [Sang-Yong et al. (2001) and Yoon et al. (1999)]. Muammer Koc et.al [1996] used finite element simulations to predict the deformation behavior and the load requirement of semi-solid forging of A356 aluminum alloy.
The main purpose of this paper is to establish the significant factors that influence the metal flow of A356 Al-alloy during the SSF process. This can be determined through a series of experiments. However, such experiments will be expensive and time-consuming. Design of experiment (DOE) techniques like the Taguchi method, the response surface methodology, etc. can optimize process parameters with minimum experimental runs. Enormous amount of research has been conducted for determining optimal process parameters of various manufacturing processes [Ho et al. (2004); Alauddin et al. (1997) and Dhavlikar et al. (2003)].
The SSF process parameters namely, Forging Temperature, percent reduction and die preheating temperature each at three levels is considered in this work and the details are presented in Table 1. Selection of an appropriate orthogonal array based on the chosen process parameters is the prime aim in the Taguchi method. The total degrees of freedom for three parameters in each of three levels are six. Then, a three level orthogonal array (L9 34) with nine experimental runs [degrees of freedom = 9−1 = 8] is selected for the present research. Orthogonal array (OA) is nothing but the shortest possible matrix of combinations in which all the parameters are varied at the same time and their effect and performance interactions are studied simultaneously.
Table 1: Process Parameters with Levels
Process Parameters Level 1 Level 2 Level 3
A: Forging Temperature (0C) 540 560 580
B: Percent Reduction (%) 0.4 0.6 0.8
C: Die Temperature (0C) 150 200 250
An array’s name indicates the number of rows and columns it has, and also the number of levels in each of the columns. Thus, the array (L9 34) has nine rows and four columns of three levels. With the selection of (L9 34) orthogonal array, using four parameters and three levels for each, the number of experiments required can be drastically reduced to nine, which in classical combination method using full factorial experimentation would require 34 = 81 number of experiments to capture the influencing parameters. The SSF process parameters namely Forging Temperature (A), percent reduction (B) and die preheating temperature (C) are assigned to the first, second and third columns of (L9 34) array, respectively.
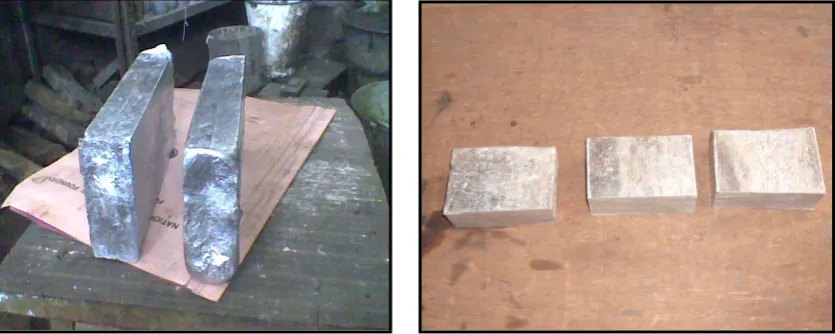
3. Conduct of the Experiments and Data Collection
Figure 2: (a) Hydraulic Press (b) Semi-Solid Forged sample
4. Results and Discussion
After the collection of data, they are analyzed by means of calculating S/N ratio. The S/N ratio is simply a quality indicator by which the effect of changing a particular process parameter on the performance of the process or product is evaluated. In general, a better signal is obtained when the noise is smaller, so that a larger S/N ratio yields better final results. That means, the divergence of the final results becomes smaller. The S/N ratio for larger-is-better target of each experimental run is calculated based on the following equation, and the values are listed in Table 2.
10 ∑ (1)
Where n is the number of measurements in a trial (here n=3) and yi is the ith response for each noise repetition
Table 2: Results of (L9) Orthogonal Array Experiments
Expt. No
Process Parameter Assignment
Hardness (BHN) Average Hardness
(BHN)
S/N Ratio
A B C 1 2 3 4
1 540 0.4 150 50.3 47.5 47.5 44.9 47.550 33.5220
2 540 0.6 200 74.1 79.6 74.1 79.6 76.850 37.6962
3 540 0.8 250 53.4 60.5 56.8 60.5 57.800 35.2033
4 560 0.4 200 60.5 69.1 64.6 69.1 65.825 36.3279
5 560 0.6 250 60.5 64.6 60.5 64.6 62.550 35.9105
6 560 0.8 150 64.6 60.5 69.1 64.6 64.700 36.1893
7 580 0.4 250 47.5 60.5 60.5 56.8 56.325 34.8826
8 580 0.6 150 79.6 79.6 74.1 79.6 78.225 37.8542
9 580 0.8 200 60.5 69.1 64.6 69.1 65.825 36.3279
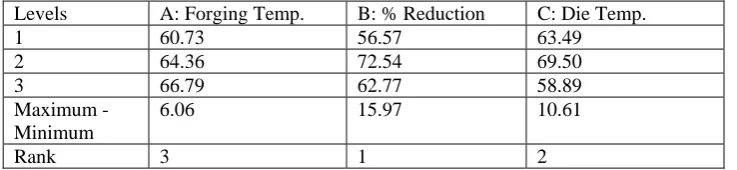
ANOVA computation is performed for evaluating the significance of the process parameters over hardness. Table 3 and Table 4 show the average effect response for raw data and S/N ratio. From Table 5 it is observed that percent reduction is the most significant factor for the response hardness.
Table 3: Average Effect Response for Raw Data
Levels A: Forging Temp. B: % Reduction C: Die Temp. 1 60.73 56.57 63.49 2 64.36 72.54 69.50 3 66.79 62.77 58.89 Maximum -
Minimum
6.06 15.97 10.61
Levels A: Forging Temp. B: % Reduction C: Die Temp.
1 35.47 34.91 35.86
2 36.14 37.15 36.78
3 36.35 35.91 35.33
Maximum - Minimum
0.88 2.24 1.45
Rank 3 1 2
Table 5: Computation of ANOVA
Source of Variation DOF SS MS F Ratio P Value
A: Forging Temp. 2 55.77 27.88 0.43 0.700
B: % Reduction 2 389.13 194.57 2.99 0.250
C: Die Temp. 2 169.80 84.90 1.31 0.434
Error 2 129.97 64.98
Total 8 744.66
DOF: Degree of Freedom; SS: Sum of Squares; MS: Mean of Squares 4.1 Response Graphs
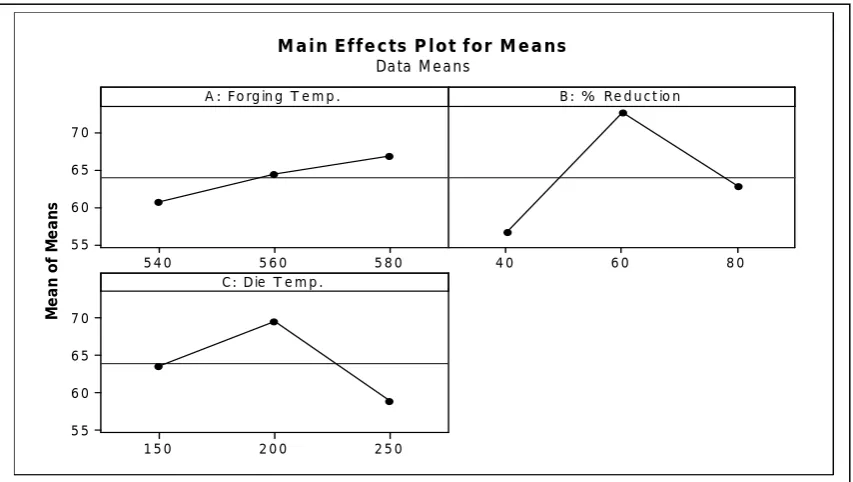
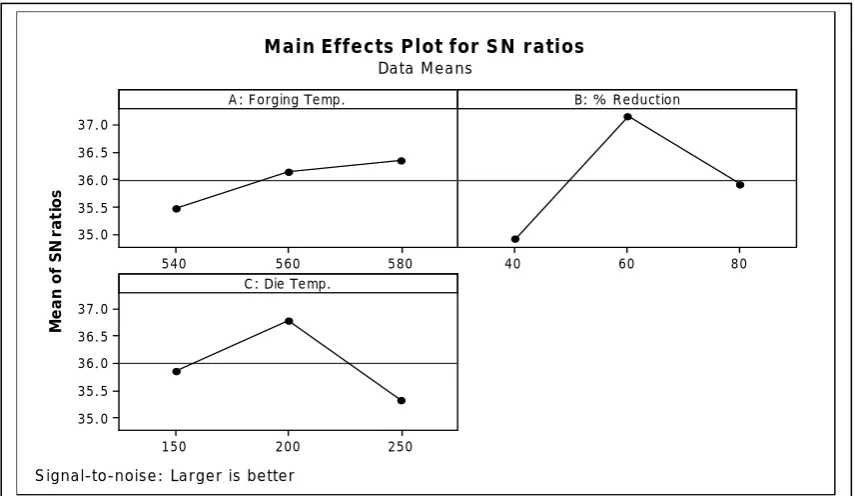
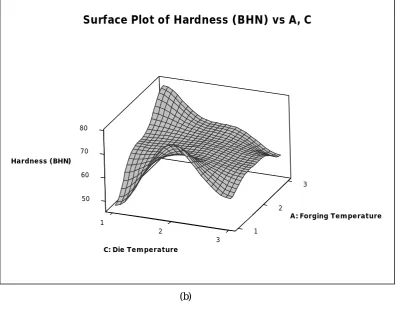
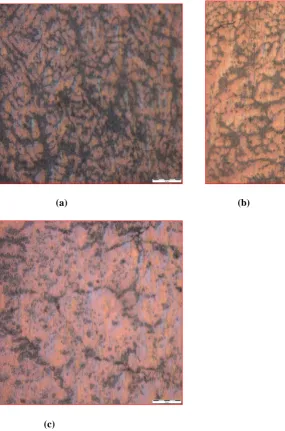
The response graphs exhibit a pictorial view of variation of each parameter and describe what the effect on the system performance would be, when a parameter shifts from one level to another. Figure 3 shows response for hardness for all the parameters. Figure 4 shows response for S/N ratio, as an example, level two for percent reduction (B2 = 60%) has the highest S/N ratio value, which indicates that the SSF performance at such level produces minimum variation of the response hardness. The three dimensional representation of the response surface for hardness illustrates the importance of the input process parameters as shown in Figure 5. The microstructure of the forged sample at optimum level of process parameters is shown in Figure 6.
Figure 3 Main Effect Plot for Hardness 5 8 0
5 6 0 5 4 0
7 0 6 5 6 0 5 5 8 0 6 0 4 0
2 5 0 2 0 0
1 5 0 7 0
6 5
6 0
5 5
A : Fo rg in g T e m p .
Me a n o f M e a n s
B: % Re d u c t io n
C: Die T e m p .
M ain Effects P lot for M eans
Figure 4 Mean S/N Ratio Plot for Hardness
3 50
2 60
70
1 80
2 1
3
Hardness (BHN)
A: Forging Temperature
B: Percent Reduction
Surface Plot of Hardness (BHN) vs A, B
(a)
580 560
540 37.0
36.5 36.0 35.5 35.0
80 60
40
250 200
150 37.0
36.5 36.0 35.5 35.0
A : Forging Temp.
M
e
a
n
of
S
N
r
a
ti
os
B: % Reduction
C: Die Temp.
Main Effects Plot for S N ratios Data Means
3 50
2 60
70
1 80
2 1
3
Hardness (BHN)
A: Forging Temperature
C: Die Temperature
Surface Plot of Hardness (BHN) vs A, C
(b)
3 50
2 60
70
1 80
2 1
3
Hardness (BHN)
B: Percent Reduction
C: Die Temperature
Surface Plot of Hrdness (BHN) vs B, C
(c)
The microstructure obtained after forging the sample at 5400C and different percent reduction are shown in Figure 6.
(a) (b)
(c)
Figure 6: Forged Sample at 540°C (a) 40%, (b) 60% and (c) 80% Deformation 10X Magnification
5. Conclusion
[1] Sirong, Yu.; cheng, L.D.; Kim, N. (2006): Microstructure Evolution of SIMA Processed Al 2024, Materials Science and Engineering A, 420, pp. 165-170.
[2] Fan, Z. (2002): Semi-Solid Metal Processing, Int. Mater. Rev., 47, pp. 49-85.
[3] Kirkwood, D. H. (1994): Semi-Solid Metal Processing, Int. Mater. Rev., 39, pp. 173-189.
[4] Sang-Yong, L.: Jung-Hwan, L.: Young-Seon, L. (2001): Characterisation of A7075 Alloys after Cold Working and Heating in the
Semi-Solid Temperature Range, Journal of Materials Processing Technology, 111, pp. 42-47.
[5] Yoon, J. H.; Im, Y.T.; Kim N. S. (1999): Rigid–thermoviscoplastic finite-element analysis of the semi-solid forging of Al2024, Journal
of Materials Processing Technology, 89–90, pp. 104–110.
[6] Muammer, Koc.; Vazquez, V.; Witulski, T.; Altan, T. (1996): Application of the finite element method to predict material flow and
defects in the semi-solid forging of A356 aluminum alloys, Journal of Materials Processing Technology, 59, pp. 106-112.
[7] Ho, Der; Mao, W.; Sheng, C. (2004): Use of Taguchi method to develop a robust design for the magnesium alloy die casting process,
Materials Science and Engineering A, 379, pp. 366–371.
[8] Alauddin, M.; El Baradie, M.A.; Hashmi, M.S.J. (1997): Prediction of tool life in end milling by response surface methodology,
Journal of Materials Processing Technology, 71 (3), pp. 456–465.
[9] Dhavlikar, M.N.; Kulkarni, M.S.; Mariappan, V. (2003): Combined Taguchi and dual response method for optimization of a centerless