A NOVEL HYBRID METHOD FOR
GENE SELECTION IN MICROARRAY
BASED CANCER CLASSIFICATION
P.RAJKUMAR
Department of Electrical and Electronics Engineering, PSG College of Technology, Coimbatore, Tamilnadu, India
Dr.ILA.VENNILA
Department of Electrical and Electronics Engineering, PSG College of Technology, Coimbatore, Tamilnadu, India
K.NIRMALAKUMARI
Department of Electronics and Communication Engineering, Bannari Amman Institute of Technology, Sathyamangalam, Tamilnadu, India
Abstract:
Microarray technology allows researchers to measure the expression levels of many thousands of genes in a single experiment. One of the main applications of the microarray technology is cancer classification in which the problem associated with the analysis is to deal with high number of gene expression data that makes the processing more complex and time consuming. This paper aims to develop a classification algorithm by employing a hybrid method for gene selection. The hybrid method uses Analysis of variance (ANOVA) statistical technique and Principal Component Analysis (PCA) method that overcomes the problem by reducing the gene expression data in to minimal number of gene subsets (Differentially Expressed genes). Then k-nearest neighbors (KNN) classifier is applied on those gene subsets for cancer classification. Two publically available datasets namely leukemia, lung cancer data sets are used for classification. Experimental results shows that, the cosine and pearson’s correlation distance function with ties rule provide higher classification accuracy and less misclassification error for those differentially expressed genes using different validation methods in KNN classifier.
Keywords: Microarray; ANOVA; PCA; KNN; Classification.
1. Introduction
DNA microarrays offer the ability to look at the expression of thousands of genes in a single experiment as suggested by Schena et al. (1995). One of the important applications of microarray technology is cancer classification. With microarray technology, researchers will be able to classify different diseases according to different expression levels in normal and tumor cells, to discover the relationship between genes, to identify the critical genes in the development of disease. A main task of microarray classification is to build a classifier from historical microarray gene expression data, and then it uses the classifier to classify future coming data. Due to the rapid development of DNA microarray technology, gene selection methods and classification techniques are being computed for better use of classification algorithm in microarray gene expression data as suggested by Chai et al. (2001) and Xiaosheng Wang et al. (2011). The analysis of large gene expression data sets is a becoming a challenge in cancer classification. So gene selection is one of the critical aspects as demonstrated by Li et al. (2002), Diaz et al. (2005), Hua et al. (2005) and Jirapech et al. (2005).
In unsupervised analysis, the data are organized without the benefit of external classification information. Hierarchical clustering, K-means clustering, or self-organizing maps are examples of unsupervised clustering approaches that have been widely used in microarray analysis. Soliman, T.H.A et al. (2010) used clustering with statistical analysis as a preprocessing step for obtaining better classification accuracy. In Supervised analysis, the entire data set is divided into training set and a testing set and it also involves construction of classifiers, which assign predefined classes to expression profiles. Once the classifier has been trained on the training set and tested on the testing set, it can then be applied to data with unknown classification as said by Wang et al. (2007). Golub et al. (1999) used a k-nearest neighbor strategy to classify the expression profiles of leukemia samples into two classes: acute myeloid leukemia and acute lymphocytic leukemia and some other classification algorithms used by Yoonkyung Lee et al. (2003) were SVMs and Genetic algorithms were used by Liu et al. (2001) and Naïve bayes classifiers were used by Keller et al. (2000).
Classification method to classify the causality of a disease is of two stages with gene selection mechanism with individual or gene subset ranking as the first stage and classification tool with or without dimensionality reduction as the second stage was proposed by Wong et al. (2008). A survey of the application of machine learning algorithms to classification and diagnosis of cancer based on expressions profiles is provided by Markus et al. (2003). Dudoit et al. (2002) compared the performance of different discrimination methods for the classification of tumors based on gene expression data. The methods included the nearest-neighbour classifier, linear discriminant analysis and classification trees.
In the present paper, we concentrate on the feature selection ANOVA method for finding minimum number of gene subsets (differentially expressed genes) followed by the PCA method for further reduction in gene subsets, then the classification accuracy for those gene subsets is obtained for different distance metrics and ties rule using KNN classifier method. Experiments shows very encouraging results for cancer classification using cosine and Pearson’s correlation distance metrics and ties rule in KNN classifier for the two publically available datasets. The paper is organized as follows. Section 2 describes the two datasets used in the experimentation, Section 3 illustrates the ANOVA model, PCA and KNN classifiers, Section 4 describes the experiments and results and Section 5 presents our conclusions.
2. Datasets used in the experimentation
Two datasets are utilized in this work to show the effectiveness of the proposed algorithm. The datasets are leukemia and lung cancer dataset.
1) Leukemia cancer dataset by Armstrong et al. (2001): This dataset consists of DNA microarray gene expression data of human leukemia for cancer classification. Three types of leukemia data are provided namely acute lymphoblastic leukemia (ALL), acute myeloid leukemia (AML) and mixed lineage leukemia (MLL) samples. There are 24 samples in ALL, 28 samples in AML and 20 samples in MLL, which are subdivided into training and test samples and used for analysis.
2) Lung cancer dataset by Gordon, et al. (2002): The lung cancer is a disease in which certain lung cells don't function right, divide very fast, and produce too much tissue forming a lung tumor. There are 181 tissue samples among which 31 samples belong to MPM (Malignant Pleural Mesothelioma) and 150 belong to ADCA (adenocarcinoma). Each sample is described by 12533 genes which are subdivided into training and test samples and used for analysis.
3. The Proposed method for cancer classification
The ANOVA statistical test reduces the input gene expression data in to differentially expressed gene subsets (genes which are statistically distinguished among different experimental configurations). Then these differentially expressed genes are classified using KNN.
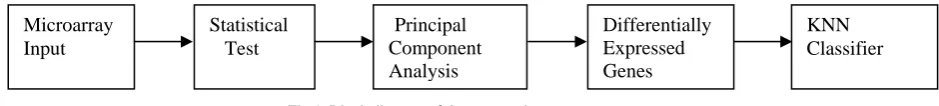
Fig 1. Block diagram of the proposed system
A block diagram of the proposed method is shown in Fig.1
3.1 ANOVA Statistical test
ANOVA is a frequently used technique for finding the differentially expressed genes in the analysis of microarray data. Based on the p-values, the informative gene subsets are selected as demonstrated by Soliman et al. (2010) and Golub et al. (1999). ANOVA test is known to be robust and assumes that all sample populations are normally distributed with equal variance and all observations (samples) are mutually independent. The approach chosen in this paper is the one-way ANOVA that performs an analysis on comparing two or more
Microarray Input
Statistical Test
Principal Component Analysis
Differentially Expressed Genes
groups (samples) for each gene and returns a single p-value that is significant if one or more groups are different from others. The most significantly varying genes have the smallest p-values.
Within-Groups estimate of y2 =
WGWG WG j j j i j ij MS df SS n y y
1 2 (1)The numerator of the variance formula is the sum of squared deviations around the sample mean, or Sum of Squares Within Groups, (SSW). The denominator is the degrees of freedom for the population variance estimate from sample j or the degrees of freedom Within Groups, (dfWG). The ratio of these two is called the Mean Square Within Groups, (MSWG). n is the sample size and k denote the groups.
Between-Groups estimate of y2 =
BGBG BG j j j MS df SS k y y n
1 2 . . (2)F ( dfBG, dfWG ) = (3)
The numerator of the variance formula is the Sum of Squares Between Groups, (SSBG). The denominator is the degrees of freedom Between Groups, (dfBG). The ratio of these two is called the Mean Square Between Groups, (MSBG). Of all the information presented in the ANOVA table, if the p value for the F- ratio is less than the critical value (α), then the effect is said to be significant. In this paper the value of α is set at .05, any value less than this will result in significant effects, while any value greater than this value will result in non-significant effects. The very small p-value indicates that differences between the column means (group means) are highly significant.
The probability of the F-value arising from two identical distributions gives us a measure of the significance of the between-sample variation as compared to the within-sample variation. Small p-values indicate a low probability of the between-group variation being due to sampling of the within-group distribution and small p-values indicate interesting genes. The paper uses the p-p-values to rank the important genes with small p-values and the sorted numbers of genes are used for further processing.
3.2 PCA (Principal Component Analysis based Dimension Reduction):
It is a statistical pattern analysis technique for determining the key variables in a multidimensional data set that explain the differences in the observations and is very useful for analysis visualization and simplification of high dimensional data sets (Raychaudhuri et al. 2000). Given m observations (samples or arrays) on n variables (genes) which form mxn data matrix, the goal of PCA is the reduction of data matrix dimensionality by finding r new variables, where r is less than n. These r new variables are termed as principal components and together they account for as much of the variance in the original n variables as possible while remaining mutually uncorrelated. We start with a matrix of expression data, A, where each row corresponds to a different gene and each column corresponds to one of several different conditions to which the cells were exposed. The ait entry of the matrix contains the ith gene’s relative expression ratio with respect to a control population under condition t. To moderate the influence of gene expression ratios above and below one, we applied the natural log transform to all ratios (Eisen et al. 1998).
Up-regulated genes thus have a positive log expression ratio, while down-regulated genes have a negative log expression ratio. We did not normalize the conditions to norm 0, variance 1 as sometimes recommended when attempting PCA on measurements that are not on a comparable scale (Everitt & Dunn 1992). The log ratios included in the analysis are comparable, no further preprocessing was necessary. To compute the principal components, the n eigenvalues and their corresponding eigenvectors are calculated from the n×n covariance matrix of conditions. Each eigenvector defines a principal component. A component can be viewed as a weighted sum of the conditions, where the coefficients of the eigenvectors are the weights. The projection of gene i along the axis defined by the jth principal component is:
= ∑ 1 (4)
information; eigenvectors with small eigenvalues are uninformative. Determining r, the true dimensionality of the data, and eliminating noisy components is often ad hoc and many heuristics exist. Eliminating low variance components, while reducing noise, also discards information. We chose to use one criterion that discards all components accounting for less than (70/n) % of the overall variability (Everitt & Dunn1992). The Matlab™ software package was used to conduct most of our calculations.
3.3 KNN classifier
The key idea behind classification is that similar observations belong to similar classes. Thus, one simply has to look for the class designators of a certain number of the nearest neighbours and weight their class numbers to assign a class number to the unknown. The weighing scheme of the class numbers is often a majority rule, but other schemes are conceivable. The number of nearest neighbours, K, should be odd to avoid ties, and it should be kept small, since a large K tends to create misclassifications unless the individual classes are well separated. One of the major drawbacks of KNN classifiers is that the classifier needs all available data. This may lead to considerable overhead, if the training dataset is large.
Given an input vector, KNN extracts K closest vectors in the reference set based on similarity measures, and makes decision for the label of input vector using the labels of the K nearest neighbors as said by P´adraig Cunningham et al. (2007). In this paper, Euclidean, city block, cosine, pearson’s correlation distance methods have been used as the similarity measure. When we have an input X and a reference set D = {d1, d2, …,dN}, the probability that X may belong to class cj, P(X,cj) is defined as follows:
P(X,cj) =
∑
,
,
(5)Where
,
is the similarity between X and and is a bias term. 4. Experiments and resultsThe two datasets used in the experiment are shown in the Table.1
Table 1. Datasets used in the experiments
S.No. Datasets
Number of Genes Number of samples
Number of Class(Groups)
1. Leukemia 12582 72 3
2. Lung Cancer 12533 181 2
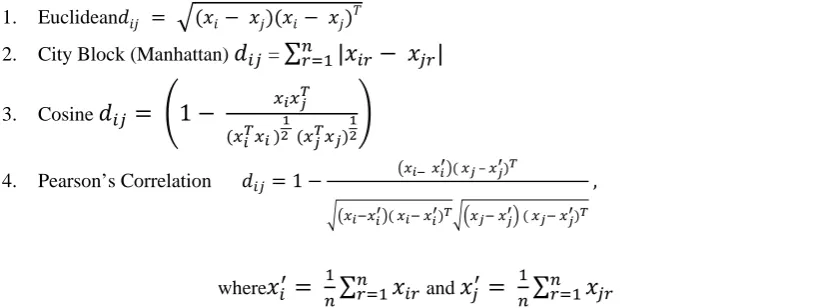
4.1 Distance Metrics
Let X denote a m×n data matrix whose m rows can be thought as m vectors each consisting of n elements (dimensions). The various distances between two row vectors xi and xj of the matrix X is given below:
1. Euclidean (6) 2. City Block (Manhattan) =
∑
|
|
(7)3. Cosine
1
(8)
4. Pearson’s Correlation 1 –
, (9)
where
∑
and∑
In this paper, the above distance metrics are used with the nearest and random tie breaking rules.
4.2 Classifier Evaluation Technique
N-fold cross validation technique, in which the p data used to train the classifier are randomly split in n independent datasets of approximately p/n. Subsequently, n rounds of validation follow, where in each round, n-1 datasets are used to train the classifier and n-1 to test it. The misclassification error is the average number of misclassified instances. In this paper, we used 5-fold cross validation method.
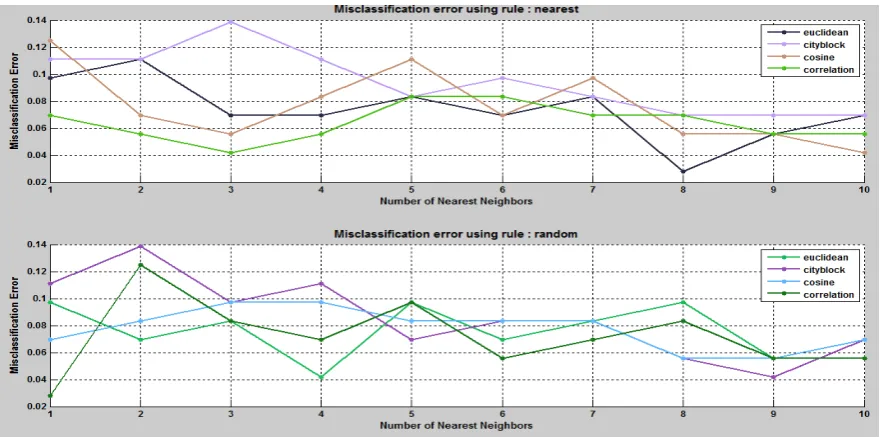
4.2.1 Leukemia cancer dataset using ANOVA statistical selection
Correlation distance function and using Nearest and Random tie breaking rules. The performance of the classifier is validated with 5-fold cross validation method. The misclassification error for tuned leukemia cancer dataset is shown in below figure.
Fig. 2. Misclassification errors for 5- fold cross validation method.
From the figures, it is clear that averagely the cosine and correlation methods provide less misclassification error. The table below gives the result for testing dataset.
Table 2. Misclassification and testing accuracy for the leukemia cancer dataset using ANOVA statistical test
Distance Metrics Ties rule Misclassified Samples Testing Accuracy Cosine & Correlation Nearest & Random 2 97.2%
4.2.2 Using Hybrid (ANOVA + PCA) gene selection method
The 8144 genes selected using ANOVA statistical test is the input data matrix to PCA. The PCA selects 100 genes from the total 8144 differentially expressed genes. The misclassification and testing accuracy for hybrid gene selection method is given in Table
Table 3. Misclassification and testing accuracy for the leukemia cancer dataset using Hybrid gene selection method
Distance Metrics Ties rule Misclassified Samples Testing Accuracy Cosine & Correlation Nearest & Random 1 98.6%
There is only one misclassified sample and the accuracy of the novel hybrid method increases to 98.6% from 97.2%.
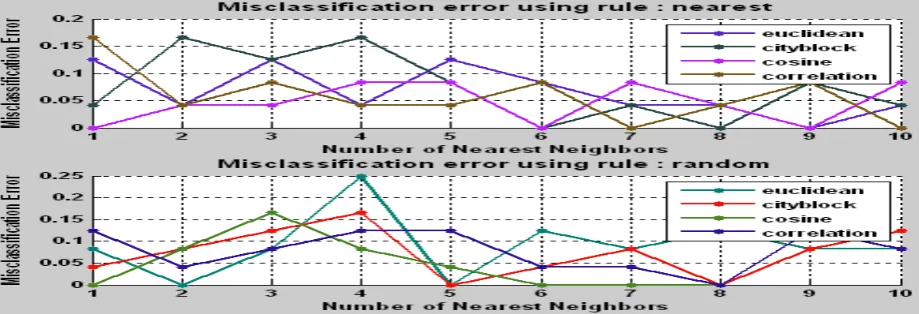
4.2.3 Lung Cancer Dataset using ANOVA statistical selection
From the figures, it is clear that averagely the cosine and correlation methods provide less misclassification error. The table below gives the result for testing dataset.
Table 4. Misclassification and testing accuracy for the leukemia cancer dataset using ANOVA statistical test
Distance Metrics Ties rule Misclassified Samples Testing Accuracy Cosine & Correlation Nearest & Random 4 97.8%
4.4 Using Hybrid (ANOVA + PCA) gene selection method: The 8002 genes selected using ANOVA statistical test is the input data matrix to PCA. The PCA selects 100 genes from the total 8002 differentially expressed genes. The misclassification and testing accuracy for hybrid gene selection method is given in Table.
Table 2. Misclassification and testing accuracy for the leukemia cancer dataset using Hybrid gene selection method
Distance Metrics Ties rule Misclassified Samples Testing Accuracy Cosine & Correlation Nearest & Random 2 98.8%
There are two misclassified sample and the accuracy of the novel hybrid method increases to 98.8% from 97.8%.
5. Conclusions
In this paper, we have investigated the use of the one way ANOVA model for finding the set of differentially expressed genes, followed by PCA to reduce further number of differentially expressed genes. The novel hybrid method increases the classification accuracy by reducing the number of misclassified samples, thereby reducing the complexity and time consumption in processing the gene expression data. The KNN classifier is used with different distance metrics and ties rule on the two different microarray datasets and we have shown that pearson’s correlation and cosine distance methods produces encouraging results on gene expression datasets. In leukemia cancer data set, the classification accuracy for ANOVA statistical selection is 97.2%, whereas our proposed novel hybrid method shows improvement in classification accuracy of 98.6%. In lung cancer data set, the classification accuracy for ANOVA statistical selection is 97.8%, whereas our proposed novel hybrid method shows improvement in classification accuracy of 98.8%. In future, various classifiers has to be trained with these selected genes for different data sets and the appropriate classifiers for the corresponding data set is to be determined.
Acknowledgments
We acknowledge sincerely the generous support of Dr. Ila.Vennila (Associate Professor, Department of Electrical & Electronics Engineering, PSG College of Technology, Coimbatore) for her valuable guidance and encouragement.
References
[1] M. Schena, D. Shalon, R.W. Davis, P.O. Brown,(1995).Quantitative monitoring of gene expression patterns with a complementary DNA microarray, Science 270, 467–470.
[2] Chai, H., &Domeniconi, C., (2001). An Evaluation of Gene Selection Methods for Multi-class Microarray Data Classification, Proceedings of the Second European Workshop on Data Mining and Text Mining in Bioinformatics, Fairfax, VA.
[3] Li, Y., Campbell, C., & Tipping, M., (2002) . Bayesian automatic relevance determination algorithms for classifying gene expression data. Bioinformatics,18(10), 1332-1339.
[4] Diaz, U.R., Supervised methods with genomic data: a review and cautionary view, (2005). In F. Azuaje & J. Dopazo (Eds.), Data analysis and visualization in genomics and proteomics. New York: Wiley.
[6] Jirapech, U.T., & Aitken, S., (2005). Feature selection and classification for microarray data analysis: Evolutionary methods for identifying predictive genes. BMC Bioinformatics, 6, 148.
[7] Blanco, R., Larranaga, P., Inza, I., & Sierra, B., (2004). Gene selection for cancer classification using wrapper approaches, International Journal of Pattern Recognition and Artificial Intelligence , 18(8), 1373-1390.
[8] Zhang, J.G., & Deng, H.W., (2007). Gene selection for classification of microarray data based on the Bayes error, BMC Bioinformatics, 8, 370.
[9] Wang, L., Chu, F., &Xie, W., (2007). Accurate Cancer Classification Using Expressions of Very Few Genes, IEEE/ACM Transactions on computational biology and bioinformatics, 4(1), 40-53.
[10] VenuSatuluri, V., (2007). A survey of parallel algorithms for classification.
[11] Saeys, Y., Inza, I., &Larrañaga, P., (2007). A review of feature selection techniques in bioinformatics, Bioinformatics, 23(19), 2507-2517.
[12] Yoonkyung Lee, Cheo Koo Lee , (2003). Classification of multiple cancer types by Multicategory support vector machines using gene expression data, Bioinformatics, 19(9), Liu, J., & Iba, H., Selecting Informative Genes with Parallel Genetic algorithms in Tissue Classification, Genome Informatics, 12, (2001) 14-23.
[13] Keller, A. D., Schummer, M., Hood, L., &Ruzzo, W. L., (2000). Bayesian Classification of DNA Array Expression Data (Tech. Rep. No. UW-CSE-2000-08-01), Seattle: University of Washington, Department of Computer Science & Engineering.
[14] Wong, T.T., & Hsu, C.H., (2008). Two-stage classification methods for microarray data, Expert Systems with Applications, 34(1), 375-383.
[15] R. Markus, P. Carsten, (2003) Microarray-based cancer diagnosis with artificial neural networks, BioTechniques Journal, 30-35. [16] Dudoit, J f Fridlyand, T. P Speed, (2002). Comparison of Discrimination Methods for the Classification of Tumors Using Gene
Expression Data, Journal of the American Statistical Association, 97(457), 77-87.
[17] Dembele, D. and Kastner, P., (2003) Fuzzy C-means method for clustering microarray data, Bioinformatics (Oxford, England), 19, 973-980.
[18] http://www.ncbi.nlm.nih.gov/geo/
[19] Churchill,G.A., ,(2004) .Using ANOVA to analyze microarray data,Biotechniques, 37, 173–177.
[20] Soliman, T.H.A.,Sewissy, A.A., AbdelLatif, H., (2010) A gene selection approach for classifying diseases based on microarray datasets,2nd International Conference on Computer Technology and Development (ICCTD),626 – 631.
[21] Golub,T . R., Slonim, D. K., Tamayo, P., Huard, C., Gaasenbeek, M, Mesirov, J . P., Coller, H., Loh, M.L., Downing, J.R., Caligiuri, M.A., Bloomfield, C.D., Lander, E.S., (1999). Molecular Classification of Cancer: Class Discovery and Class Prediction by Gene Expression Monitoring, Science, 286, 531-537.
[22] Armstrong S. A., Staunton J.E., Silverman L.B., PietersR, den Boer M.L., Minden M.D., Sallan S. E., Lander E.S., Golub T.R., Korsmeyer S.J, (2001). MLL trans locations specify a distinct gene expression profile that distigushes a unique leukemia, Nature Genetics,30, 41-47.
[23] Eisen MB, Spellman PT, Brown PO, Botstein D, (1998). Cluster analysis and display of genome-wide expression patterns. Proc Natl Acad Sci U S A ; 95:14863–8.
[24] Everitt, BS.; Dunn, G. (1992). Applied Multivariate Data Analysis. Oxford University Press; New York.
[25] Raychaudhuri, S., Stuart, J.M. and Altman, R.B.(2000) Principal components analysis to summarize microarray experiments: application to sporulation time series. Pac Symp Biocomput, 455-466.
[26] Kerr, M. K., Martin, M. and Churchill, G. A., (2000). Analysis of variance for gene expression microarray data, J. Computat. Biology, 7, 819-837.