APPLICATION OF QUALITY
FUNCTION DEPLOYMENT METHOD
AND FUZZY LOGIC FOR IMPROVING
THE DESIGN CHARACTERISTICS IN
FRP COOLING TOWER-CASE STUDY
R.UMESH SUNDAR1
Department Of Mechanical Engineering, Park College of Engineering and Technology, Kaniyur, Coimbatore-641 659, Tamilnadu, India
G.MOHAN KUMAR2
Park College of Engineering and Technology, Kaniyur, Coimbatore-641 659, Tamilnadu, India
Abstract
Quality Function Deployment is a continuous improvement technique applied in the design of an FRP cooling tower.QFD helps to develop customer oriented, higher quality products. In order to improve the quality characteristics of this product and to satisfy the customers, the technique such as QFD followed by fuzzy logic technique approach is done. Though, the QFD method has some draw backs, it is one of the most important methods to interpret customer needs for specific quality development. To overcome this drawback, fuzzy linguistics approach is proposed in this paper. This paper shows how QFD approach can be combined with fuzzy logic to resolve some of its drawback. Finally, these two approaches have been compared to know which applies the best for this case study.
Key words: QFD, Fuzzy QFD, Absolute weight, Rank, Normalized individual weight
The main purpose of this case study is to make the existing FRP cooling tower manufactured in GEM EQUIPMENTS LIMITED of better quality, Coimbatore, Tamilnadu, India. Figure 1. shows the FRP cooling tower.
1. Introduction
Fig. 1. Structure of FRP cooling tower
Web based customer feedback collected in this paper is based on Jim Dimsey et.al. (2002) concept.The questionnaires preparation is an important process in QFD, the method of preparation of the questionnaires and the collection of feedback from customer is proposed based on Sivadas aniyan T.S (2011) concept. Improvement of the product quality characteristics and reduction of the cost is based on the most customer expectation (K.yegenegi et.al, 2011). G.Kannan (2008) proposed fuzzy triangular QFD system to find exact solution and also to satisfy customer needs and determine the demand weight by using fuzzy approach. Ming-Chyuan Lin et al.(2004) used fuzzy scoring linguistic to implement QFD parameters. Multiple objective programming helps to prioritize design requirements in quality function deployment (E. Ertugrul Karsak, 2004). Cengiz kahraman et al. (2003) proposed an approach called fuzzy optimization model for QFD planning process using analytic network which is used to find the product technical requirements to be considered in the design of product.
The ultimate aim of this article is to improve the design characteristics and customer expectation in the FRP cooling tower, improve the quality characteristics, reduce costs, reduce the production time and increase the production.
According to various authors QFD is a best tool, to satisfy the customer requirements and to improve the products quality; it also helps in generating the new idea from design team, existing process problem are eases to identify and rectify by the use of QFD. So in this article the QFD and fuzzy QFD method is used to satisfy the customer requirements of FRP cooling tower. The feedback is collected from customers by the marketing department.
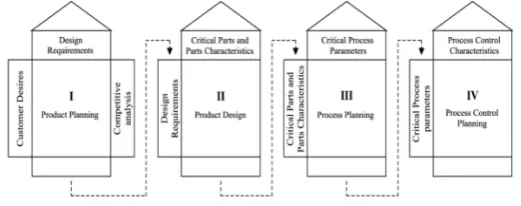
1.1. Four Phases of QFD
The QFD process mainly consists of four phases, product planning, product design, process planning andprocess control phase. Each phase of QFD is released by a matrix consisting of a set of input (WHAT) and output (HOW), the output of each phase is deployed in its next phase as input. Figure 2.shows the four phases of QFD.
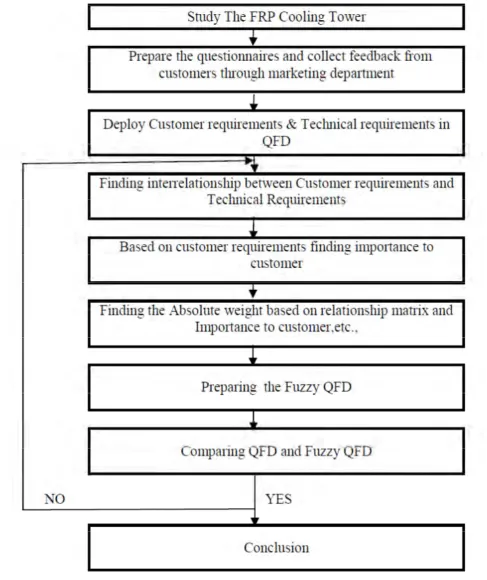
1.2. Out Line of This Article
The figure 3. Show the over view of this article
2. Problem Description
This study uses QFD methodology to transfer customer requirements into the quality characteristics to improve the efficiency of FRP cooling tower. Based on the literature survey the QFD methodology is used to analyses the quality development in FRP cooling tower. QFD is used to collect the data in matrix format to capture a number of issues pertinent and vital to the planning process.
The FRP cooling tower has recorded a maximum of 60 percentage cooling efficiency which is comparatively very low with regard to other products in the market. The main design flaw which produces such low efficiency is found due to the defect in the fan blade design and the inlet mesh height. A fan blade is one of the major components present in a cooling tower which helps to drive in the air inside. The main reason for the poor air intake is because of the unproductive fan blade angle and the tip clearance. The fan blade angle is the angle at which the blade is bending. When the fan blade is made to rotate, a low pressure is created inside, and this low pressure sucks the air inside the cooling tower. If the blade angle is improved the quantity of air taken inside will increase which in turn improves the efficiency of the cooling tower. Improper workings of the float valve due to the spring malfunction, damage in solenoid valve cause the damage of water out of the basin. The tip clearance is one of the major design considerations. The tip clearance is the distance between the fan blade tip and the outer casing. The tip clearance should be the lowest possible value in order to get more efficiency. If the tip clearance is high the low pressure created will be a least value and the air flow rate will also be very less. It is seen that in FRP cooling towers the power consumption is more. The major reason for this is because single fan is used to drive out the exhaust air present in the cooling tower. The motor is placed straight above the fan which makes the exhaust air flow turbulent. This turbulent flow of air is the major reason why the motor consumes more power. The sprinkler is another component which plays an important role in the cooling tower. The sprinkler works fully on the thrust given by the inlet water. There is greater possibility of the sprinkler pores getting closed by the regular usage of hard water. The thrust bearings can get damaged by the impurities formed due to hard water usage. The next major component is the basin which is also made of FRP. Highly reinforced resin is coated on the surface of the basin to improve its strength. Improper resin coating can create crack in the basin which may lead to the leakage of water. Incorrect fitting of bolts and other accessories can also create leakage in the basin. Because of the regular usage of hard water the fills get blocked by the salt crystals formed by the process of crystallization. Rust formation and water leakage in pump are the other problems associated with this product. These defects should be improved to get the required efficiency and also satisfy the customer requirements.
2.1. Understand the Customer Voice
Fig . 4. Listening to the customer
3. Problem Solving Methods
3.1. Feedback Questionnaire, FRP Cooling Tower
The customer complaints have been collected by using below questionnaires, table.1.show the feedback questions,
Table 1. Feedback Questionnaire Mark in the appropriate box
S.NO Questionnaires 1 2 3 4 5
1 Performance of fan
2 Operating condition of sprinkler 3 Life of casing
4 Vibration of Fan motor
5 Power consumption of fan motor 6 Quality of Product
7 Efficiency of cooling tower 8 Performance of fills 9 Life of the cooling tower 10 Colour of cooling tower 11 Function of Float valve
12 Formation of rust in the cooling tower 13 Overall Noise and vibration of cooling tower 14 Performance of Cooling tower
Scale Rating: 1.Poor 2.Fair 3.Average 4.Good 5.Excellent
Source: M/s. Gem Equipments Ltd., Coimbatore, Tamilnadu, India.
Major Customers:
7. Ambika Cotton Mills Limited- Dindigul. 8. P.V.Apparels-Tirupur
9. S.R.M Pneumatics-Madurai 10. B.K.S Textiles Pvt Ltd-Coimbatore
3.2. Higher Customer Accuracy
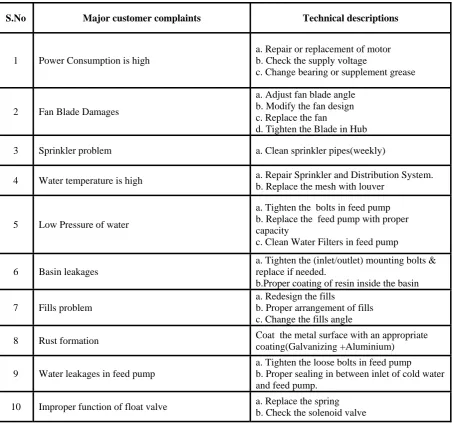
Table 2. is to prepare the technical descriptions based on major customer complaints.
Table 2. Higher Customer Accuracy
S.No Major customer complaints Technical descriptions
1 Power Consumption is high
a. Repair or replacement of motor b. Check the supply voltage
c. Change bearing or supplement grease
2 Fan Blade Damages
a. Adjust fan blade angle b. Modify the fan design c. Replace the fan
d. Tighten the Blade in Hub 3 Sprinkler problem a. Clean sprinkler pipes(weekly)
4 Water temperature is high a. Repair Sprinkler and Distribution System. b. Replace the mesh with louver
5 Low Pressure of water
a. Tighten the bolts in feed pump b. Replace the feed pump with proper capacity
c. Clean Water Filters in feed pump
6 Basin leakages
a. Tighten the (inlet/outlet) mounting bolts & replace if needed.
b.Proper coating of resin inside the basin 7 Fills problem
a. Redesign the fills
b. Proper arrangement of fills c. Change the fills angle
8 Rust formation Coat the metal surface with an appropriate coating(Galvanizing +Aluminium) 9 Water leakages in feed pump
a. Tighten the loose bolts in feed pump b. Proper sealing in between inlet of cold water and feed pump.
10 Improper function of float valve a. Replace the spring b. Check the solenoid valve
3.3. Proposed QFD
The QFD (quality function deployment) is a method used to find various factors involved in a product, to satisfy the customer requirements. It is also used as a tool to identify defects of a product, to improve the design features, for competitive analysis of the product, and to analyze the cost of the product. Most of the industries use QFD as a benchmarking tool.
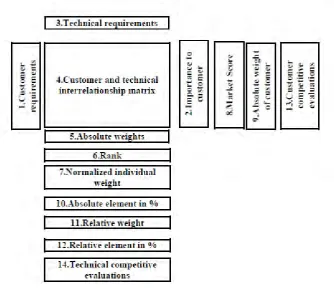
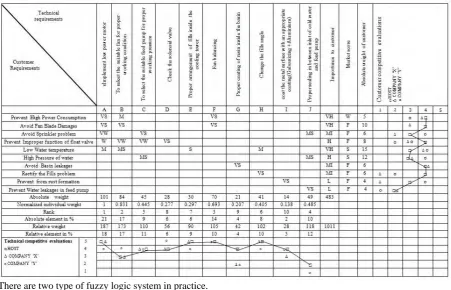
The first step in QFD is the preparation of customer requirement matrix based on the questionnaires. The major customer requirements are taken and studied. The high priority requirements are given more weightage, and are placed on the top order in the matrix and the low priority requirements take the lower order in the matrix. The second step is to prepare the customer important matrix. In this step the importance is given as (1.very low 2.low 3.medium 4.high 5.very high). The important rating is given by the marketing department based on customers complaints. The third step is the preparation of technical requirement matrix. This matrix is prepared by the design team. The design team studies the customer requirements and designs the product carefully so that the customer requirements are met. Various technical data is required to design the product to put up in a matrix form. The high priority technical data gets the top order where as the low priority data gets the low order. The fourth step is the preparation of interrelationship matrix. It is also prepared based on the weightage given to each components say (1.very low 2.weak 3.more or less weak 4.medium 5.more or less strong 6.strong 7.very strong). The customer requirement matrix and the technical requirement matrix are interrelated to prepare the interrelationship matrix. The fifth step is to find out the absolute weights by using formula (i). This is done by comparing interrelationship matrix and customer importance matrix. The rank based on the absolute weight is found out in the sixth step. The seventh step is to find the normalized individual weight by using the formula (ii). This is done by taking the ratio of absolute individual weight and maximum absolute individual weight. Normalized individual weight is calculated to compare it with the fuzzy QFD. The eighth step is to find out the market score. The market score is prepared by the marketing department based on the customer requirements. After finding the market score the absolute weight of the customer had to be found out in ninth steps by using the formula (iii). The product of ‘important to customer’ value and the ‘market score’ value gives absolute weight of customer. The high weightage component gets the top rank. In the tenth step absolute weight in percentage is found out by taking the ratio of individual resultant weights and the resultant weight by using the formula (iv). The eleventh step is to find out the relative weight of the customer by using the formula (v). The product of ‘interrelationship matrix’ value and ‘absolute weight of customer’ value give the ‘relative weight’ values. The twelfth step is to find out the relative element in percentage by using the formula (vi). This is done by taking the ratio of individual relative weight and the total relative weight. The final step is the preparation of customer competitive assessments and the technical competitive assessments. This step deals with the comparison of all the matrix parameters with regard to the product of other organizations. This is purely a benchmarking step. Now, after finding out all the individual matrices and assessments the QFD chart is prepared.Figure 5. Show the proposed structure of QFD.
4. Implementation of QFD
FRP cooling tower is being designed and manufactured for the past 28 years in Gem Equipment Limited. The pace of redesigning cooling tower to enhance performance and lower price had been accelerated in due course of time by implementing altered designs. Thus, the better design features integrated customer requirements and product developments. Based on market survey, sales records, interviews and marketing engineering of the whole team, ten customer requirements has been considered to prepare the QFD table. The table.3 shows the proposed QFD. The results yield the following technical requirements to improve the design characteristics of FRP cooling tower.
A. Implement low power motor.
B. To select the suitable fan for proper working condition. C.To selects the suitable feed pump for proper working pressure. D. Check the solenoid valve.
E. Proper arrangement of fills inside the cooling tower. F. Fan balancing.
G. Proper coating of resin inside the basin. H. Change the fills angle.
I. Coat the metal surface with an appropriate coating.
J. Proper sealing in between inlet of cold water and feed pump.
Scale rating for Interrelationship matrix
1. Very Weak 2.Weak 3. More or Less Weak 4. Medium 5.More or Less Strong 6.Strong 7.Very Strong
Scale rating for Importance to customer
Customers Complaints 1-30% 31-50% 51%-70% 71%-80% 81%-100% Scale factor(Importance) 1-Very Low 2-Low 3-Medium 4-High 5-Very High
Scale rating for Market score
1. Weak 2. Fair 3.Strong
Scale rating for competitive evaluations
1. Poor 2.Fair 3.Good 4.Excellent 5.Perfect
Formula Used
Absolute weight W = (C1j X I1) + (C2j X I2) +…., + (Cnj X In) (i)
Let, W = Absolute weight,
C = Correlation of the customer and technical requirements, I = Importance of customer requirements.
Normalized individual weight = Absolute individual weight (ii)
Maximum absolute individual weight
Absolute weight of Customer = Importance to customer x Market score (iii) Absolute weight in percentage = Individual resultant weights (iv) Absolute weight
Relative element in percentage = Individual Relative weight of the customer (vi)
Relative weight of customer
Table 3. Quality Function Deployment Calculations
1.Absolute weight = (7x5) + (7x5) + (1x3) + (2x4) + (4x5) = 101
2.Absolute weight of customer = (5x1) =5 3.Absolute Element in % = 101/483 = 21%
4.Relative Weight = Interrelationship Matrix x Absolute Weight Of Customer = (7x5) + (7x10) + (1x6) + (2x8) + (4x15)
5. Implementation of Fuzzy QFD
Fuzzy logic system is a type of probability logic which deals with the analysis of approximate, fixed and exact values, with respect to the traditional QFD theory. The fuzzy logic system uses a principle that involves true value that range between 0 and 1. The results associated with the values between the ranges 0 to 1 are termed as partial truth values which can be taken as completely true and completely false. Fuzzy logic system uses linguistic variables (VW,W,MW,M,MS,S,VS,VL,L,MI,H,VH,W,F,S) that are managed by specific function.The table.4 shows the fuzzy QFD.
Fuzzy logic system was introduced by Professor L.A.Zadeh in 1965. Fuzzy logic system is mainly used to solve under defined or ill defined problems to obtain accurate solutions. It is also used in decision making problems. The fuzzy logic system uses certain rules, concepts, theories, procedure and principles to solve the problems with respect to the input parameters. The logic principle used in this system is IF THEN rules. Fuzzy logic and fuzzy set uses linguistic variables in problem solving.
Fuzzy logic systems inherit certain characteristics features which make it better than other logic systems.
The decision making is simple with incomplete and unknown information.
It is widely used in reasoning problem.
It is used in interpretations and easy to understand.
It is used in variable input and variable output systems.
Table 4. Fuzzy Quality Function Deployment
There are two type of fuzzy logic system in practice. 1. Triangular fuzzy number
2. Trapezoidal fuzzy number
Triangular fuzzy logic system is the most commonly used fuzzy logic system.
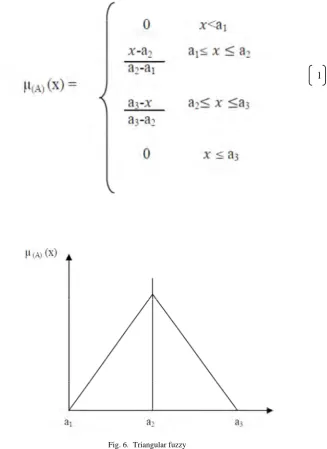
Triangular Fuzzy Number
A fuzzy logic system uses a value between 0 and 1. In a triangular fuzzy logic system three value points are used. These three value points must be values between 0 and 1. The figure 6.show the triangular fuzzy and follows general equation (1).
A= (a1,a2,a3)
a1 a2 a3 0 to 1
a1-lowest value
a2 –mid value
The membership function is represented as,
Fig. 6. Triangular fuzzy
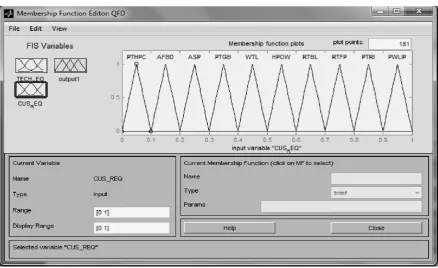
Matlab is high-level technical computing software used for data visualisation, algorithm development, data analysis and numerical computation. Using Matlab technical complexity problem can be solved further then traditional programming. Fuzzy logic problems can be solved easily way matlab software.
The fuzzy logic problem solving using matlab involves various methodologies and procedures that are to be followed accordingly. The first step is to create a fuzzy database. In the fuzzy database and number of inputs and outputs can be set. All the input parameters are processed and the output is displayed. The second step is to set the IF-THEN rules. In this step the IF rules with respect to each input is set, so that the ‘THEN’ rule for the corresponding output can be displayed. All the operations are saved in fis format.
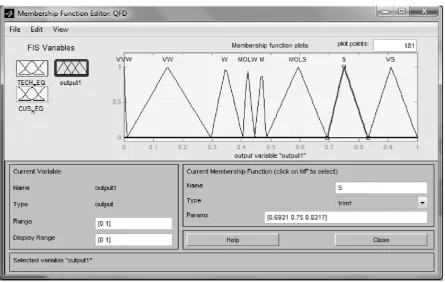
In this research there are two input parameter namely technical requirements and customer requirements. The result is termed namely absolute weight.The figure 7. show the structure of fuzzy QFD, figure 8. show the comparison of customer requirements Vs membership function, figure 9. show the comparison of Technical requirements Vs membership function and figure 10. show the comparison of Absolute Weights Vs membership function.
Fig. 7. Structure of fuzzy QFD
Fig. 9. Comparison of Technical requirements Vs membership function
Fig. 10. Comparison of Absolute Weights Vs membership function
analysis which is displayed as graph. There are ten major study parameters for each input so the number of rules that are to be set for the fuzzy analysis is 10 x 10 = 100 rules.
The maximum and minimum range has to be set to get accurate results. The AND method and importance method is set to the minimum range. The absolute weight found out using the QFD chart is taken as the input and the normalized weight is found as(1, 0.831, 0.445,0.277,0.297,0.693,0.207,0.405,0.138,0.485). Based on the normalized individual weight values the rank is given from 1 to 10, i.e. 1.000 gets the rank1, 0.831 get the rank 2.etc..,. The next step is to find the absolute weight of customer using the formula. After finding the absolute weight of customer the individual resultant weight is also found out. Following these steps the percentage of absolute element, relative weight and relative element is also found and the results are plotted. The figure 11. show the comparison of Rank VS Absolute element in percentage and Relative element in percentage and figure 12. show the comparison of Rank VS Normalized individual weight.
Fig. 11. Comparisons of Rank VS Absolute element in percentage and Relative element in percentage
6. Results and Discussion
From the web based questionnaires, the QFD was prepared as shown in table 3, the result shows that
A>B>F>J>C>H>E>D>G>I. i.e. the first preference of the FRP cooling tower is to implement the low power motor which shows the highest absolute weight and relative weight. This means that the implementation of the low power motor is the most important customer requirement. The second requirement is to select suitable fan for proper working condition, third need is fan balancing, fourth need is the proper sealing in the fitment of cold water inlet and feed pump , fifth requirement is to select the suitable feed pump at proper working pressure, sixth requirement is to the change the fills angle, seventh requirement is the proper arrangement of fills inside the cooling tower, eighth important requirement is to check the solenoid valve in the basin of cooling tower, ninth requirement is proper coating of resin inside the basin and final important requirement is to coat the metal surface with appropriate coating. The above customer requirements are incorporated in the design of the FRP cooling tower in the descending order of their absolute weight and relative weight. It is observed that all the technical requirements belonging to the FRP cooling tower has to be analyzed and appropriate design characteristics has to be improved based on customer requirements. In this paper both QFD and fuzzy logic system is analyzed. Fuzzy logic analysis is found to be more accurate than QFD as shown in table 5. The results obtained from the fuzzy analysis are plotted in graph. The parameters which show very strong preference must be given higher priority. The higher priority problems are analyzed and redesigned to solve the problems. The problems solving steps must start from very strong preference to very weak preference. Thus by using the fuzzy QFD method the design characteristics of FRP cooling tower is improved based on the customer requirements.
Table 5 Technical requirements of higher weights belonging to each category
Rank Technical Requirements Category QFD Fuzzy QFD
1 Implement low power motor Power 1 (0.831,0.910,1) 2 To select the suitable fan for proper
working condition Design 0.831 (0.693,0.750,0.831) 3 Fan balancing Maintenance 0.693 (0.485,0.594,0.693) 4 Proper sealing in the fitment of inlet of
cold water and feed pump Assembly 0.485 (0.445,0.470,0.485) 5 To select the suitable feed pump for
proper working Pressure Design 0.445 (0.405,0.420,0.445) 6 Change the fills angle Design 0.405 (0.297,0.346,0.406) 7 Proper arrangement of fills inside the
cooling tower Assembly 0.297 (0.009,0.148,0.297)
7. Conclusions
Acknowledgement
Managing Director Mr. Ravi Selvam of M/s.GEM EQUIPMENTS LIMITED, Coimbatore, Tamilnadu, India, and his team, gave us an opportunity to work on the design of the product of their own and the extended support given by Mr.M.Prasanna, Mr.Bensinghdhas and Dr.R.Radhika is gratefully acknowledged.
References
[1] Cengiz Kahraman et al. (2004)“A fuzzy optimization model for QFD planning process using analytic network approach”European Journal of Operational Research,pp.1-22.
[2] Chih-hung hsu et al.(2011): “Green supply implementation based on fuzzy QFD:an application in GPLM system” 10(6),pp.1109-2777.
[3] Durga Prasad.K.G et al (2011): “Cost engineering with QFD : A mathematical model” International Journal For Quality Research,4(1),pp.33-37.
[4] Erthugrul karsak.E(2004):“Fuzzy multiple objective programming framework to prioritize design requirements in quality function deployment” Computers & Industrial Engineering ,47,pp.149–163.
[5] Jim Dimsey and Glenn Mazur(2002)”QFD to Direct Value Engineering in the Design of a Brake System” QFD institute.pp.650-659 [6] kannan.G(2008):“Implementation of fuzzy quality function deployment in an automobile component to improve the quality
characteristics”, Quality Engineering, 20,pp:321-33.
[7] Kwong.C.K and H.Bai (2002): “An fuzzy AHP approach to determination of importance weights of Customer requirements in quality function deployment” journal of intelligent manufacturing, 13(5), pp. 367-377.
[8] Liang-Hsuan Chen et al. (2004): “An evaluation approach to engineering designing QFD processes using fuzzy goal programming models” European Journal of Operational Research,172, pp.230–248.
[9] Marvin E. Gonzalez et al. (2003): “Improving Product Design Using Quality Function Deployment: The School Furniture Case in Developing Countries” Quality Engineering,16(1), pp. 47–58.
[10] Metin Celik. et al.(2008): “An integrated fuzzy QFD model proposal on routing of shipping investment 3 decisions in crude oil tanker market” Expert system with application”, 36(3), pp.6227-6235.
[11] Ming-chyuan Lin et al.(2004): “Using Fuzzy QFD for Design of Low-end Digital Camera” International Journal of Applied Science and Engineering, 3,pp.222-233.
[12] Mohiddin Ahmed et al. (2006): “Developing quality healthcare software using quality function deployment: a case study based on sultan qaboobs university hospital” Int.j.business information system, 1(4), pp. 408-425.
[13] Oke.S.A et al (2009):“Application of QFD and VA tools in the design of an automobiles” Int.J.Productivity And Quality Management, 4, pp. 525-548.
[14] Onder Erkarslan and Hande Yilmaz (2011) “Optimization Of Product Design Through Quality Function Deployment And Analytical Hierarchy Process: Case Study Of A Ceramic Washbasin” METU JFA, 28(1), pp.1-22.
[15] Raissi.S(2011):“A novel method on customer requirements preferences based on common set of weight” Australian Journal Of Basic And Applied Sciences, 5(6),pp. 1544-1552.
[16] Sivadas Aniyan.T.S(2011): “Quality function deployment in manufacturing industry(Improving existing SB CNC 40/60 slant bed turning centre in HMT,Kalamassery)”,Tenth International Conference on Operations and Quantitative Management organized by Symbiosis Institute of Operations Management, Nashik, India,pp.609-617.
[17] Vivianne bouchereau and Hefin Rowlands (2000): “Methods and techniques to help quality function deployment”. Bench marketing. An International Journal, 7(1), pp. 8-19.