' .
THE APPLICATION OF
MANAGEMENT TECHNIQUES
TO WATER RESOURCES
DEVELOPMENT
THE APPLICATION OF MANAGEMENT
TECHNIQUES TO WATER RESOURCES
DEVELOPMENT AND MANAGEMENT
BESSEL D. van't WOUDT
No. 10 April 1973
CONTENTS
Summary 1
Introduction 2
Tele-measurement, computerization and tele-operation 3
Network analysis 8
Reservoir Operation 10
1. Operational planning using probability of occurrence 14 of three levels of streamflow
2. Detailed simulated reservoir operation Systems optimization
Simulation modelling References
Appendix 1 List of computer programmes of interest to the management of water resources projects developed
17
21
26
27
by the U. S. Bureau of Reclamation 29
1.
2.
1-2.
3.
4.
LIST OF TABLES
Probability analysis of annual inflows to Granby reservoir Distribution of monthly inflow to Granby reservoir for operational planning
LIST OF FIGURES
Model of operation of Muda project. Malaysia
Network of prime contract - major activities, third power plant, Grand Coulee dam
Outline of steps in water resources development and management
Social changes triggered by water resources development for irrigation
15
16
4 7 9 11 5. Watershed management upstream of an impounded water body 136.
7.
8.
9.
Projected capacity of Pa Mong reservoir at various water elevations with indication of critical levels selected for stage 1 operation
Simulated operation of the Pa Mong reservoir based on an extended streamflow record
Graphical solution of a linear system Simulation model of a groundwater basin
19
20
24
THE APPLICATION OF MANAGEME.NT TECHNIQUES TO WATER
RESOURCES DEVELOPMENT AND MANAGEMENT
SUMMARY
Management techniques cover a range of subjects that represent old wine in a new bag. but wine that has been redistilled by the applicat-ion of electronics, computers and new thinking on goals to be achieved.
Only those techniques have been discussed that have already found application, in 1971, in the work of the United States Bureau of Reclamation or are under consideration for application.
(1) Tele-measurement of rainfall and streamflow can be used
in remote areas, for economizing on manpower, or for up-to-the-minute information as may be, needed for flood control, for instance.
(2) Computer processing of information can be useful for
reasons given under (1) and, in addition. may be
necessitated for the handling of many data. The computer programme can be geared to provide various analyses and. where applicable. operational instructions. These instruct-ions can be transmitted and be carried out manually or automatically via the computer.
(3) Network analysis has been applied to the construction of
water works for showing inputs and the timing of
activities for reaching given goals. For novel and non-routine activities it is commonly not possible to assess minimum, mean and maximum time requirements for
activities in order to arrive at completion of a project by a given date. Such data as to time requirements are needed for formal net-work analysis. However, for these types of activities,
network-type diagrams can still be useful which, like in formal network analysis, show inputs, activities and interrelationships in a time sequence. These diagrams can form the basis for timing analyses when. subsequently, more information on timing becomes available. Several examples of the latter type of presentation are submitted.
(4) Long-term streamflow records can be analysed for
probability of exceedance of a given flow on the basis of which reservoir operation and water-use plans can be drawn up for expectations of probable minimum and maximum flows and for reasonable (mean) flow. This is illustrated for the Granby reservoir in Colorado.
(5) For important projects the analysis can be extended
beyond that discussed under (4) by considering reservoir operation for each flow possi.bility. This is illustrated for the projected Pa Mong reservoir on the Mekong river on the basis of 40 years of reconstituted flow.
(6) Studies of the optimization of water resources projects, for minimum cost or maximum benefits, have recently been started, commonly involving the use of dynamic programming, For simple farm problems to which linear relationships apply. linear programming can be used. An example has been given of the graphical solution of
such a problem.
(7) Physical simulation modelling has been widely used in
the past. Lately, mathematical simulation modelling has been attempted without recourse to physical models. Inspite of results from the latter technique. current aquifer management in Israel remains based on field measurements of the water levels in aquifers in response to withdrawals and recharge.
(8) An annex is attached listing computer programmes
available in the Bureau of Reclamation that have a bearing on operation and maintenance of water resources projects. Other programmes on other aspects of water resources project development and management are available.
INTRODUCTION
Management techniques cover a range of subjects which represent old wine in a new bag. wine that has, however, been redistilled by the application of electronics, computers and new thinking on goals to be achieved.
The general subject has been reviewed by the author while he was attached to the United Nations Economic Commission for Asia and the Far East (ECAFE) with the cooperation from the U. S. Bureau of Reclamation (USBR) and the Drainage and Irrigation Department of the Ministry of Agriculture and Cooperatives, Malaysia. With permission from ECAFE, the original paper has been slightly reworked.
The paper reviews techniques already in use in the USBR (by 1971) or under consideration for application by the Bureau. The review of this large subject is, by necessity. a superficial one that needs to be followed up by treatment in segments alongside consideration of the concept of !!river basin development", Suggestions for a possible manner of such treatment have been incorporated in the last paragraph of the SUHlmary.
Management techniques can be reviewed under two headings: (a) management techniques employing recently developed techniques in, for instance, aerial photography, laser beams, etc, and
automation and computerization of operations; and (b) management techniques involving desk work.
Under the first heading. two cases only are referred to in which automation and computerization of the operation of a water
ect have found practical application.
Techniques under the second heading fall in the operations research, sometimes also referred to as
analysis, system engineering or decision analysis. They involve the schematization of an undertaking so that the undertaking is expressed as a system or model that can be subjected to analyses. These techniques have recently been applied to public administration, industry, commerce, transportation and other fields (9, 21) but so far there have been few instances of their practical application to water resources projects.
TELE- MEASUREMENT. COMPUTERIZATION AND TELE-OPERA TION
Conventionally. measurement of rainfall and streamflow is done manually and observations are transmitted in print,by telephone or radio to a central office for recording, analysis
and decision making. However, lately tele~metering is under",
taken in a number of places (see, for instance (3)) at given intervals or on call. Usually, the measurement of a water level by a float or an electrical contact provides the basic information. For tele-communication a source of energy needs to be available at the site of measurement. This may consist of a battery or, in cloud-free areas, of a solar cell. A battery can be automatically
recharged in a remote area by a thermo- electric generator or an engine-generator set, using e. g., propane gas stored in cylinder. For details of these and other related techniques see reference (15).
Conventionally. recording, compiling and analysiS are done by desk work, but the back-log of observations and their significance have increasingly led to automatic data processing (ADP). A
computer can be programmed in such a viTay that the basic data can lead to direct information needed for decision making or the computer can be used to make the decision itself. Conventionally. management decisions are tele- communicated by telephone,
radio or in print, but the computer can be used to automatically
tele-transmit management decisions it reaches and to implement
them. Thus, the setting of a gate opening for water retention or release, or the starting and stopping of a pump can be carried out by a computer. The modern operation of an electric power system, in which thermal and hydro- power are integrated. gives a typical example of these types of operations. Under all circumstances. a selection of the method of data taking, transmission and processing is determined by
(a) the availability of skilled and reliable personnel;
(b) the cost of alternative methods; and
(c) the urgency of decision making.
A number of computer prograrnmes developed by the United
States Bureau of Reclamation that have a bearing on above and
other problems in operation and maintenance Vtlater reso·urces
projects are listed in t,
NOTE: Numbers between brackets refer to reference in of paper.
3
IRRIGATION
DISTRIBUTION SYSTEM
BLOCK. ,
FIELD DRAINAGE SYSTEM
~ STRUCTURES FOR RELEASE AND DIVERSION
o
STRUCTURES FOR DRAINAGE CONTROLCATCHMENT
RESERVOJR
INFLOW
WATER LEVEL IN BLOCKS
DRAINAGE CONTROL /
RAINFALL
CENTRAL
OFFI CE
~ DRAINAGE TO THE SEA
FIG. I MODEL OF OPERATION OF MUDA PROJECT) MALAYSIA.
Two examples are given below where tele-measurement and computerization have been applied to the operation of a water resources project.
(1) For the operation of the Muda irrigation project tele-metering
is done of rainfall, reservoir inflow and level, reservoir discharge and water level within rice fields. These are tele-transmitted to a central office where decisions are made on reservoir release.
diversions to various fields and drainage (Fig. 1). Tele-operation
has not yet been applied.
The motive for installing this system resides in:
(a) making optimal use of restricted reservoir space,
(b) utilizing the potential field storage within rice fields on a project-wide basis, and
(c) coordinating the timing of use of limited farm equipment and limited drying and processing facilities.
Reservoir storage was purposely kept limited in that use can be made of field storage within rice fields, rice being grown under partly submerged or waterlogged conditions. The upper limi t of this field storage is set by a border- overflow height, reached after heavy rainfall, and the lower limit is determined by an incipient cracking of the surface soil. Within these two limits the one-time potential storage is 12 centimetres depth of water, a storage that is periodically replenished. partially or wholly. by rain. Seasonally. this potential field storage accounts for as much as 1. 000 million cubic metres of water, equivalent to one metre depth of water over the project area of 100000 hectares. a quantity that is roughly equivalent to that retained by reservoir storage.
The utilization of field storage (normally within the root-zone) is, of course, a common practice, but in this case, for operation purposes, storage is considered per block of land of about 100 hectares rather than per individual field or for each crop, as is commonly the case.
Water requirements of rice vary according to the growth stage and by staggering planting. a continuous variation in irrigation and drainage requirements is created in various parts of the project area. The staggering of plantings allows limited water resources" equipment and facilities to be spread, but it also requires day-to-day timing of various activities on parts of the project area, a requirement that had led to computerization of water control and other activities.
It will be noted that the key to this operation lies in the
management of farmlands within one block of a given size. Certain implications arise out of this:
(a) As long as flood irrigation is used, the topography within a given block of land must be conducive towards the application of one given depth of water over the whole surface. (There is some margin for manipulation within a block but this can unduly complicate the system).
(b) The soil type should be uniform so that there is negligible variation in percolation rate and water-holding capacity.
(c) Fertility levels should be uniform to avoid uneven growth; and
(d) One crop of the same variety must be grown all over one block.
It is obvious from this description that this scheme is a novel one and the ultimate results of the 'experiment' cannot be foretold at this time.
(2) A second example concerns flood forecasting and flood
control in Japan. Rivers in that country are characterized by short runs and steep gradients. In the southern half of the country they are subject to intense, wide- spread typhoon rainfalls that can last for several days. This combination of factors tends to create severe flooding in the coastal lowlands. Far- reaching flood- control measures are needed and justified to protect urban areas and industrial complexes near the coast.
Several methods have commonly been applied for flood control, namely:
(a) man-made river levees or stop banks;
(b) flood diversion into other rivers, into back swamps, or into special drainage channels running directly to the coast;
(c) outfall control, particularly through curbing sea-water ingress during high tides;
(d) river channel improvement; and
(e) flood- detaining reservoirs.
Of these the first two methods are no longer applicable because of the degree of present-day occuptation of the flood plains and the
coastal plain. While methods (c) and (d) are applied, major emphasis now falls on the last method, that of detaining flood water upstream in man-made reservoirs.
Flood control for the Yodo river, that flows through Osaka is thus concentrated on flood detention. A weir has been built to regulate the level of Lake Biwa. a major source of the Yodo river,
and downstream of it on the mainstream and elsewhere on its
tributaries five multi- purpose reservoirs have been built or are in the process of being completed. Three of these reservoirs afford 63 million cubic metres detention of flood water, while Lake Biwa can give 700 million cubic metres flood-water detention per metre
depth of storage space. CombineCL these afford detention of about
half of the major flood discharges.
---
---~---.---I
1910I
1911JAN I FEB I MAR I APR I MAY I JUN I Jue I AUG I SEP i OCT I NOV I DEC JAN I fES 1 MAR 1 APR I MAY 1 JUN I JUL I Alfll I SfP Iocr NOV I OCt
'IMAI. £J<c'<\V/it,TII»Il. I"O!JNOA110t>J TRfA'MEkI'1' AHD GRCUTING I'Oft FORIUMl' Mill
,08 I itWl I Apfq I MAY ! ,JliN JUe 1 U)
F!G,
OA'ff 20
CRANE RAILS REPLACED
MJ,Y 1,1'7!
DEC
I
JAN I FEB i MA"INSTALL UNiT 24 ,"UtSTOCJI
PLAC!!: CO~CA'Cf!e: FOil
TRANZ!'ORMI!:A STlWCTUiitl!!:
PLACE ((iHeR!T! lill MY! U,2
1 ~11
~ MAJOR ACTIVITi~S.
7
iW7Z
JAN I FEB I MAR I APR I M.Y I J.... I ow I SEP I OCT I tIlJII I DEt
I
COMfl1.HI!: t;:t»;CflI!TE IN Pf:MSTO'CK flROOVJ2 2~ .l1Oj)
' 1 - " " " - " " - = = ; ; ; " - - " ' : 2
i"
PO$ITJOfol U~lT 24 W.i'!Il. GATf;fE8 I APR
OUf,JW'i' A(;T!VlTf
(nO nlll~ ~EI)UlIii!DJ
.iCi1V1'f'i'! iW'f PitH'@( CON7!1i.tCT WOiHi: I
~'1~i1r ~~,,1i AL:t:O
4WLII.It'lC);J £~4
I!VIOI'Ji' e3ii~O con'f!NtI~:I
[l.SEWNlEltf f)~THIr ~ St-a"T
1973
According to recent reports by the Kinki Regional Construction Bureau of the Japanese Ministry of Construction, optimum regulation is attempted by tele-metering the water level at 25 river stations, 5 reservoir stations and 5 lake stations, tele-metering water discharge at 5 stations, and tele-metering rainfall at 36 stations from a central office, where computers aid in arriving at operation decisions.
NETWORK ANALYSIS
Network analysis has been applied in the past to the construction of water works for improving on the sequencing of inputs and timing of activities in order to arrive at the completion of the project by a given date
Following an assembly of information on needed inputs, on timing of inputs, and on time requirements for activities, a network diagram is prepared showing various inputs (and sometimes also activities) by means of 'nodes' (circles, squares or similar symbols). These commonly represent' events'. The nodes are linked by arrows
representing activities performed with or on the inputs. The diagram from left to right shows the sequence in which the work is to be
performed and the timing shown gives the anticipated progress on various dates. Figure 2. the master network prepared for the construction of the third power plant at Grand Coulee dam on the Columbia river (17), gives an example of this type of diagramming.
Dotted arrows in Figure 2 indicate inter- relationships between parallel activities or else show a 'slack'. 'float' or
'waiting' period, sometimes referred to as a 'dummy' activity. The dotted portion of an arrow, that is otherwise solid, represents a lapse of time when no immediate follow- up of an activity is
necessary or possible; pursuance of the activity must wait the completion of one or more other activities. The length of the
arrows shown in Figure 2 represents the time needed for an activity within the time scale shown on the abscissa. In other cases it is not possible to draw a network on a time scale as shown in Figure 2. In that case a master diagram may be drawn on an arbitrary scale and subsidiary diagrams may show the timing more clearly for part of the main activity or of subsidiary activities (2).
Several double lines are shown in Figure 2 that do not
include a dotted section. These represent the 'critical path', that is a sequence of activities that determine the minimum time within which a project can be completed. In attempts to shorten the time needed for completion it would be necessary to shorten these lines. In line with this. a shortening of the time needed for activities not lying on the critical path would have little effect on arriving at an earlier completion date.
Network analysis can thus show in a coordinated manner the requirements for materials, equipment and workers at any given stage. While the timing shown in Figure 2 may seem rigid. in actual fact a certain latitude has been taken into account during preparation of the data to be inserted in the diagram. Firstly,
possible delays due to winter weather had been taken into account and, secondly, time margins had been worked out for completion of
individual activities. The print-out (17) lists hundreds of activities to which have been assigned:
(a) probable duration of an activity;
(b) expected date of completion;
(c) allotted data for completion;
(d) the slack period; and
(e) the time remaining for completion of the whole or of part of the project.
The difference between the expected and allotted dates for completion varies from several weeks to months. Non-adherence to the planned schedule, certainly when the activities lie on the critical path, necessitates a rescheduling of subsequent activities. Thus, utilization of the network principle is not a one-time task but a continuing one during the life time of the overall activity. This means that specialists entirely concerned with network analysis only may be attached to a major project and that close team work is needed. Full utilization of the potential of network analysis does involve a lot of work, but experience has already shown that its use can be profitable, particularly for large and complex projects.
Estimation of the duration of an activity at the time background data for the diagram are prepared constitutes a crucial element, requiring knowledge acquired from corresponding activities in the past. Except for certain routine work, such as the pouring of a certain mass of concrete or the hauling of a given volume of earth, no two projects are similar and considerable experience and
judgement are needed for arriving at sensible background data. However, once it is possible to establish the information shown
under (a) tD (e) above, details can be worked out through a
computer programme. On the other hand, where such information is not obtainable or has to be established on shaky ground. as
applies to non- routine and novel activities, formal network analysis (2) can hardly be applied. This is often pertinent to the overall development of an irrigation project and its subsequent management. Nevertheless, some progress has been made in this direction.
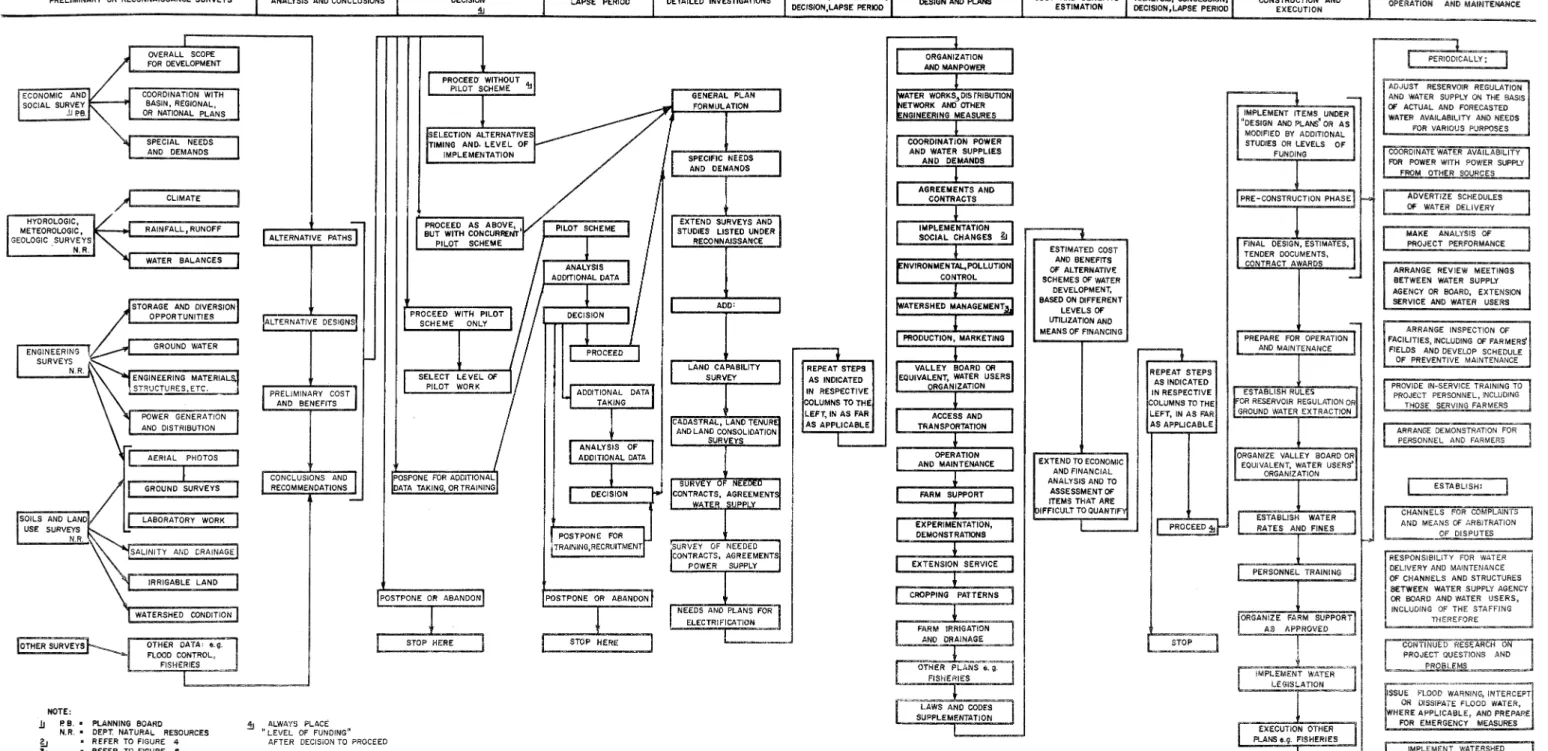
FIGURE 3 OUTLINE OF STEPS IN WATER RESOURCES DEVELOPMENT AND MANAGEMENT, WITH ELEMENTS OF NETWORK ANALYSIS
---r---.---.---~---r_---_.---._---_.---_r---~----~~,~
PRELIMINARY OR RECONNAISSANCE SURVEYS
HYDROLOGIC, METEOROLOGIC, GEOLOGIC SURVEYS
, N.R.
NOTE:
.lJ P. B . • N.R.
OVERALL SCOPE FOR DEVELOPMENT
COORDINATION WITH BASIN, REGIONAL, OR NATIONAL PLANS
SPECIAL NEEDS AND DEMANDS
CLIMATE
RAINFAL.L, RUNOFf
WATER BALANCES
PLANNING BOARD
DEPT. NATURAL RESOURCES REfER TO FIGURE 4
• REFER TO FIGURE 5
ANALYSIS AND CONCLUSIONS
ALTERNATIVE PATHS
ALTERNATIVE DESIGNS
PRELIMINARY COST AND BENEFITS
CONCLUSIONS AND RECOMMENDATIONS
~ ALWAYS PLACE'
II LEVEL OF FUNDINGn
AFTER DECISION TO PROCEED
10
DECISION
!IJ
LAPSE PERIOD DETAILED INVESTIGATIONS ANALYSIS, CONCLUSIONS, DECISION,LAPSE PERIOD
REPEAT STEPS AS INDICATED IN RESPECTIVE COLUMNS TO THE
DESIGN AND PLANS COST AND BENEFITS ANALYSIS, CONCLUSION, ESTIMATION DECISlON,LAPSE PERIOD
ESTIMATED COST AND BENEFITS
OF ALTERNATIVE SCHEMES OF WATER
DEVELOPMENT, BASED ON DIFFERENT
LEVELS OF
UTILIZATION AND MEANS OF FINANCING
EXTEND TO ECONOMIC AND FINANCIAL ANALYSIS AND TO ASSESSMENT OF
ITEMS THAT ARE IFFICULT TO QUANTIF
IN RESPECTIVE COLUMNS TO THE
LEFT, IN AS FAR
AS APPLICABLE
CONSTRUCTION AND
EXECUTION OPERATION /INC MAINTENANCE
PERIODICALLY:
AD,IUST RESERVOIR REGULATION AND WATER SUPPLY ON THE BASIS OF ACTUAL AND FORECASTED WATER AVAILABILITY AND NEEDS
FOR VARIOUS PURPOSES COORDINATE WATER AVAILABILITY FOR POWER WITH POWER SUPPLY
FROM OTHER SOURCES ADVERTIZE SCHEDULES OF WATER DELIVERY MAKE ANALYS!S OF PROJECT PERfORMANCE ARRANGE REVIEW MEETINGS
BETWEEN WATER SUPPLY AGENCY OR BOARD, EXTENSION SERVICE AND WATER USERS
ARRANGE INSPECTION OF FACILITIES, INCLUDING OF FARMERs' FIELDS AND DEVELOP SCHEDULE
OF PREVENTIVE MAINTENANCE PROVIDE IN-SERVICE TRAINING TO
PROJECT PERSONNEL, INCLUDIN~
THOSE SERVING FARMERS ARRANGE DEMONSTRATION FOR
PERSONNEL AND FARMERS
CHANNELS FOR COMPLAIN' AND MEANS Of ARBITRATION
OF DISPUTES RESPONS181UTY FOR WATER DEUVERY AND MAINTENANCE
OF CHANNELS AND STRUCTURES
8ETWEEN WATER SUPPLY AGENCY OR BOARD AND WATER USERS, INCLUD!NG OF THE STAFFING
b .. TIiEREFORE
When formal network analysis is 110t 8 e of a
lack of sound background data (and this often to water
resources development and management). it can yet be of practical significance to attempt an approach towards this type of analysis by merely enumerating in a diagrammatic form all inputs and activities in a logical sequential manner. This has been attempted for
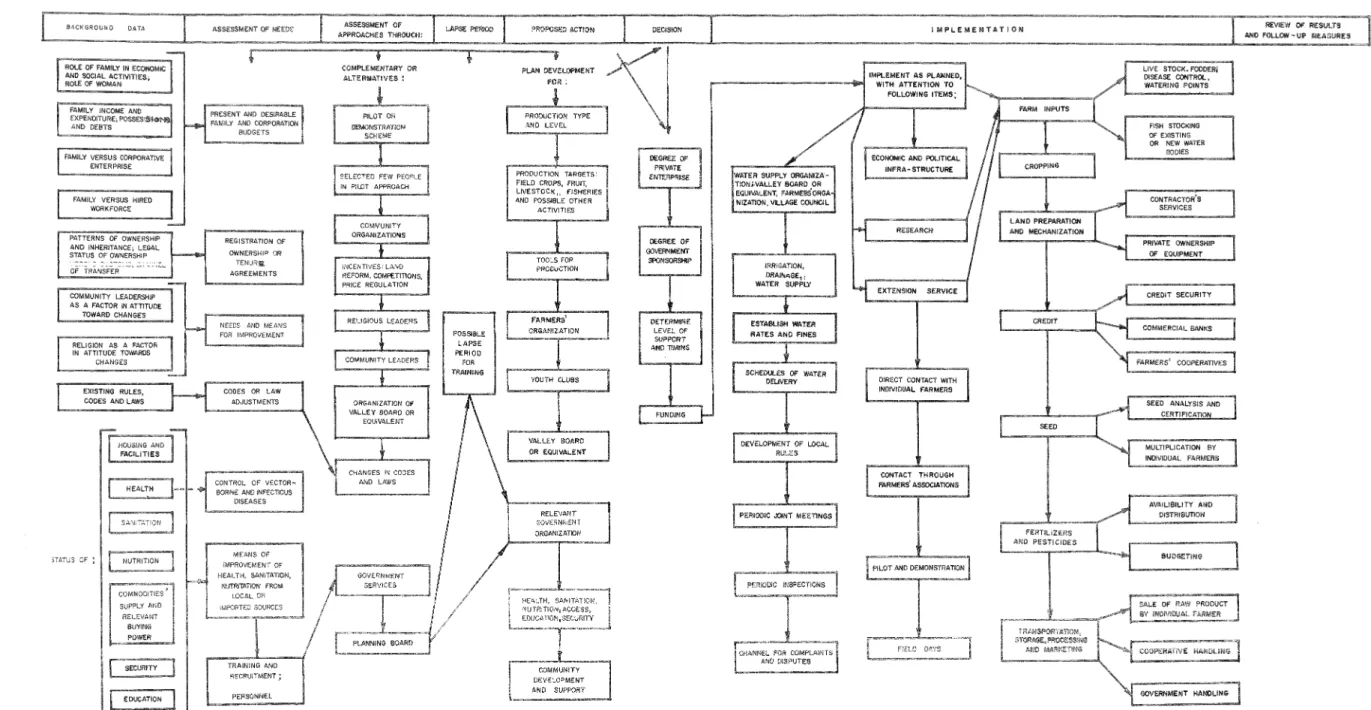
"Outline of steps in water resources development and managernent fI
in FIgure 3; for "Social changes triggered by water resources development for irrigation" in Figure 4; and for "'Watershed Management upstream of an impounded water body" in FJ.gure 5. In preparing these diagrams use has been made of the Muda
diagrams and of work earlier done by FAO (7).
Out of these three diagrams. Figure 3 gives an overall
review of the subject, but it is not sufficient for detailed planning. Two of many activities shown in Figure 3 have therefore been selected for a further analysis, by way of example, as shown in FIgures 4 and 5. Several more diagrams would be needed on
specific details for a more complete analysis.
The type of water resources development outlined in Figure 3 would spread over many years, sometimes over as much as 50 years. While at an initial stage the diagram can serve as a
checklist, at a later stage when more data become available it
may be possible to prepare formal network analysis which, as mentioned, can lead to specific goal setting.
Already Figures 3, 4. and 5 yield inforrnation. It is
obvious from the information they contain, that operation and maintenance of a project is dependent on preparatory measures which should start with the reconnaissance surveys and on steps that run throughout the sequence of project preparation. A scrutiny of the steps reveals that the leaving out of a step or the missing out on timing of a preparatory measure are likely to result in failure to accomplish the goals of the project as envisaged. While this is known in a general way, the figures pinpoint the steps and this can assist in a more systematic
treatment. Even in this form, the figures provide a basis for
periodic checks on inputs, activities and performance, for pin-pointing delays and weaknesses, and for defining areas where additional work needs to be done.
RESER VOIR OPERATION
Reservoir operation is records on streamflow or (b)
ect
of two examples discussed below, a sufficiently record (35 years)
is available for operational planning and this is subjected to a
probability analysis to arrive at mean. extreme low and extreme high inflows, This in turn leads to a planning of water use at
these levels of water availability, In the second res
operation is sirnulated in a much more nlanner on
I - '
I:\!l
I
FIGURE 5
WATERSHED MANAGEMENT UPSTREAM OF AN IMPOUNDED WATER BODY; WITH ELEMENTS OF NETWORK ANALYSIS
SURVEYS
SELECTION OF AREAS FOR GROUND SU RVEYS
GROUND SURVEYS OF VEGETATION, LAND USE AND EROSION
SURVEY OF POTENTIAL LAND USE
PLANS OF MEASURES
-AREAS SELECTED FOR CHANGED LAND USE
AREAS SELECTED FOR INTRODUCTION OF SOIL OONSERVATION MEASURES
WITHOUT CHANGE IN LAND USE
AREAS SELECTED FOR IMPROVING TIMBER YIELD
POSSIBLE MINERAL EXPLOITATION
WILDUFE AND FISHERIES MANAGEMENT
AREAS SELECTED FOR PRESERVATION. FOR RECREATION OR
NATIONAL PARK
PLAN FOR MEANS OF IMPLEMENTATION
SUPERVISORY BOOY
TRAINING OF PERSONNEL
RANGER SERVICE
EXTENSION AND SOIL CONSERVATION SERVICE
DECISION
DECISION ON SCALE AND TIMING OF MANAGEMENT
SCHEME
IMPLEMENTATION
_ . _
-POSSIBLE TIME LAPSE FOR PERSONNEL TRAf,lING
POSSIBLE PRIOR PILOT SCHEME
r---;EFER BACK 10
I
MASTER PLANt---fl
WATER RESOURCESFIG. 4
COMMUNITY LEADERSHIP
AS A FACTOR iN ATTITUDE TOWARD CHANGES
REUGION AS A r:ACTOR IN ATTITUDE TOWARDS
CHANGES
3TATU3 CF :
SOCIAL CHANGES TRIGGERED BY WATER RESOURCE DEVELOPMENT FOR IRRIGATION. W!TH ELEMENTS OF NETWORK ANALYSIS
REGISTRATION Of
OWNERSHIP ClR TENUR&, AGREEMENTS
NEEDS AND MEANS FOR IMPROVEMENT
CONTROL OF VECTOR"'-BORN£ AND Ii'JI'ECTIOUS
DISEASES
ASSESSMENT OF
ORGANIZATION OF VALLEY SOARD OR EQUIVALENT
13
PRODUCTION TARGETS'
FIELD CROPS, FRUIT,
LIVESTOCK" FISHERIES AND POSSIBLE OTHER
ACT!VlTIES
WATER SUPPLY
ORGANIZA-TION,iVALLEY BOARD OR EQUiVALENT, FARMERS ORGA NIZATION, VILLAGE COUNCIL
DEVELOPMENT OF LOCAL
PERiODiC JOINT MEETINGS
DIRECT CONTACT WiTH INDIVIDUAL FARMERS
CONTRACTOR'S SERVICES
PRIVATE OWNERSHIP
1. Operational planning using probability of occurrence of three levels of streamflow.
Records of inflow into the Granby reservoir are available over 35 years and are shown in Table 1 (18). These data are
analyzed for probability of exceedance (P) by:
P%
2M - 1 2N x 100where M is the relative rank of a particular inflow (M is 1 for
eqn. 1
the maximum flow and M is N for the minimum flow, see table 1)
and N is the total number of observations (in this case N- is 35),
Three levels are selected for analysis: reasonable maxirnum. and minimum inflow and most probable (mean) inflow. as indicated in Table 1, yielding values of respectively 306, 000; 174, 000; and
217, 000 acre- feet annual inflow with respectively 10, 90 and 50
percent probability of exceedance.
The next problem to be examined is that of seasonal
distribut-ion of inflow. During the period March to September, flow into
the reservoir is largely a function of snowpack and snowmelt,
both of which show substantial variation from year to year. As
the demand for irrigation water (a major component in the water use pattern) is virtually confined to these months, March to
September are the critical months from a standpoint of operation. During the 35 years of record reasonable maximum and minimum and most probable (mean) inflow during March to September were respectively 288,000; 156,000 and 199,000 acre-feeL On the other hand, during the remaining months, October to February, with no irrigation demand, flow is quite steady and at a low level, averaging 18, 000 acre- feet during the whole of the five- months period over the 35 years of record. For the latter months, the average inflow of 18, 000 acre- feet was taken to represent the inflow during these months during each of the 35 years. For these months the three probable levels of inflow, are as shown in Thble 2.
On the assumption of one or other of the foregoing conditions, operational plans are drawn up for the three sets of conditions for the allocation of water to: firm and secondary power, irrigation, recreation, fisheries, municipal and industrial use, and pollution
keeping sufficient reservoir reserve e for flood
control. catered for.
arE;
The plans call for secondary power to be reduced or
eliminated first during a period of water shortage, so that
previsions need be made for substitution by thermal power at that time. At times of extreme water shortage, the allocation of irrigation water is likely to be restricted and farmers must be
made aware of this possibility. the oth er hand, h inflows
TABLE 1
Probability analysis of annual inflows to Granby reservoir
Water Rank Inflow Probability
year (M)
(1, 000
acre- of exceedance Remarks feet) (percent)1957
1
369.4
1. 43
1962
2
333.4
4.29
Reasonable1952
3
321. 7
7.14
maximum1965
4
306.3
10.00
range1938
5
301. 7
12.86
1947
6
293.3
15.71
1936
7
288.6
18.57
1949
8
280.4
21. 43
1951
9
262.8
24.29
1933
10
253.3
27.14
1960
11
250. 7
30.00
1932
12
241. 7
32.86
1958
13
241. 2
35.71
1945
14
228.6
38.57
1956
15
225.7
41. 43
1942
16
224.b44.29
1961
17
223.6
47.14
1941
18
216.8
50.00
Most probable1935
19
213. 1
52.86
range1943
20
211. 5
55.71
1959
21
203.9
58.57
1939
22
200.8
61. 43
1937
23
196.4
64.29
1953
24
193.5
67.14
1964
25
193.3
70.00
1944
26
185.4
72.86
1948
27
184.4
75.71
1940
28
182.8
78.57
1955
29
180.8
81. 43
1946
30
176.8
84.29
1963
31
174.2
87. 14
1931
32
173.8
90.00
Reasonable1950
33
163.5
92.86
minimum1954
34
132.0
95.71
range1934
35
117.8
98.57
TABLE 2
Distribution of monthly inflow to Granby reservoir
for operational planning
(1, 000 acre- feet)
Reasonable minimum Most probable Reasonable maximum
inflow inflow inflow
October a/ 5.4) 5. 6)
*
5.4)November 3. 8) 3.8) 3. 8)
December 3.3) 18.0 3.3) 18.0 3. 3) 18.0
January 3. 0) 3. 0) 3. 0)
February 2.5) 2. 5) 2. 5)
March 3. 5)
*
2.7}>:< 3. 3)April 12.2) 9.4) 16. 1)
May 39. 7) 43.3) 64.8)
June 65.5) 156.0 90. 0) 199.0 123. 6) 288.0
July 18. 6) 33. 0) 57. 0)
August 9.3) 10.8) 16. 0)
September 7.2) 9. 8 ),~ 7. 2)
a/
For the period October - February reasonable minimum,most probable and reasonable maximum inflows are small in relation to inflows for the remainder of the year and for operational purposes are assumed to be the same.
':< Apparently these are small errors in the original data.
However, they do not interfere with the general conclusions.
lead to the maximum generation of secondary power and, if provisions can be economically made for this, to an increase in the area that can be irrigated. Extremely high inflows, particularly those of short duration are likely to lead to wastage of water to preserve the safety of the dam. The foregoing analysis lays the broad foundation for operation. In addition to the broad plans, annual operating plans are prepared, taking into account such items as initial reservoir content and specific irrigation requirements. Moreover, a day-to-day operational plan is worked out at a central office on the basis of current observations of and forecasts of snowpack, snowmelt and precipitation. The particular office handles a number of projects, making it possible to coordinate water allocations in one river basin with those in another, particularly with regard to power supply and in
one case in respect to possible trans- basin water transfer. Several
computer programmes are used in these operations (13, 14).
2. Detailed simulated reservoir operation
Often, a length of streamflow record of 35 years (as in the preceding example) is not available and this applied to the site of the planned Pa Mong reservoir on the Mekong river. A few years of records only were available at this site so that some means had to be found for extending the streamflow record for design and operational planning. This was done by reconsititution, that is by establishing correlations between various measuring
stations on the river and then extra- or intrapolating the information to the site of the planned reservoir. In this way a record was
created for streamflow from 1930 to 1969, a record that was
assumed to represent what could happen in the future. A reservoir operation plan was then developed for each month of the 40 years
of record, that is for 480 months. In current terminology this can thus be called simulated reservoir operation on the basis of reconstituted streamflow data.
Basic water needs were subsequently established, that is water allocations to irrigation and to industry and domestic use. Water available within the reservoir during or after a period of minimum inflow was then allocated to firm power. Any water available above that of this minimum level was then allocated to
secondary power up to the limit of safe reservoir operation. Inflow above the latter level of operation was scheduled for
retention within the reservoir for flood control or was scheduled for release as wastage. An estimate of needed flood-water release was based on a study of flood damage by a given flow against cost of flood detention or alternative downstream flood-control measures (11, 12).
The latter study was supported by a separate one on a
possible maximum flood once in 200 years, a somewhat arbitrary period often assumed for large reservoirs. The estimate was largely based on the weighting of several physical factors with some extrapolation of available records (20) which constituted a
rather novel approach to the subject, a further discussion of which falls beyond the scope of this paper. The maximum flood inflow thus
estimated
w~s
28,000 m 3 / s, the damage-acceptable flood was estimatedat 17,000 m / s, requiring a maximum flood-water detention of 11,000 m 3 / s. The above description, as well as a review of the water
allocations during the 480 months of simulation, may give the appearance that this type of excercise is within common reach. However, as explained in reference (10), results are in reality based on many trial and error calculations which could hardly be made for a project of any reasonable size without the use of a computer. As such this type of operational planning has only recently become possible.
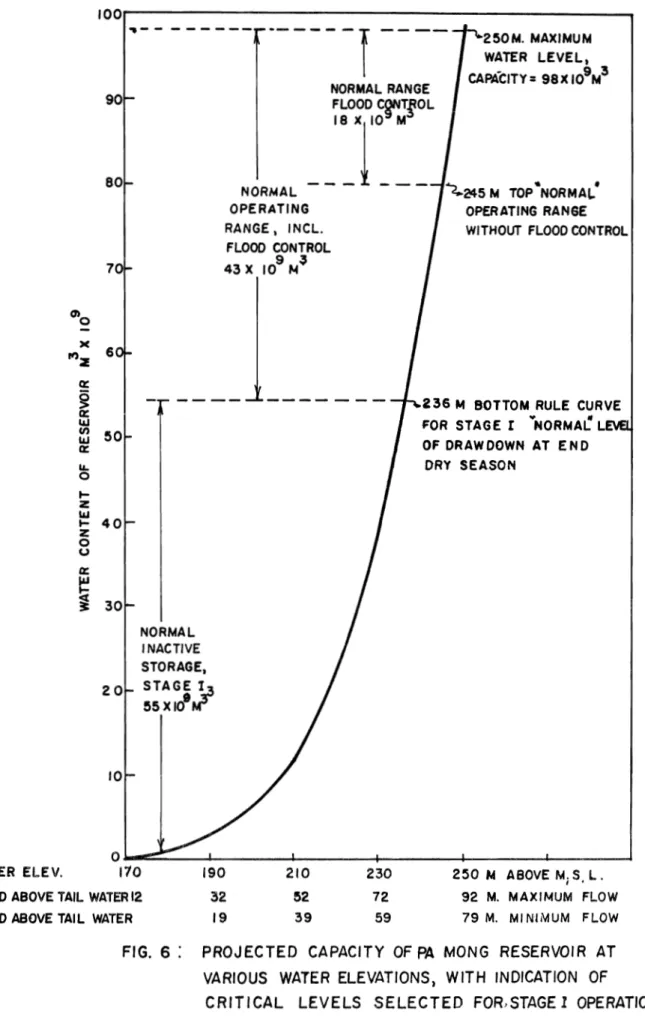
In order to aid day-to- day operations, the monthly data were worked up to provide a rule curve, shown in Figure 7, with an indication of critical reservoir levels of importance for its
operation in Figure 6. It is seen from Figure 7 that the rule curve,
in the usual way, can guide decisions on releases for secondary
power and flood control. The implications of the worked out operating programme are further illustrated by an insertion of information on scheduled reservoir operation during a dry year (1959) and a wet year (1965) for which the reservoir level curves can be compared with the 'normal' or 'average' operation indicated by the rule curve in Figure 7.
During the year of low inflow, 1959, at the beginning of June the reservoir level has dropped to 221 metres compared with 236 metres for 'normal' operation. From January to June the gap or space on the graph between the 'normal' (or rule) curve and the actual operating curve shows that no secondary power can be generated. From July to December, inflow brings the reservoir level close to the 'normal' level, but inflow is still at too Iowa level for secondary power to be produced as shown by the figures for energy production at the bottom of Figure 7.
On the other hand, during the wet year, 1966, Figure 7 shows the initial reservoir level to be above 'normal'. Water releases for secondary power are possible throughout the year as guided by the rule curve which shows the desired reservoir level at any time for
satisfaction of basic demand during the first half of the year and largely, for flood control during the second half of the year. The reservoir space for flood control is completely utilized during the latter half of the year.
The data presented do not represent new concepts; they are intended to show refinements in reservoir operational planning made possible by the use of computer calculations.
Lately, several simulation models have been developed of runoff- rainfall relationships and additional statistical techniques and stochastic techniques have been developed for analysing further rainfall and streamflow data. To date, none of the results from these techniques have found acceptance in the development
0)0
-) ("'z
a:~
a: I.LI en I.LI a: I&. 0....
Z I.LI....
z 0 u a: i'J....
J
1 0 0 r
-90 80 70 6 50 40 30 20 10
,--
---
.---f ----
250M. MAXIMUMWATER LEVEL. CAPACITY = 98 X 109M3
NORMAL OPERATING RANGE. I NCL.
FLOOD CONTROL 43X I09N~
-NORMAL INACTIVE STORAGE, STAGE
J;
55 X 10'
...
..
.
C.245 M TOP NORMA~ OPERATING RANGE WITHOUT FLOOD CONTROL
236 M BOTTOM RULE CURVE FOR STAGE I YNORMAL L OF DRAW DOWN AT END
DRY SEASON
0 __ ~ ____ ~ ______ ~ ______ _+---4---L---~
WATER ELEV. 110 190
32 19 210 52 39 230 72 59
250 M ABOVE M.S l.
HEAD ABOVE TAIL WATER 12
HEAD ABOVE TAIL WATER
,
.
92 M. MAXIMUM FLOW 79 M. MI NIMUM FLOW
FIG. 6: PROJECTED CAPACITY OF PA MONG RESERVOIR AT
VARIOUS WATER ELEVATIONS, WITH INDICATION OF
CRITICAL LEVELS SELECTED FOR, STAGE 1 OPERATION
80
70
a::
g
60a::
~
I.IJ
a::
I-ffi
...
z
o
u
l
./~ESERf\lOIR
ONTE~T
INl
1,2',0
N.IV.
i'\
WET EAR: 1966 3I i ' "
" • TOtAl YEAR INFLOW: 2QII X Ie? IA" /,
I \
1
\
...
.
,
,
.
I
...
I..
.
.
I
.
.
.
.
FIG, 7 SIMULATED OPERATION OF THE PA MONG RESERVOIR BASED ON AN EXTENDED
RECORD OF STREAMFLOW, SHOWING :
( I) NORMAL OPERATION FOR AVERAGE ANNUAL INFLOW BY MEANS OF A RULE CURVE;
(2) ACTUAL OPERATION DURING A WET AND A DRY YEAR; AND
~3) CORRESPONDING POWER PRODUCTI()~ DURING THE WET AND THf: DRY YEAR
of the Mekong project, or elsewhere in the work of the Bureau of Reclamation, or seemingly in any other area where hydrologic data
are needed for design and operational planning. A discussion of
the reasons for this falls beyond the scope of this paper. Neverthe-less. it is possible, even likely. that the newer techniques will provide an additional tool for providing additional hydrologic data, additional to those now available from direct records, from
reconstitution and transposition of streamflow data, and sometimes, rainfall data.
SYSTEMS OPTIMIZATION
Any activity, even the simplest. can be viewed as a system for which a model can be prepared. Moreover, any activity can be expressed mathematically in terms of an equation of equality or functional equation. The equation or set of equations describing the activity represents a model of the system. An equation for a chemical reaction shows exactly what is happening. In a more complicated system, such as the operation of a water resources project, some of the components may not be known; estimated or simulated values are inserted instead and subjected to manipulation for optimization. This last statement may be made clearer by reference to a specific case.
Suppose it is desired to maximize the benefits (or minimize the costs) from operating a reservoir. The net benefit (the objective function) is dependent on manageable conditions such as reservoir level that can be varied within certain limitations or constraints. These constraints consist of. among others. the height of the dam,
reservoir ihflow ~ available head. and the installed or effective
power generating capacity. The net benefit may be a function
(f) of: (a) returns from irrigation, (b) power or fisheries,
employment opportunities. or (c) indirect benefits from recreation.
The maximum net benefit (NB ) is then expressed as follows:
max
NB := f (irrigation. power. fisheries, ernployment.
max
recreation) .... eqn. 2
For optimization one needs to know how much water should be kept in storage and how much released and allocated to each function (the decision variable). For a solution of this equation the
c need to ed in the same units, say dollars.
it is necessary to quantify the benefits
r in terms of dollars and it is
that difficulties in arise.
Assume it is possible to arrive at a quantified
optimization equation. This should lead to a determination of
the maximum benefit over a range of reservoir levels for reservoir releases for specific purposes at specific times. A basic expression is:
T
L
t=
1where T
L
t=
1=
t
(1 + r)
o
(x )t t
=C(x)
summation of results at time t within the time
system T, where T = tl
+
t 2··· .tn ;t can be one day, one month. etc;
gross benefit at time t. The summation would
give Bt
+
Bt ... Bt Bt ;1 2 n
.... eqn. 3
output of system (x). This will depend, for instance. upon reservoir inflow and reservoir level at time t;
the direct cost of obtaining B at time t. Summation
of this and the previous termt will be as indicated before;
the system at time t. Summation would apply to
In a reservoir
the state of the system would be different for each x '
t'
r the discount rate; and
C the amortized cost of the project at time t to be
summated during time T.
Instead of an expression that gives total benefits by summation of individual benefits at time t1 , t2 ... t within the period T. benefits during time T can be Kept constant and Ifhe equation solved for the optimization of benefit (B) derived from individual benefits
b l' b 2 ... b . Other optimization expressions can be developed.
Each case require~ a study of the relationship existing between the
variables and of the feasibility of computation.
In the simplest case, a solution for this type of expression
is obtained by setting the derivative at zero. thus deriving a maximum for benefit or a minimum for cost. Most practical problems are too
complex for such a simple solution. For two-dimensional linear problems such as the farm problem discussed below. a linear programme
solvable by graphical means can be set up. For multi-dimensional linear programmes of higher order. a graphical solution is no longer possible and optimization may be obtainable by application of the Simplex method or another matrix approach.
Many water problems are linear but sometimes non-linear functions can be optimized by dividing a non-non-linear curve in approximating linear segments. Mostly, however, non-linear or dynamic programming is applied. Dracup et al (4) lists twelve search techniques under these headings. While linear
programming has been applied to some practical design problems (13) and to some theoretical analyses (6), neither linear nor dynamic programming seems to have been applied to the practice of operation
and maintenance of a water resources project (16). Work on
possible application of decision theory, queueing theory and stochastic theory seems at the same level of development.
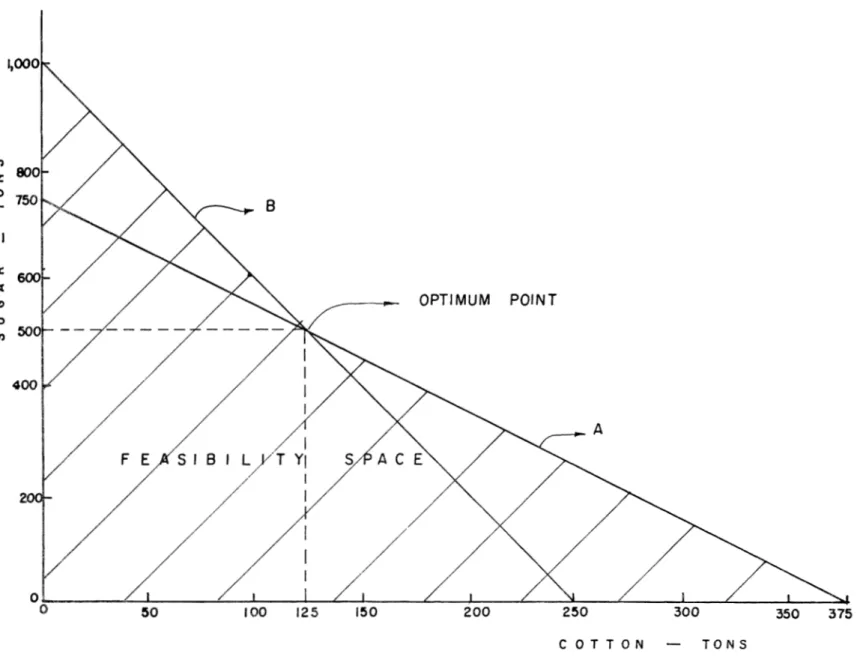
The following example shows how a two- dimensional problem commonly met at the farm level can be solved gqlphically in linear programming.
As sume a choice must be made between the growing of two crops. sugar- cane (S) and cotton (C) for which inputs are:
(0
land area available-
150 acres(ii) total water available
-
400 acre-feetSugar Cotton
(a) water required (acre- feet/ ton) 0.4 1.6
(b) gross return ($/ton) 15 45
(c) cost of production ($/ton) 5 15
(d) yield (acre / ton) 0.2 0.4
The question is: how much of each crop (the decision variables) should be grown for maximum profit, P? This is expressed by the objecti ve function
P
max = (15 - 5)S + (45 - 15)C .... eqn. 4
subject to the constraints of area and water availability, namely,
0.2S
+
0.4C = 1500.4S
+
1.6C 400.... eqn. 5
.... eqn. 6
The limits of feasibility are graphed in :Figure 8. Line A is based on equation 5 which gives a maximum of 750 tons of sugar and 375 tons of cotton. Line B is based on equation 6 which gives a maximum of 1, 000 tons of sugar and 250 tons of cotton. These lines define the feasibility space and within this space the optimum point is defined by the intersection of the two lines which gives 500 tons of sugar and 125 tons of cotton. These quantities give the maximum profit ($8, 750).
A check on the validity of this conclusion is as follows:
Profit: 500 tons sugar at $10/ton $5. 000 (profit based on:
(b) - (c) above)
125 tons cotton at $30/ton = $3,750
total profit $8. 750
t\.?
~
(f)
z o
~
IX 600
.:=:
(!)
1/
;:)
(f) 500t
-400
V
2001-/
/
/
/
F E
X
SIB/
8
./"'-....
'"
-
OPTIMUM POINT~
~VT YI
/ I
/ I
o i / / ! I / I / I / "\I / i / ' "
o
50 100 125 150 200 250 300 350 375COTTON TONS
RECHARGE FROM NATURAL VERTICAL ARTIFICIAL INFILTRATION (In)
RECHARGE ARTIFICIAL RECHARGE
FROM PONDING ( Ia)
THROUGH WELL( 1a)
EXTRACTION
THROUGH WELL(E)~
1
STORATIVITY (S),
TRANSMISSIVITY I INFLOW
AND OUTFLOW AS FUNCTrONS OF HEAD
GROUN D SURFACE
SUBSURFACE INFLOW (Is)
)-
---SUBSURFACE
OUTFLOW, INCLUDING
OUTFLOW FROM SPRING( Os)
ASSUMED EXTENT GROUND WATER
FIG. 9
BASIN WITH DEFINED BOUNDARIES ( £ONFINED BASIN)
SIMULATION MODEL OF A GROUNDWATE R BASIN. E (EXTRACTION)
CAN BE SOLVED WHEN INFLOW AND OUTFLOW ARE KNOWN AND CAN BE ASSESSED IN TERMS OF TRANSMISSIVITY
Trial and error calculations with other combinations will show that this value cannot be exceeded. The solution found also satisfies the area and water constraints. as follows:
500 tons sugar at 0.2 acres/ ton require 125 tons cotton at 0.4 acres/ton require
area available
500 tons sugar at 0.4 acre-feet/ton require 125 tons cotton at 1. 6 acre-feet/ton require
water available
Simulation modelling
100 acres 50 acres 150 acres 200 acre- feet 200 acre-feet 400 acre- feet
There is no clear distinction between the type of modelling referred to in the preceding section and simulation modelling. However, it is convenient to refer to certain modelling under this heading in order to draw attention to some points that have so far not been covered.
Simulation modelling is well- known. It includes physical
simulation modelling of river channels and estuaries and physical analogue models such as the Hele- Shaw model, used for studying flow phenomena. The latter model has been used in Israel in a study of the movement of sea water inland as a result of fresh water with-drawal or recharge close to the coast. by observing the behaviour of two fluids of different density between two parallel glass plates spaced a few millimetres apart.
Simulation modelling is now often attempted without recourse to physical modelling. Diagrams or networks are drawn for
phenomena such as the behaviour of an estuary or a ground-water basin, exemplified by Figure 9 in which general factors affecting the flow pattern of a groundwater basin are presented. This diagram simulates a generally complex situation in a simple manner, on the basis of which an analysis may be attempted.
Many models of this type are over- simplified in order to (a) encompass the natural system, (b) find an explanation for its behaviour, or else (c) to optimize management. While many studies have recently been made. practical application within the field of operation and maintenance seems to be confined to the management of ground water. The usefulness of this type of
modelling for ground water systems is still controversial (1).
It may be possible to assign values to inputs (natural and
artificial recharge) and outputs (withdrawal by pumping or spring outflow). but reliable solutions are difficult to obtain because of a general absence of information on transmissivity within aquifers and within critical areas surrounding them. Without information on transmissivity in areas away from wells, aquifer responses are
hardly assessable. Thus, in Israel. where ground-water management is at an advanced stage, field management is still based on
REFERENCES
(1) Amer. Water Works Ass. Proc. Nat. Symp. Analysis water-resources systems. Ser.5, pp. 99 - 133. 1968. (2) Battersby, A. Network analysis for planning and scheduling.
Macmillan. 1967.
(3) Central Water and Power Comm., New Delhi, India. Report of the Committee on radio-operated river and rain-gauges in the Jumna Basin in 1963.
(4) Dracup, J. A. et al. An assessment of optimization techniques as applied to water resources systems. Environmental Dynamics Inc., Los Angeles. 1970.
(5) Fieringjl M. B. and B. B. Jackson. Synthetic streamflows. Amer. Geophys. Un. Water Resources Mongraph 1.
1971.
(6) Hall, W. A. and J. A. Dracup. Water resources system engineering. Wiley. 1970.
(7) Habrovsky, J. Timing, sequences and strategy in the planning of irrigation systems. Proc. FAO/UNDP seminar on measurements to accelerate benefits from water
development projects by improved irrigation, drainage and water use at the farm level. FAO No. TA2964, pp. 112 - 122. 1970.
(8) Harpaz. Y. and J. Schwarz. Operating a limestone aquifer as a reservoir for water supply system. Bull. Int. Assn. Sci. Hydr. 12, pp. 78 - 90. 1967.
(9) United Nations Inter-regional seminar on the use of modern management techniques in public administration in developing countries, 1970.
(10) United Nations ECAFE Secretariat: U. N. Water Resources Journal. Computer application to systems analysis. St. /ECAFE/Ser. C/57 pp. 31 - 41. Sept. 1963. (11) United Nations ECAFE Secretariat: Mekong Committee.
(12) (13)
(14)
Report of indicative basin plan of the lower Mekong basin. Draft 1970.
United States Bureau of Reclamation; Denver: (refs. 12 - 18) Pa Mong project (Lower Mekong river basin) Report and appendices 7 volumes. 1970 - 1971.
Abstracts of electronic computer programs developed by the Bureau of Reclamation. 5 and 5A 1969 - 1970. Annual operating plans, western division, Missouri
river basin project. 1970 - 1971.
(15) Electronic instrumentation of irrigation systems (P. R. Hanse); and Automation and remote control or irrigation systems (by B. A. Pritchard). Water systems management workshop. 1971 lecture notes. vol. 1; 2-R2 and 2- 01.
(16) Systems analysis in reclamation planning. 1971. (17) Computer print- out for critical path analysis.
Grand Coulee third power-plant, Columbia project. Sepc. DC- 6790. 1971.
(18) Determination of probable reservoir inflows for use in the annual operating plans for the western division systems (by R. L. Berling) 1971.
(19) United States Corps of Engineers, Portland, Ore. Runoff evaluation and streamflow simulation by computer. 1971.
(20) United States Weather Bureau. Probable precipitation. Mekong river basin. Hydromet. report 16. 1970. (21) Wagner, H. M. Principles of operations research with
applications to managerial decisions. Prentice Hall 1969.
APPENDIX 1 List of computer programmes, of interest to operation and maintenance of water resources projects. developed by the U. S. Bureau of Reclamation.
Budget and cash flow
Quarterly budget report Y ear- end budget report
General ledger summary tabulations Budget summary
Cash flow report Outstanding accounts
Accrued expenditure and accounts receivable Investment status
Bond status update Paid up bond report Present worth values
Costing and analysis (see also under operation and maintenance. and hydropower)
Construction repayment assessment lists
Municipal and industrial repayment analysis study Cost estimate
Bi-weekly cost estimate programme Year-end cost summary report Gas and oil payout lists
Water fowl repayments Inventory
Real property intermediate file Real property list of change Update real property master file End of year real property land status Moveable capitalized property records Personnel
Annual personnel reports Personnel roster
Create- update the applicant file
Detailed recruitment summary report Update master training file
Pay- roll calculate and cost- budget account Pay- roll master file update
Temporary appointment report
Operation and maintenance
Machine utilization and material cost
ADP equipment utilization (ADP - Automatic data processing) Job number file maintenance programme
Determination of average service lives Total operation planning system
Equipment failure report Irrigation maintenance update Motor vehicle expense report
Hydropower
Power systems average rate. repayment studies Coordinated power operation studies
Land analysis
Summary of power sales determination Net revenue calculation
Repayment program
Transmission line performance Project use power computation
Powerplant hourly load duration curves Powerplant generation analysis
Powerrate and repayment table
Generator reactive capability curves
Parallel operation of A-C and D-C transmission Power system short circuit
Powerplant peak- off-peak generator Power billing program
Power rate and repayment table
Irrigation and land use
Prepare land utilization reports Land use and crop summary Farm budget calculation
Seepage loss from small canals and laterals Irrigation discharge quantitites
Annual crop census
Canal and lateral earthwork end areas Borrow area excavation tables
Earthwork volume system Properties of soils
Land classification Soil chemical analysis Irrigation requirements Consumptive use of water
Evapotranspiration and irrigation efficiencies
Hydrology
Computation of venturi meter discharge tables Radio-isotopes discharge measurements
Water surface profiles by standard step method Flow net for abrupt offsets in a canal
Venturi meter calibration
Analysis of water hammer in pipe line systems Flow duration analysis of stream flow records Flood study hydrograph computation
Depth-duration analysis Drought analysis
Ground water operation
Ground water flow by relaxation method Drawdown curves with curvilinear flow Ground water contour plot
Statistical analysis of piezometer data Ground water hydrograph plot
General
Network analysis system
Water supply and reservoir operation studies College library file update
Forecast of water supply and requirements Water quality analysis
Stochastic (probablistic) operation studies
LINCOLN PAPERS IN WATER RESOURCES
1 Water Resources Symposium 40th ANSAAS Congress
Proceedings - Part 1 (April 1968) - out of print
2 Water Resources Symposium 40th ANZAAS Congress
Proceedings - Part 2 (April 1968) - out of print
3 Hydrological Characteristics of Catchments
-Walter C. Boughton. Lag Time in Natural Catchments:
A. J. Askey (July 1968) - out of print
4 Financing Catchments Schemes in New Zealand. Papers
presented at a training course organised by the New Zealand Association of Soil Conservation (August 1968)
5 The Measurement of Soil Loss from Fractional Acre
Plots: J. A. Hayward (September 1968)
6 Contour Plans by Computer: Walter C. Boughton
(February 1969)
7 The Use of Fractional Acre Plots to Predict Soil
Loss from a Mountain Catchment: J. A. Hayward (June 1969)
8 Watershed Management Part 1: Editor. J. A. Hayward
(December 1969)
9 Watershed Management Part 2: Editor, J. A. Hayward
(December 1969)